| Param | Original file | Final file |
|---|---|---|
| Filename | modeM0/AS1G06_029T01_9000000964_07039cztM0_level2.evt | modeM0/AS1G06_029T01_9000000964_07039cztM0_level2_quad_clean.evt |
| Size (bytes) | 560,033,280 | 107,602,560 |
| Size | 534.1 MB | 102.6 MB |
| Events in quadrant A | 3,574,232 | 699,324 |
| Events in quadrant B | 4,060,339 | 695,771 |
| Events in quadrant C | 3,511,204 | 700,985 |
| Events in quadrant D | 5,314,352 | 648,933 |
| Mode M0 | |||
|---|---|---|---|
| Quadrant | BADHDUFLAG | Total packets | Discarded packets |
| A | 0 | 15531 | 2 |
| B | 0 | 16666 | 1 |
| C | 0 | 15487 | 1 |
| D | 0 | 20477 | 1 |
| Mode M9 | |||
|---|---|---|---|
| Quadrant | BADHDUFLAG | Total packets | Discarded packets |
| A | 0 | 2 | 0 |
| B | 0 | 2 | 0 |
| C | 0 | 2 | 0 |
| D | 0 | 2 | 0 |
| Mode SS | |||
|---|---|---|---|
| Quadrant | BADHDUFLAG | Total packets | Discarded packets |
| A | 0 | 150 | 0 |
| B | 0 | 150 | 0 |
| C | 0 | 150 | 0 |
| D | 0 | 150 | 0 |
| Quadrant | Total seconds | Saturated seconds | Saturation percentage |
|---|---|---|---|
| A | 7380 | 221 | 2.994580% |
| B | 7380 | 339 | 4.593496% |
| C | 7380 | 114 | 1.544715% |
| D | 7380 | 449 | 6.084011% |
Noise dominated data is calculated using 1-second bins in cleaned event files. If a bin has >2000 counts, and if more than 50% of those come from <1% of pixels, then it is considered to be noise-dominated and hence unusable.
| Quadrant | # 1 sec bins | Bins with >0 counts | Bins with >2000 counts | High rate bins dominated by noise | Noise dominated (total time) | Noise dominated (detector-on time) | Marked lightcurve |
|---|---|---|---|---|---|---|---|
| A | 7475 | 7382 | 0 | 0 | 0.00% | 0.00% | 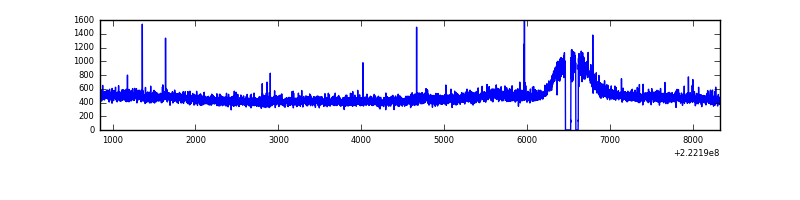 |
| B | 7475 | 7382 | 88 | 88 | 1.18% | 1.19% | 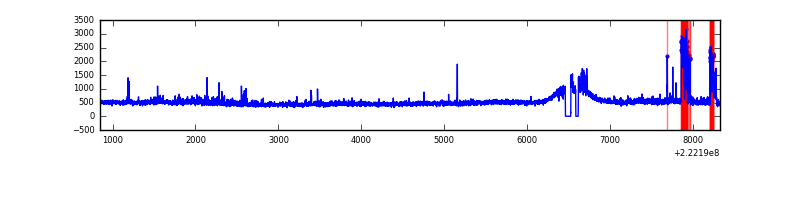 |
| C | 7475 | 7382 | 0 | 0 | 0.00% | 0.00% | 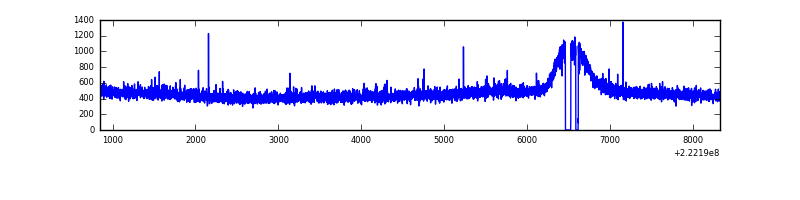 |
| D | 7475 | 7382 | 271 | 271 | 3.63% | 3.67% | 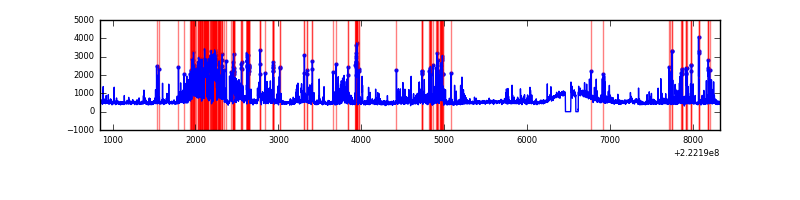 |
Top three noisy pixels from each quadrant. If the there are fewer than three noisy pixels in the level2.evt file, extra rows are filled as -1
| Pixel properties | Quadrant properties | ||||||
|---|---|---|---|---|---|---|---|
| Quadrant | DetID | PixID | Counts | Sigma | Mean | Median | Sigma |
| A | 15 | 234 | 17802 | 88.85 | 919 | 900 | 190.2 |
| A | 13 | 248 | 14455 | 71.25 | 919 | 900 | 190.2 |
| A | 0 | 226 | 8924 | 42.18 | 919 | 900 | 190.2 |
| B | 4 | 80 | 180722 | 1013.9 | 915 | 895 | 177.4 |
| B | 0 | 214 | 145748 | 816.71 | 915 | 895 | 177.4 |
| B | 0 | 228 | 82571 | 460.5 | 915 | 895 | 177.4 |
| C | 1 | 16 | 10339 | 44.89 | 894 | 903 | 210.2 |
| C | 13 | 61 | 7003 | 29.02 | 894 | 903 | 210.2 |
| C | 12 | 4 | 5412 | 21.45 | 894 | 903 | 210.2 |
| D | 12 | 233 | 878182 | 3997.35 | 884 | 858 | 219.5 |
| D | 2 | 216 | 642167 | 2922.0 | 884 | 858 | 219.5 |
| D | 8 | 195 | 313598 | 1424.94 | 884 | 858 | 219.5 |
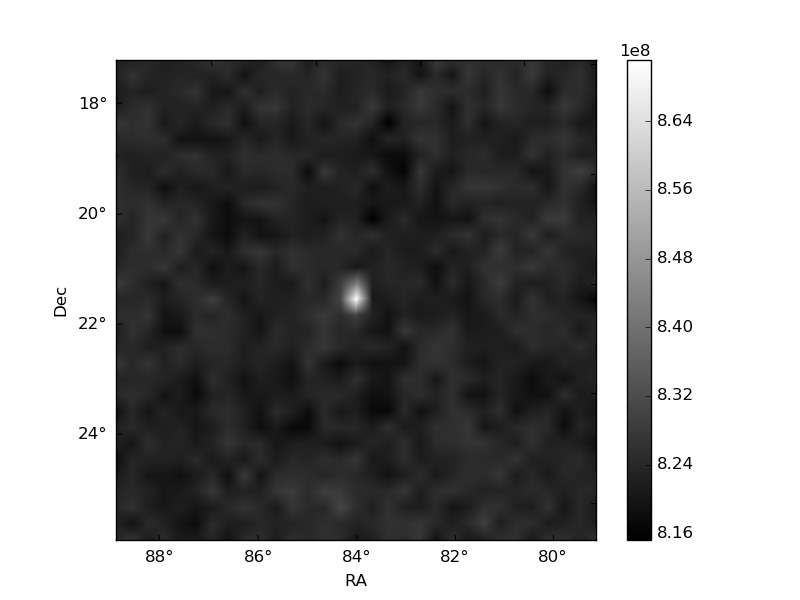
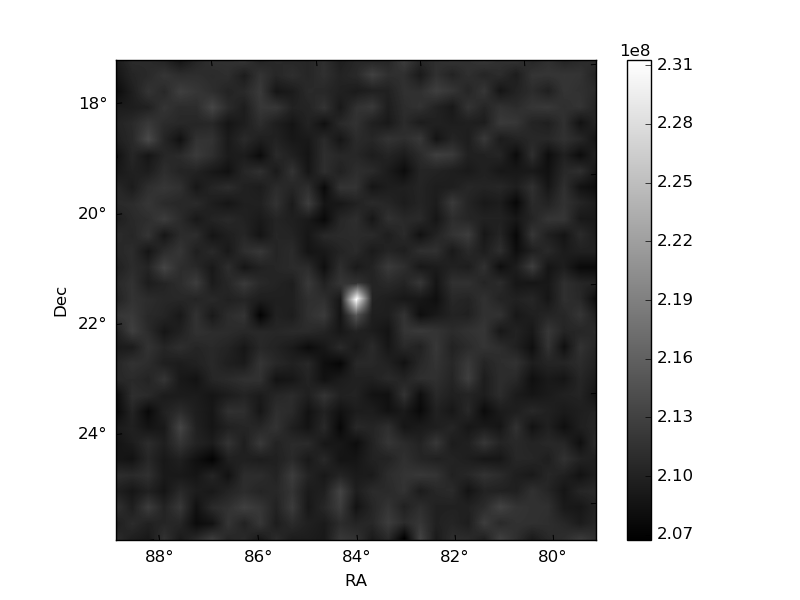
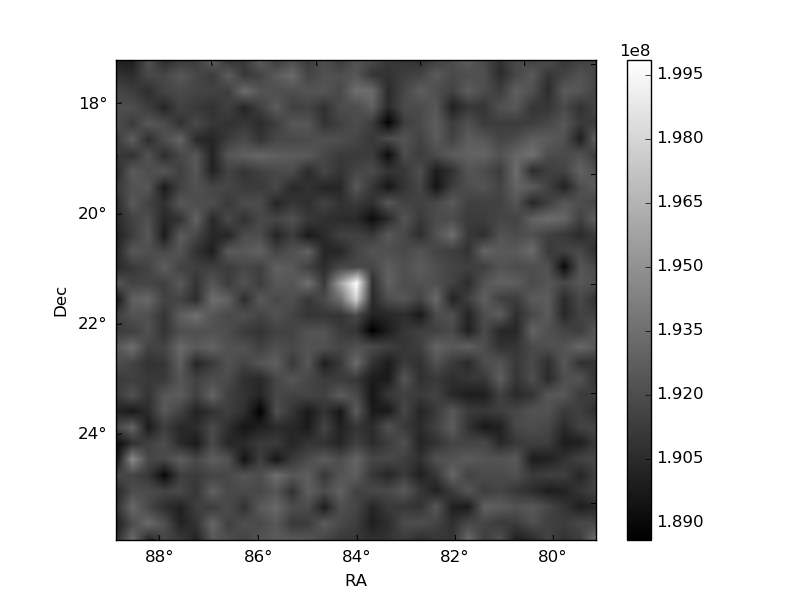
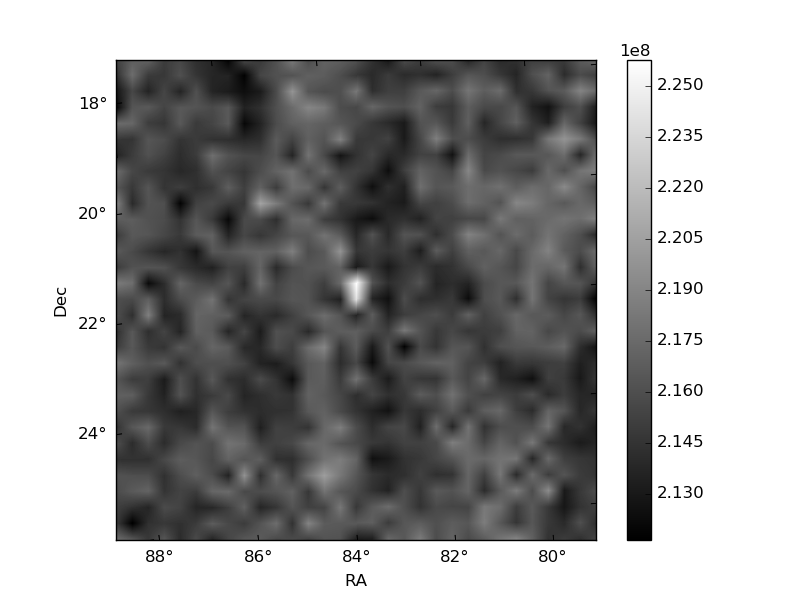
Histogram calculated using DETX and DETY for each event in the final _common_clean file
| Quadrant A | 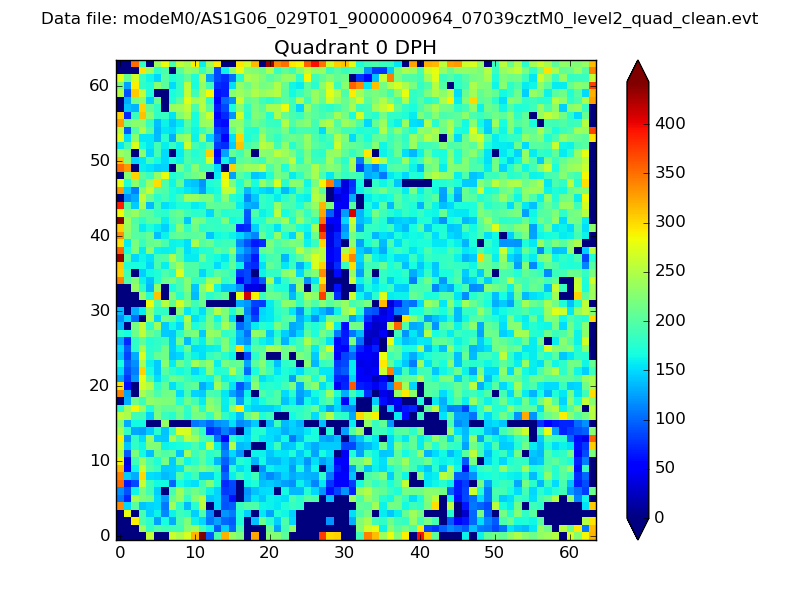 |
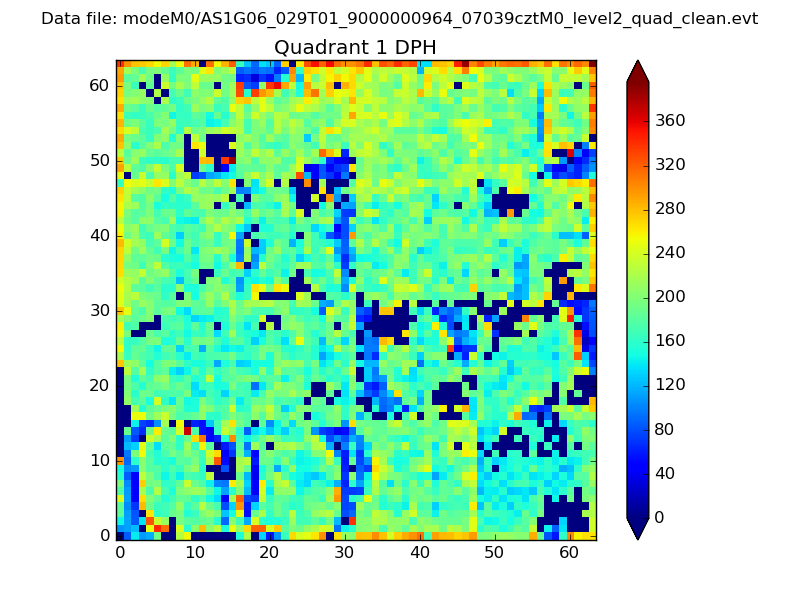 |
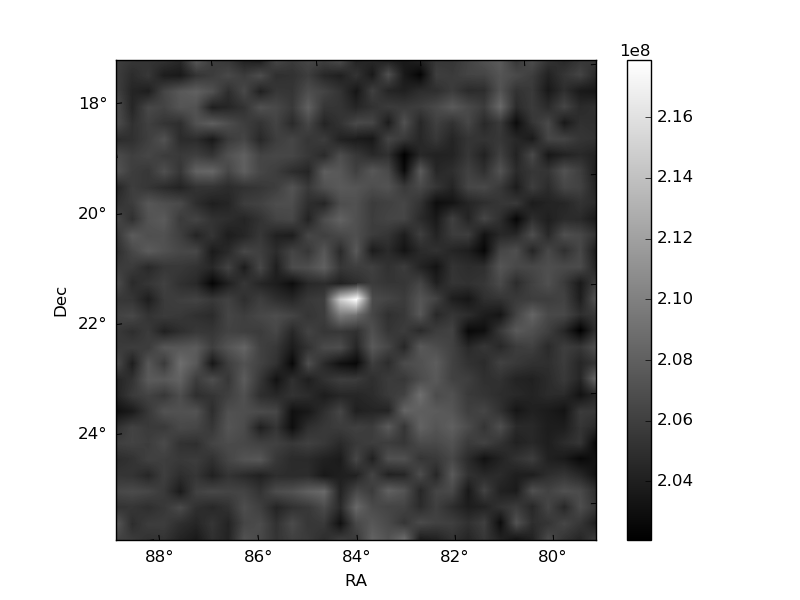
Quadrant B |
|---|---|---|---|
| Quadrant D | 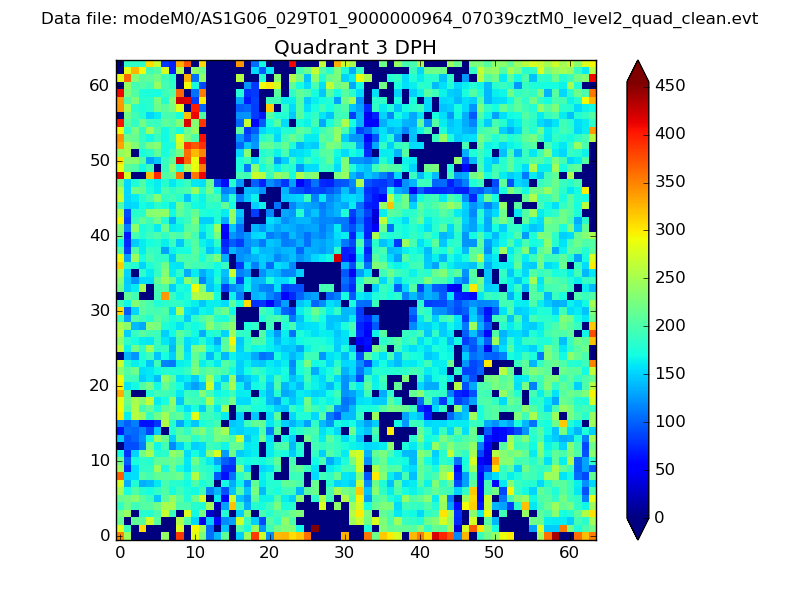 |
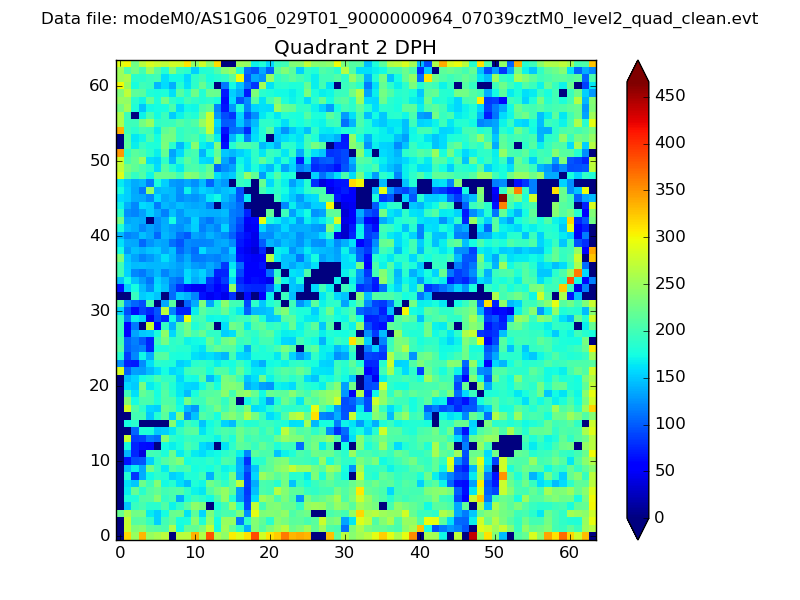 |
Quadrant C |
| Plot type | Count rate plots | Images |
|---|---|---|
| Comparison with Poisson distribution Blue bars denote a histogram of data divided into 1 sec bins. Red curve is a Poisson curve with rate = median count rate of data. |
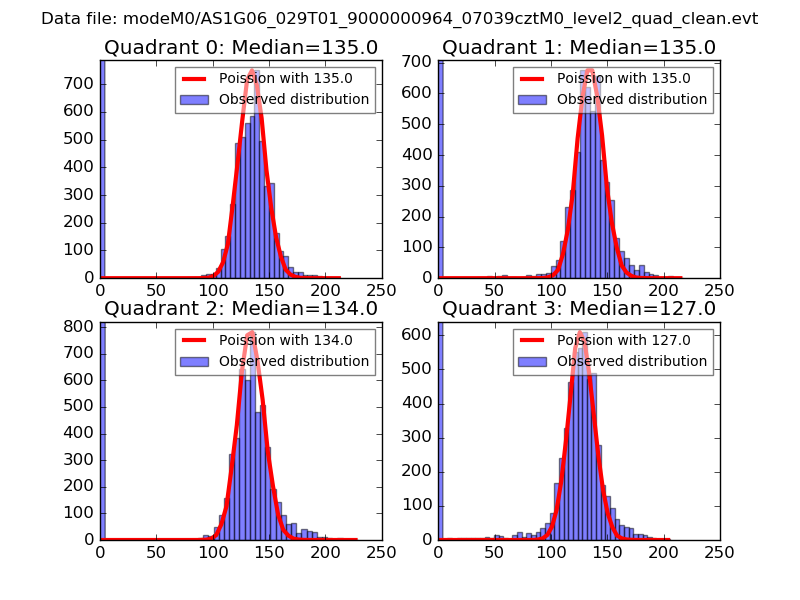 |
 |
| Quadrant-wise count rates Data is divided into 100 sec bins |
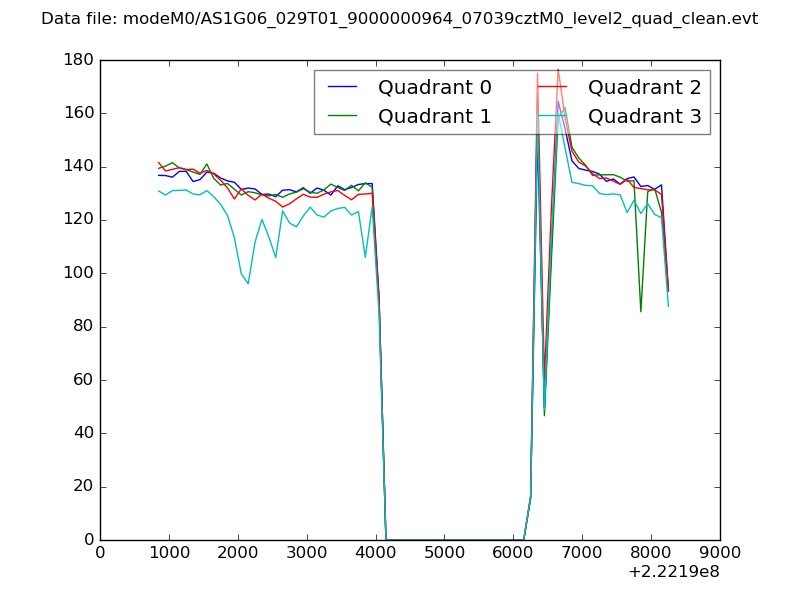 |
|
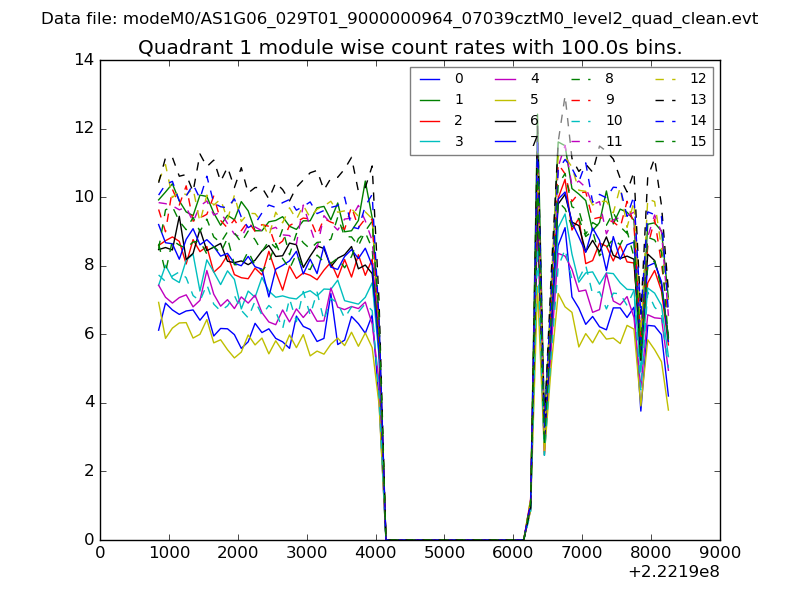
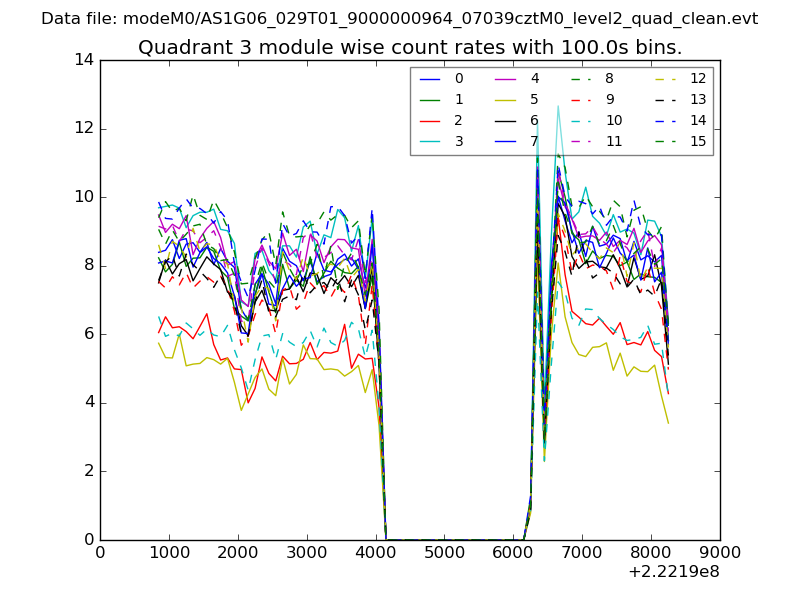
| Module-wise count rates for Quadrant A Data is divided into 100 sec bins |
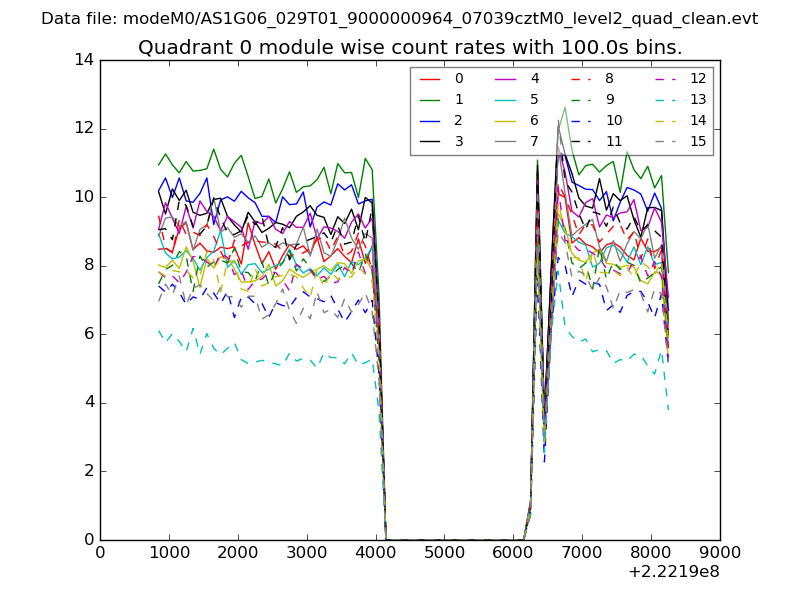 |
 |
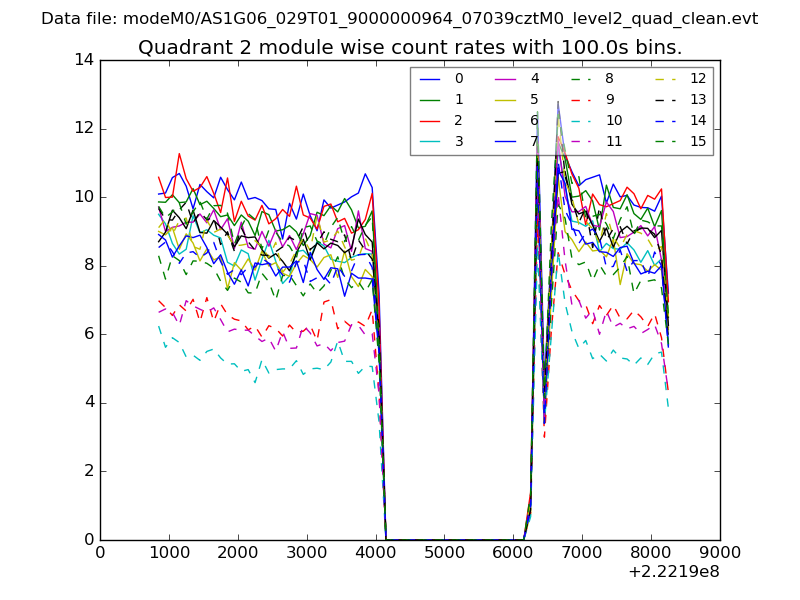
| Module-wise count rates for Quadrant B Data is divided into 100 sec bins |
 |
 |
| Module-wise count rates for Quadrant C Data is divided into 100 sec bins |
 |
 |
| Module-wise count rates for Quadrant D Data is divided into 100 sec bins |
 |
 |
| Parameter | Plot |
|---|---|
| CZT HV Monitor | 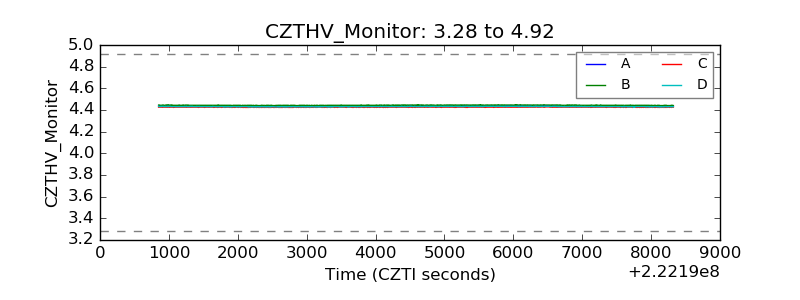 |
| D_VDD | 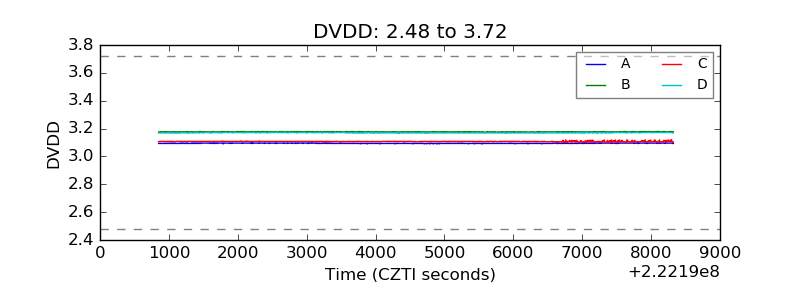 |
| Temperature 1 | 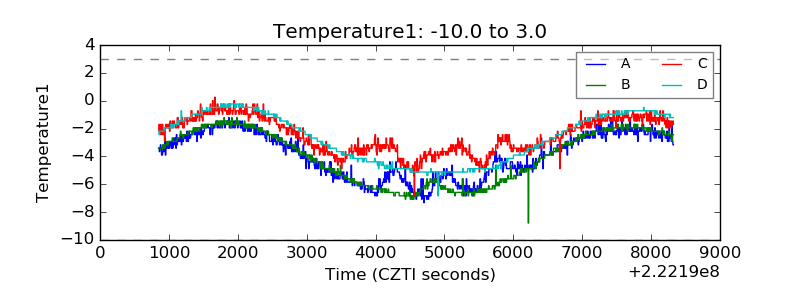 |
| Veto HV Monitor | 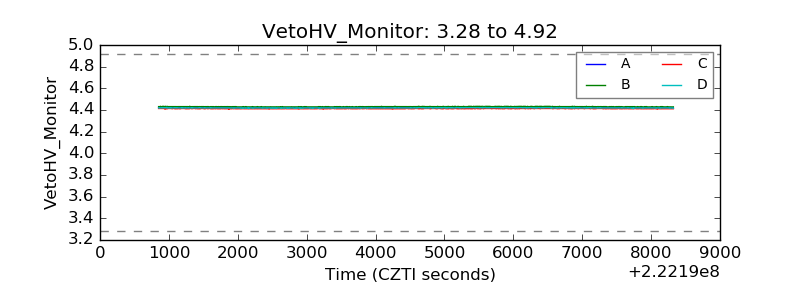 |
| Veto LLD | 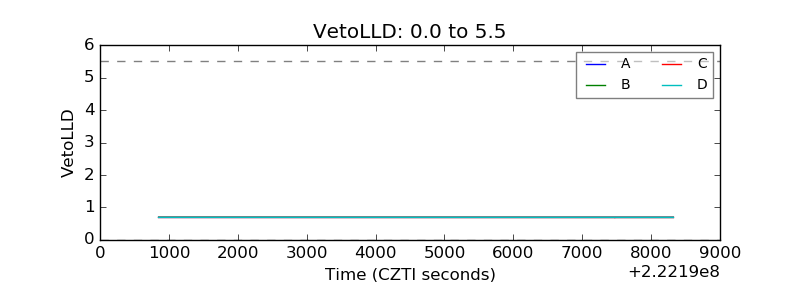 |
| Alpha Counter | 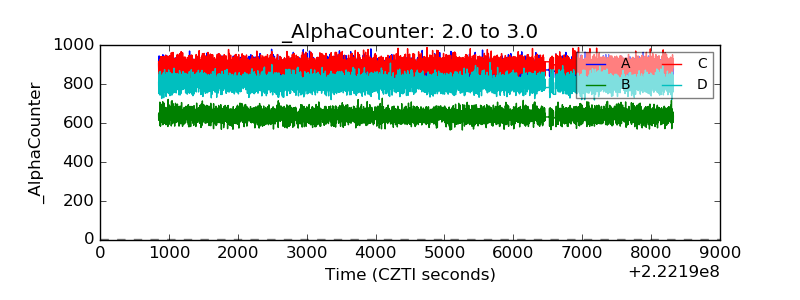 |
| _CPM_Rate | 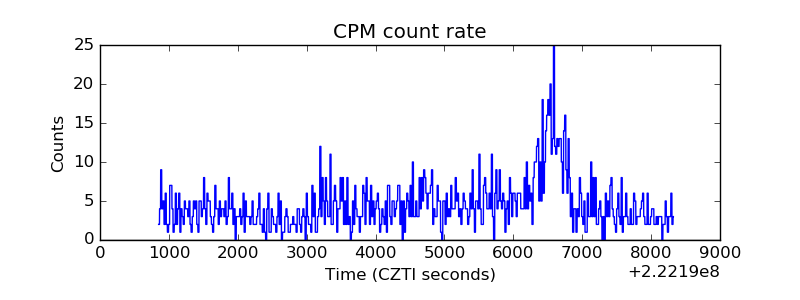 |
| CZT Counter | 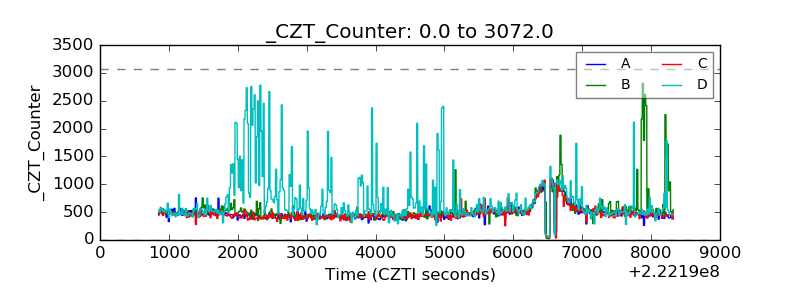 |
| +2.5 Volts monitor |  |
| +5 Volts monitor |  |
| _ROLL_ROT | 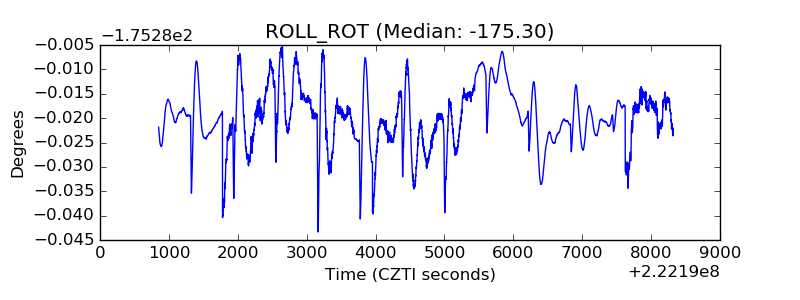 |
| _Roll_DEC | 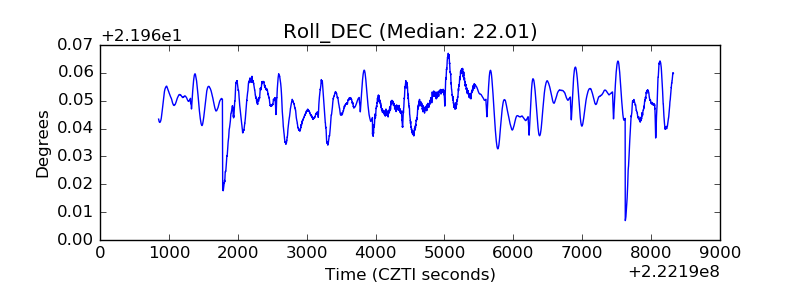 |
| _Roll_RA | 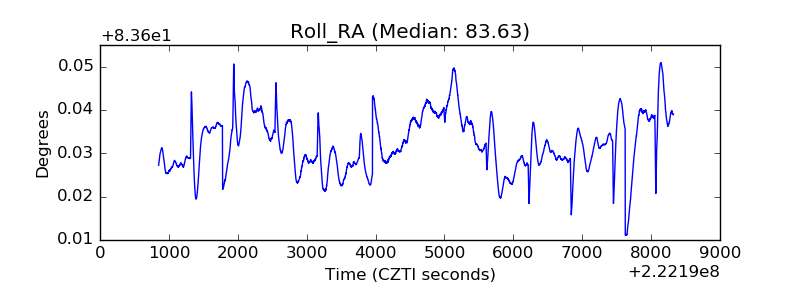 |
| Veto Counter | 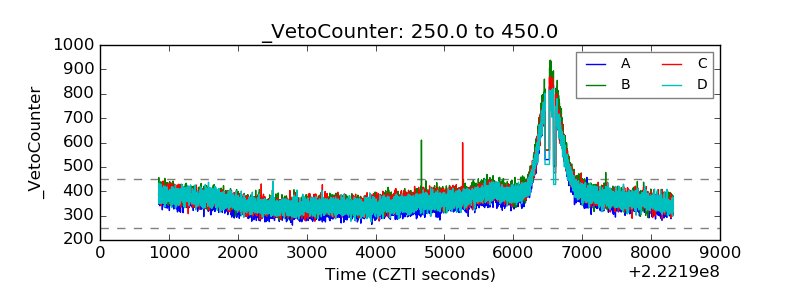 |