| Param | Original file | Final file |
|---|---|---|
| Filename | modeM0/AS1G06_029T01_9000000964_07040cztM0_level2.evt | modeM0/AS1G06_029T01_9000000964_07040cztM0_level2_quad_clean.evt |
| Size (bytes) | 430,882,560 | 82,160,640 |
| Size | 410.9 MB | 78.4 MB |
| Events in quadrant A | 2,863,984 | 525,139 |
| Events in quadrant B | 3,265,850 | 522,671 |
| Events in quadrant C | 2,830,973 | 521,882 |
| Events in quadrant D | 3,673,131 | 491,747 |
| Mode M0 | |||
|---|---|---|---|
| Quadrant | BADHDUFLAG | Total packets | Discarded packets |
| A | 0 | 12622 | 2 |
| B | 0 | 13619 | 1 |
| C | 0 | 12558 | 1 |
| D | 0 | 14713 | 1 |
| Mode M9 | |||
|---|---|---|---|
| Quadrant | BADHDUFLAG | Total packets | Discarded packets |
| A | 0 | 4 | 0 |
| B | 0 | 4 | 0 |
| C | 0 | 4 | 0 |
| D | 0 | 4 | 0 |
| Mode SS | |||
|---|---|---|---|
| Quadrant | BADHDUFLAG | Total packets | Discarded packets |
| A | 0 | 124 | 0 |
| B | 0 | 124 | 0 |
| C | 0 | 124 | 0 |
| D | 0 | 124 | 0 |
| Quadrant | Total seconds | Saturated seconds | Saturation percentage |
|---|---|---|---|
| A | 6109 | 69 | 1.129481% |
| B | 6109 | 152 | 2.488132% |
| C | 6109 | 28 | 0.458340% |
| D | 6109 | 150 | 2.455394% |
Noise dominated data is calculated using 1-second bins in cleaned event files. If a bin has >2000 counts, and if more than 50% of those come from <1% of pixels, then it is considered to be noise-dominated and hence unusable.
| Quadrant | # 1 sec bins | Bins with >0 counts | Bins with >2000 counts | High rate bins dominated by noise | Noise dominated (total time) | Noise dominated (detector-on time) | Marked lightcurve |
|---|---|---|---|---|---|---|---|
| A | 6494 | 6110 | 0 | 0 | 0.00% | 0.00% | 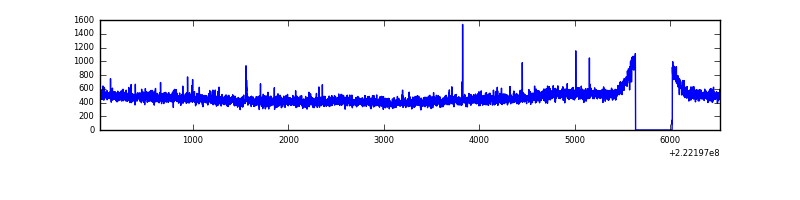 |
| B | 6494 | 6110 | 89 | 89 | 1.37% | 1.46% | 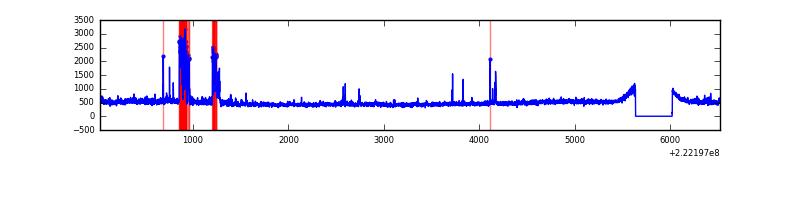 |
| C | 6494 | 6110 | 0 | 0 | 0.00% | 0.00% | 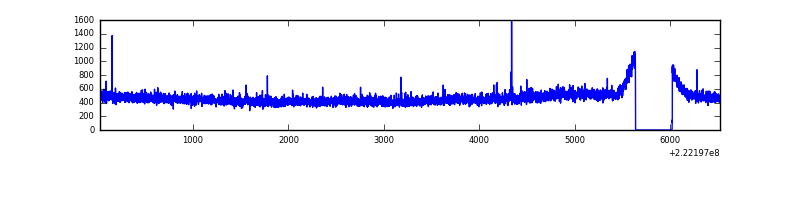 |
| D | 6494 | 6110 | 84 | 84 | 1.29% | 1.37% | 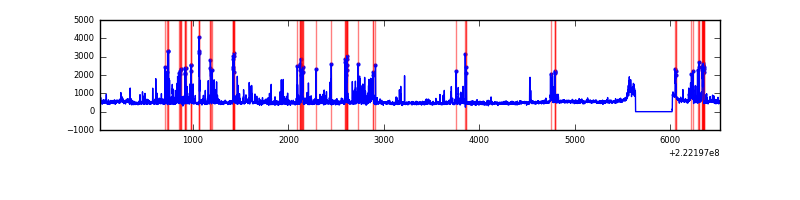 |
Top three noisy pixels from each quadrant. If the there are fewer than three noisy pixels in the level2.evt file, extra rows are filled as -1
| Pixel properties | Quadrant properties | ||||||
|---|---|---|---|---|---|---|---|
| Quadrant | DetID | PixID | Counts | Sigma | Mean | Median | Sigma |
| A | 15 | 234 | 7338 | 43.24 | 740 | 725 | 152.9 |
| A | 0 | 226 | 7141 | 41.96 | 740 | 725 | 152.9 |
| A | 13 | 14 | 6952 | 40.72 | 740 | 725 | 152.9 |
| B | 4 | 80 | 180561 | 1262.58 | 739 | 725 | 142.4 |
| B | 0 | 214 | 84981 | 591.54 | 739 | 725 | 142.4 |
| B | 0 | 228 | 80038 | 556.83 | 739 | 725 | 142.4 |
| C | 8 | 128 | 11464 | 63.91 | 715 | 722 | 168.1 |
| C | 1 | 16 | 10164 | 56.18 | 715 | 722 | 168.1 |
| C | 12 | 4 | 6273 | 33.03 | 715 | 722 | 168.1 |
| D | 2 | 216 | 467650 | 2614.0 | 713 | 691 | 178.6 |
| D | 8 | 195 | 285206 | 1592.69 | 713 | 691 | 178.6 |
| D | 12 | 233 | 115768 | 644.19 | 713 | 691 | 178.6 |
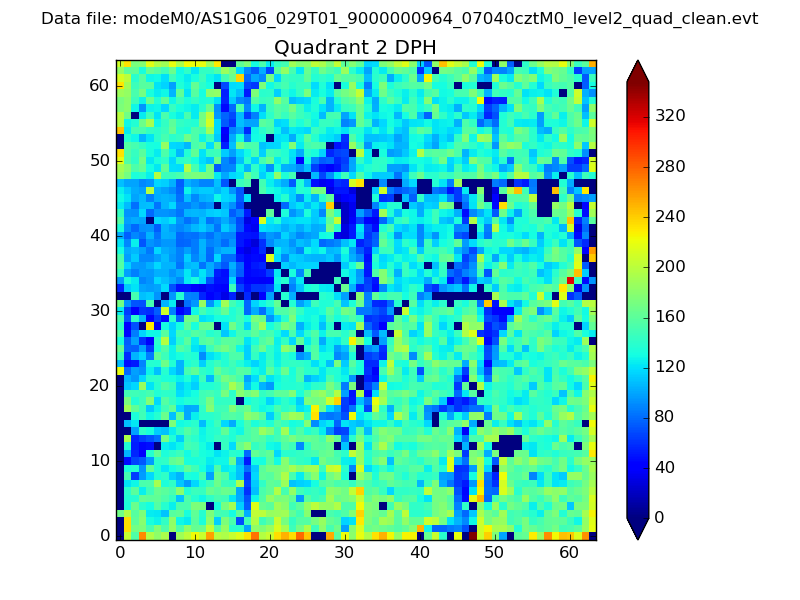
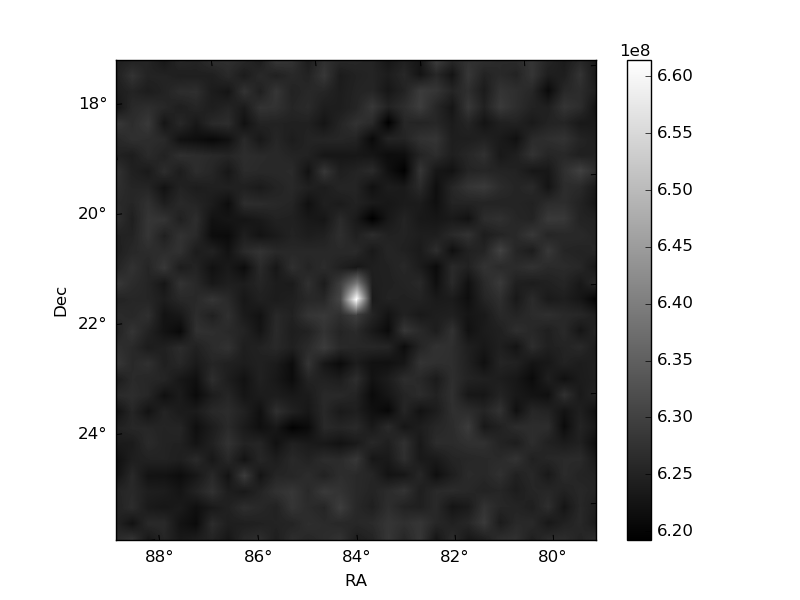
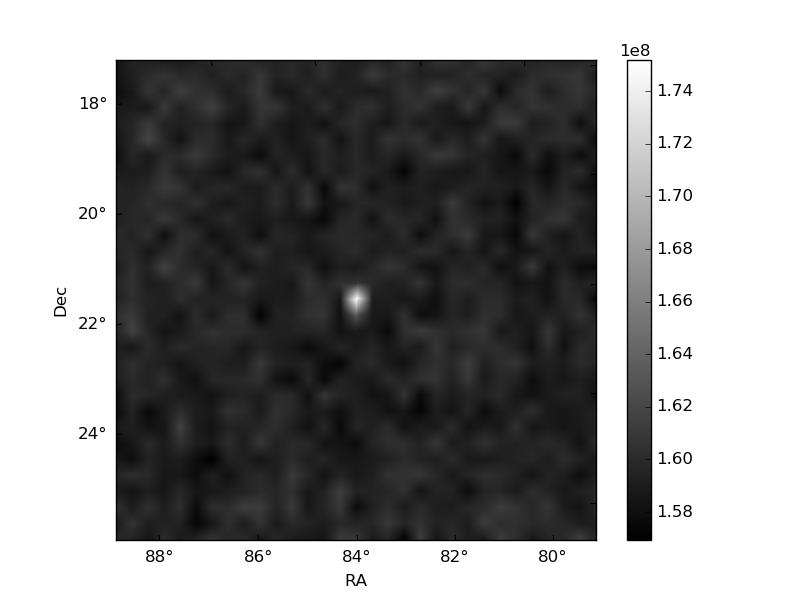
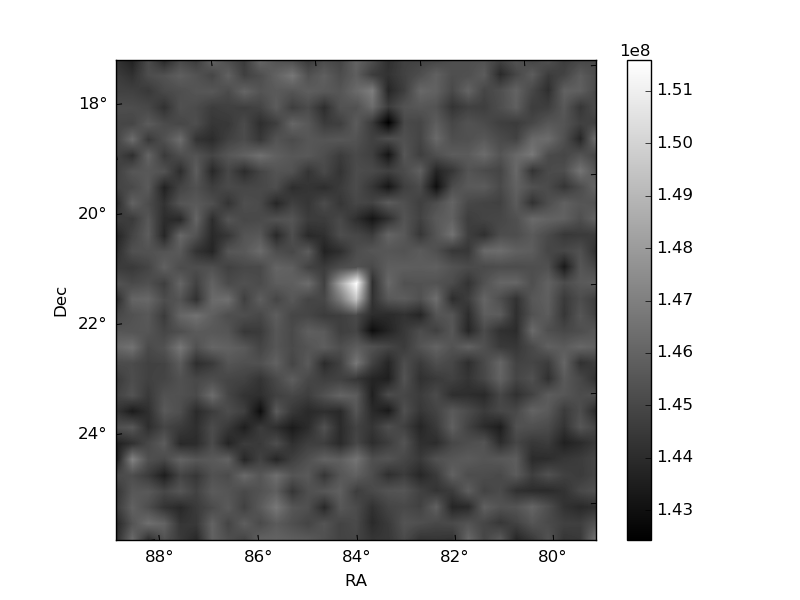
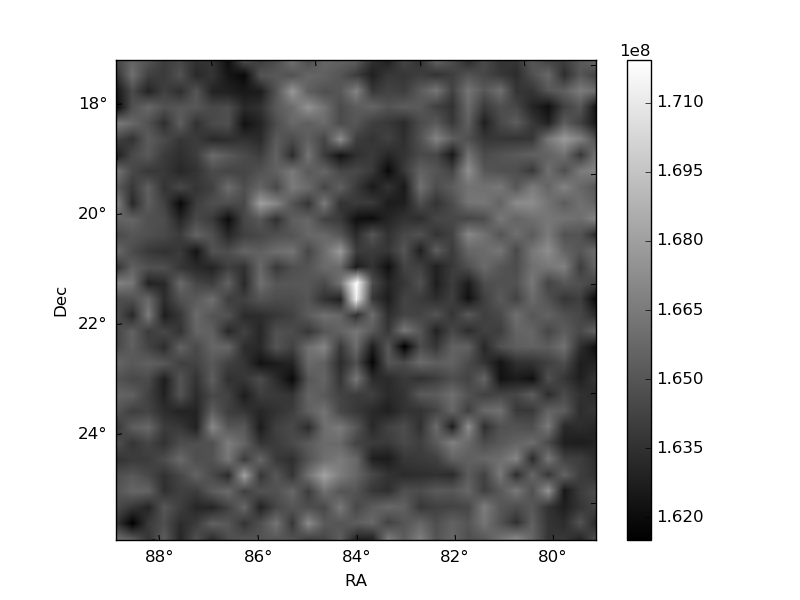
Histogram calculated using DETX and DETY for each event in the final _common_clean file
| Quadrant A | 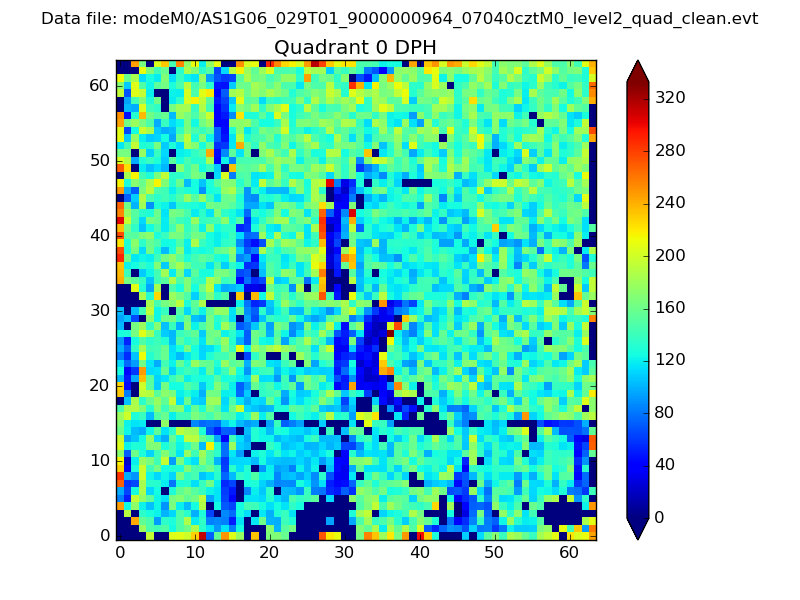 |
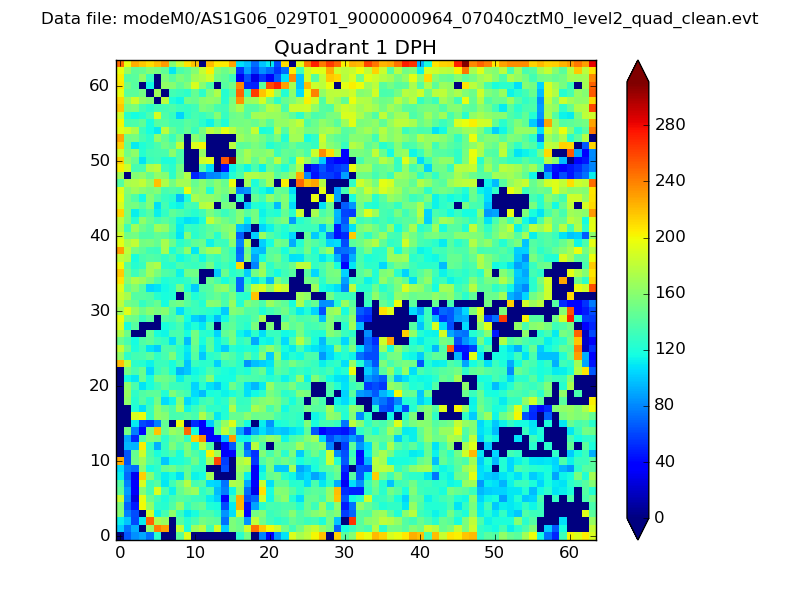 |
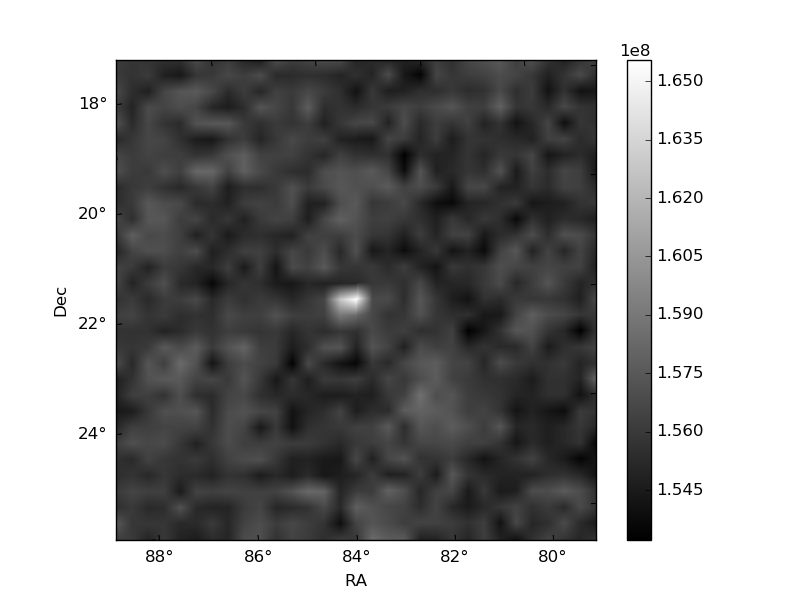
Quadrant B |
|---|---|---|---|
| Quadrant D | 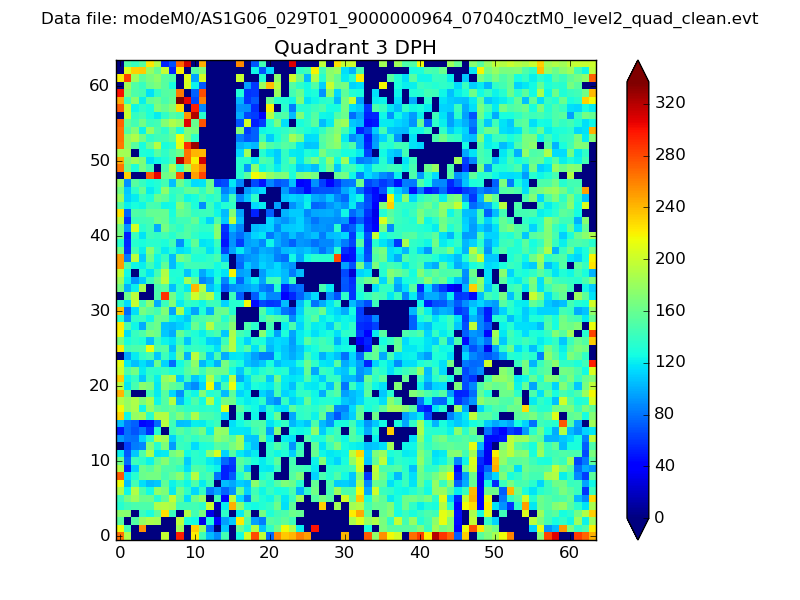 |
 |
Quadrant C |
| Plot type | Count rate plots | Images |
|---|---|---|
| Comparison with Poisson distribution Blue bars denote a histogram of data divided into 1 sec bins. Red curve is a Poisson curve with rate = median count rate of data. |
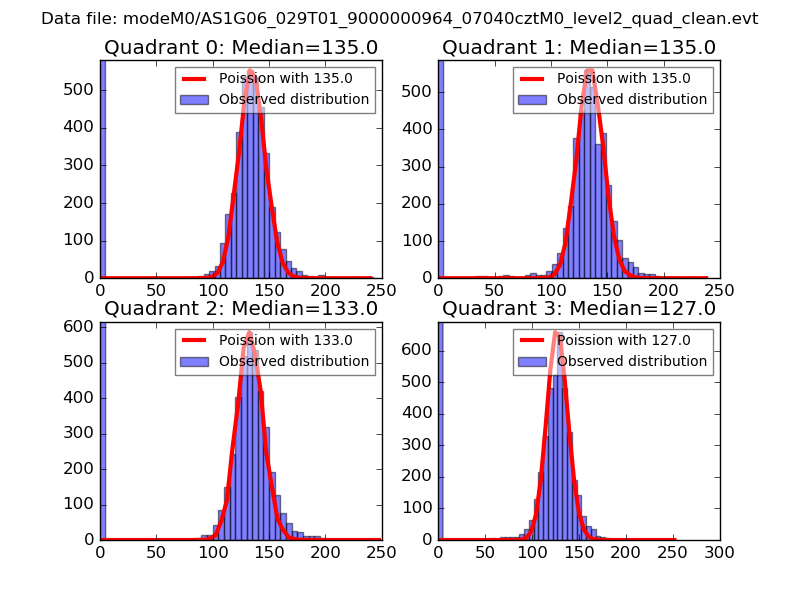 |
 |
| Quadrant-wise count rates Data is divided into 100 sec bins |
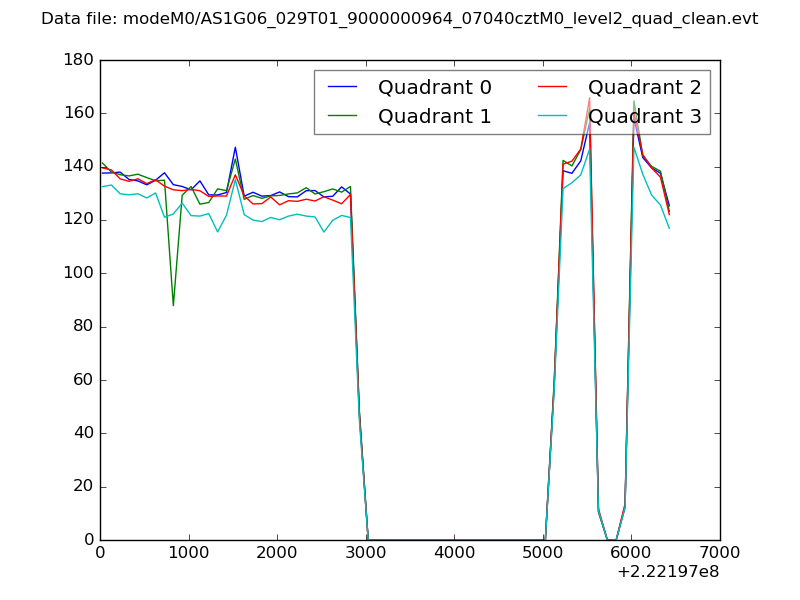 |
|
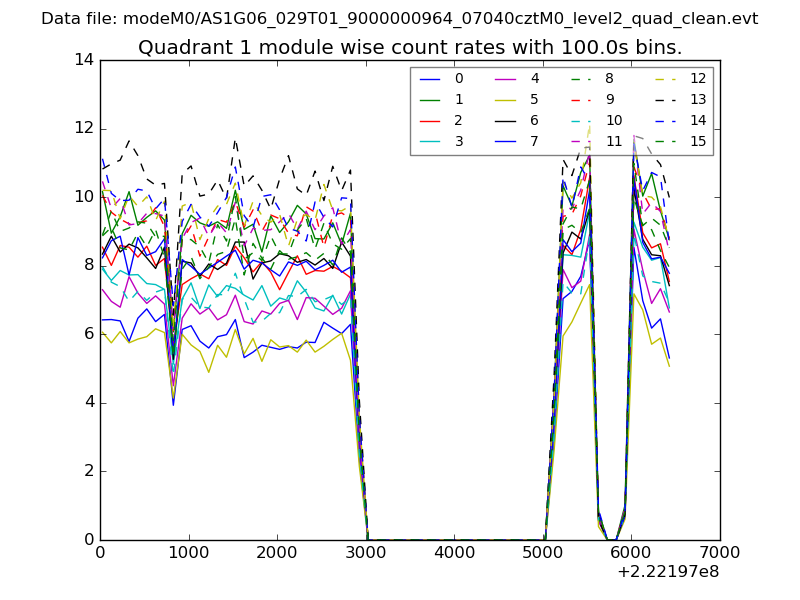
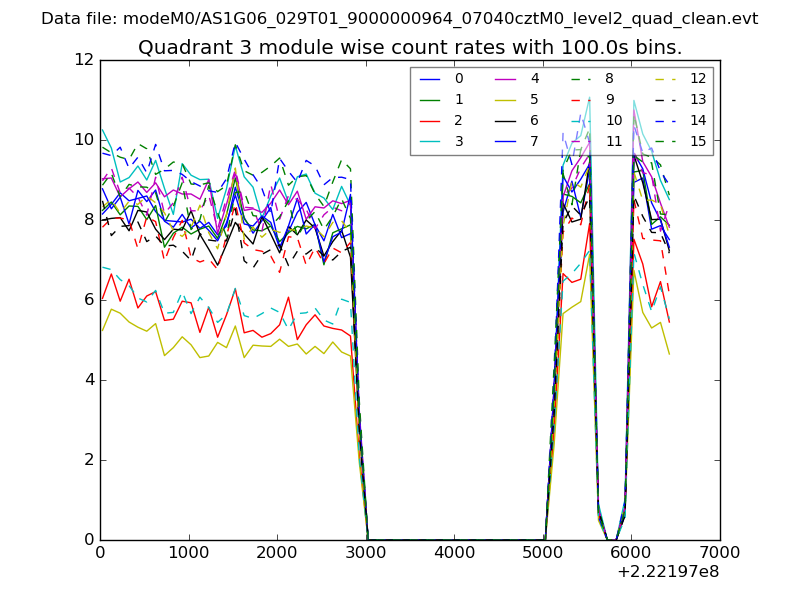
| Module-wise count rates for Quadrant A Data is divided into 100 sec bins |
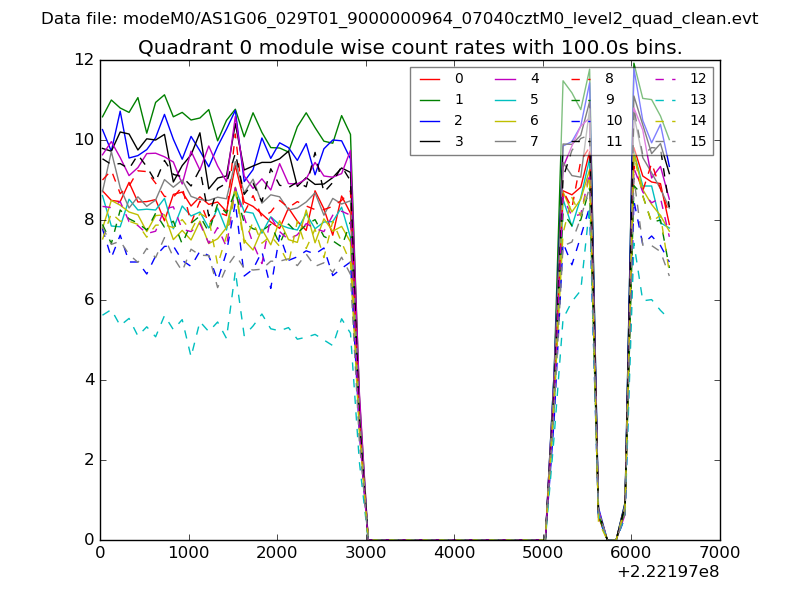 |
 |
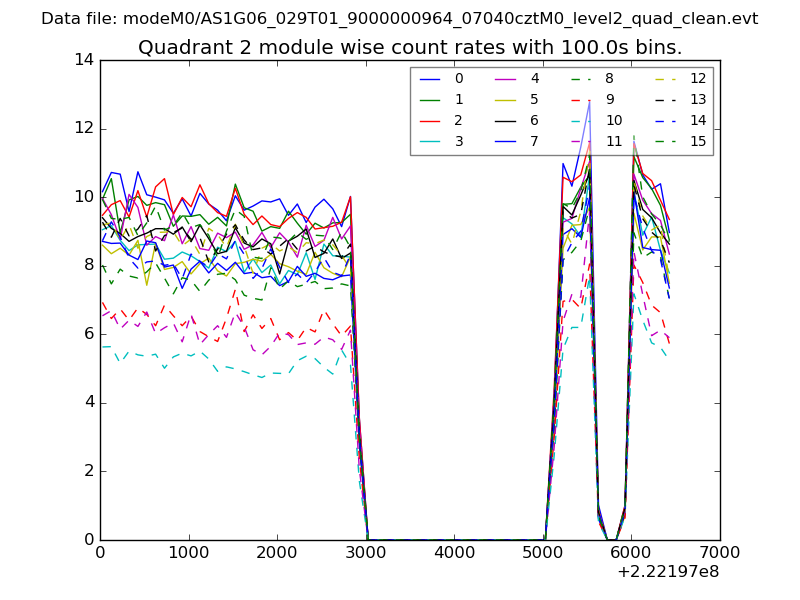
| Module-wise count rates for Quadrant B Data is divided into 100 sec bins |
 |
 |
| Module-wise count rates for Quadrant C Data is divided into 100 sec bins |
 |
 |
| Module-wise count rates for Quadrant D Data is divided into 100 sec bins |
 |
 |
| Parameter | Plot |
|---|---|
| CZT HV Monitor | 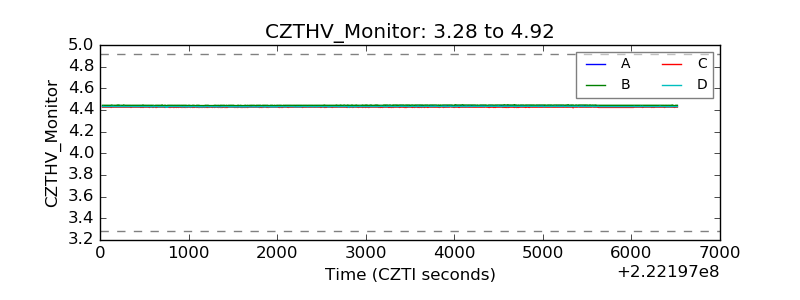 |
| D_VDD | 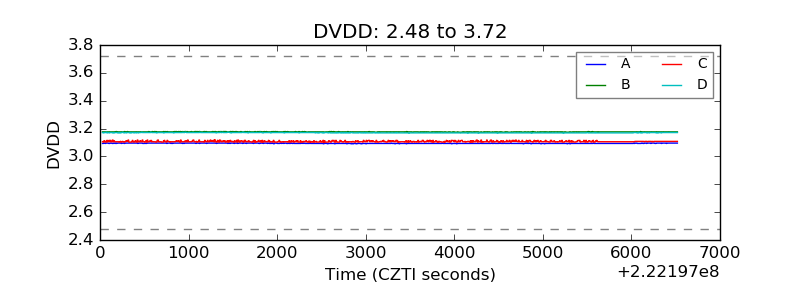 |
| Temperature 1 | 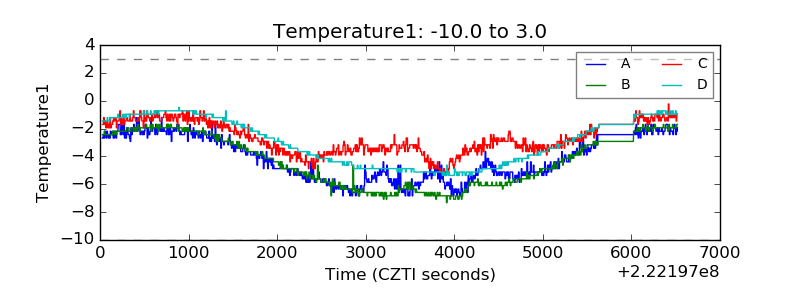 |
| Veto HV Monitor | 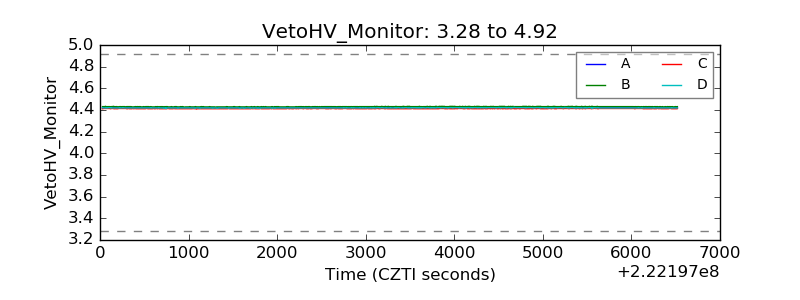 |
| Veto LLD | 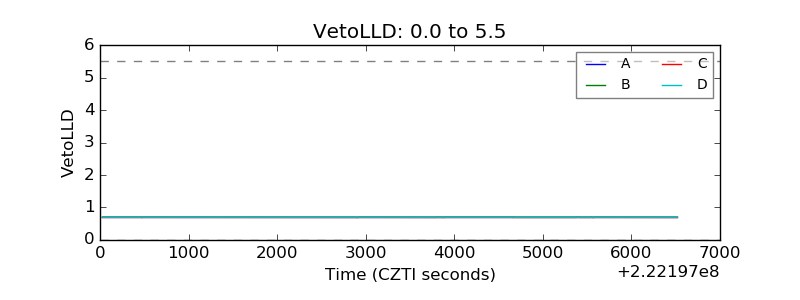 |
| Alpha Counter | 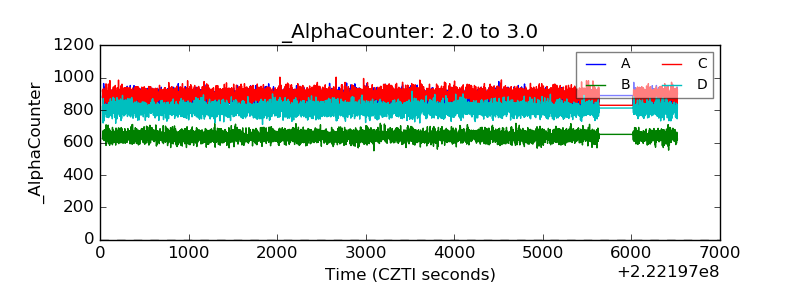 |
| _CPM_Rate | 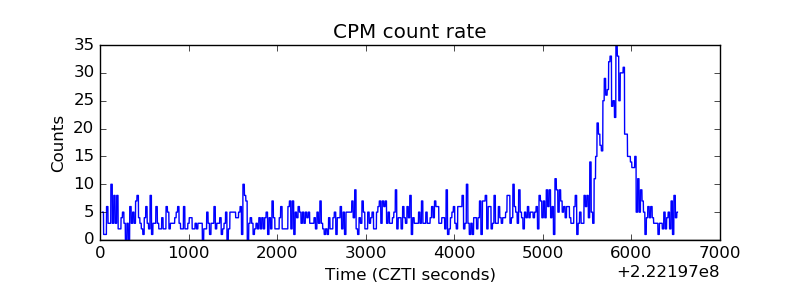 |
| CZT Counter | 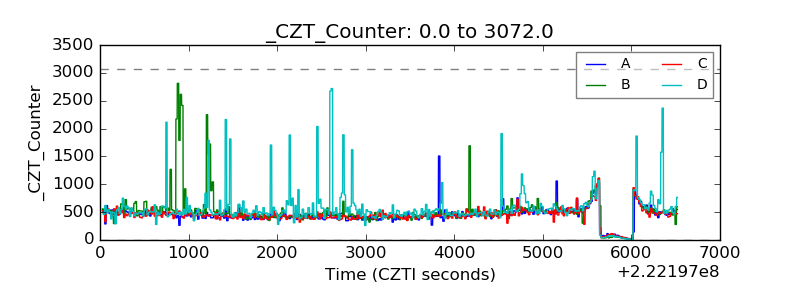 |
| +2.5 Volts monitor |  |
| +5 Volts monitor |  |
| _ROLL_ROT |  |
| _Roll_DEC |  |
| _Roll_RA | 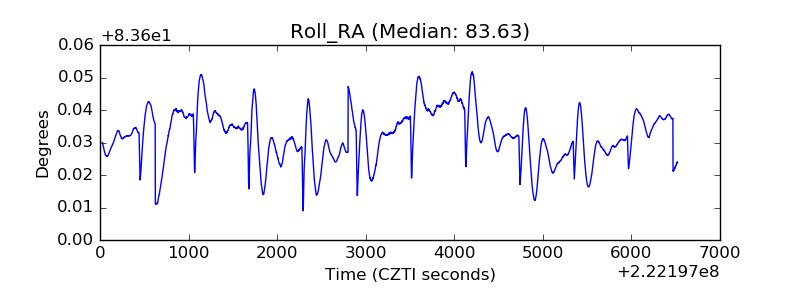 |
| Veto Counter | 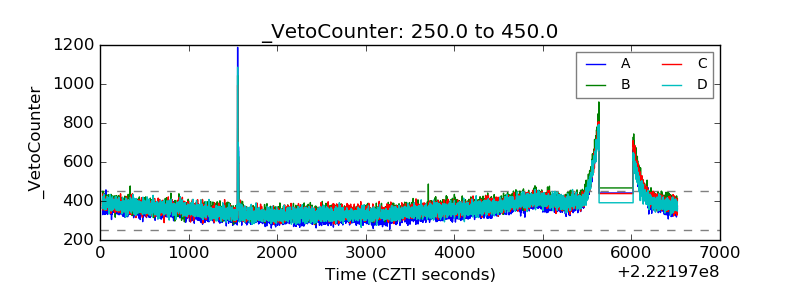 |