| Param | Original file | Final file |
|---|---|---|
| Filename | modeM0/AS1G06_029T01_9000000964_07046cztM0_level2.evt | modeM0/AS1G06_029T01_9000000964_07046cztM0_level2_quad_clean.evt |
| Size (bytes) | 464,771,520 | 78,626,880 |
| Size | 443.2 MB | 75.0 MB |
| Events in quadrant A | 3,100,659 | 488,727 |
| Events in quadrant B | 3,724,346 | 492,906 |
| Events in quadrant C | 3,285,630 | 481,966 |
| Events in quadrant D | 3,516,741 | 457,053 |
| Mode M0 | |||
|---|---|---|---|
| Quadrant | BADHDUFLAG | Total packets | Discarded packets |
| A | 0 | 13483 | 2 |
| B | 0 | 15401 | 1 |
| C | 0 | 14008 | 1 |
| D | 0 | 14545 | 1 |
| Mode M9 | |||
|---|---|---|---|
| Quadrant | BADHDUFLAG | Total packets | Discarded packets |
| A | 0 | 12 | 0 |
| B | 0 | 12 | 0 |
| C | 0 | 12 | 0 |
| D | 0 | 12 | 0 |
| Mode SS | |||
|---|---|---|---|
| Quadrant | BADHDUFLAG | Total packets | Discarded packets |
| A | 0 | 134 | 0 |
| B | 0 | 134 | 0 |
| C | 0 | 134 | 0 |
| D | 0 | 134 | 0 |
| Quadrant | Total seconds | Saturated seconds | Saturation percentage |
|---|---|---|---|
| A | 6601 | 23 | 0.348432% |
| B | 6601 | 109 | 1.651265% |
| C | 6601 | 47 | 0.712013% |
| D | 6601 | 40 | 0.605969% |
Noise dominated data is calculated using 1-second bins in cleaned event files. If a bin has >2000 counts, and if more than 50% of those come from <1% of pixels, then it is considered to be noise-dominated and hence unusable.
| Quadrant | # 1 sec bins | Bins with >0 counts | Bins with >2000 counts | High rate bins dominated by noise | Noise dominated (total time) | Noise dominated (detector-on time) | Marked lightcurve |
|---|---|---|---|---|---|---|---|
| A | 7756 | 6602 | 0 | 0 | 0.00% | 0.00% | 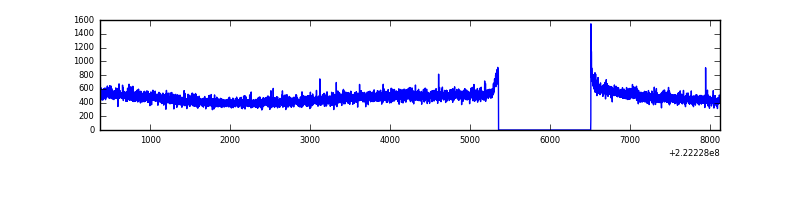 |
| B | 7756 | 6602 | 48 | 48 | 0.62% | 0.73% | 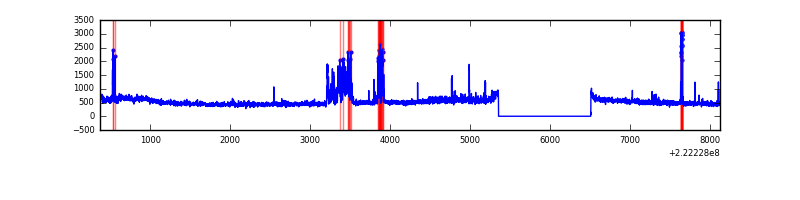 |
| C | 7756 | 6602 | 26 | 26 | 0.34% | 0.39% | 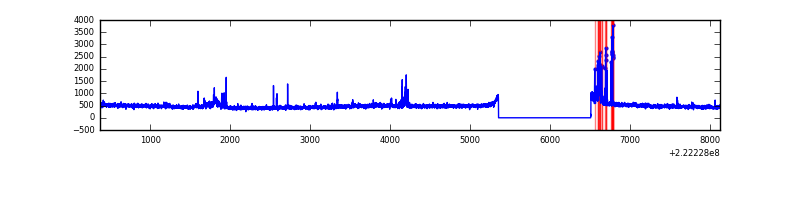 |
| D | 7756 | 6602 | 34 | 34 | 0.44% | 0.51% | 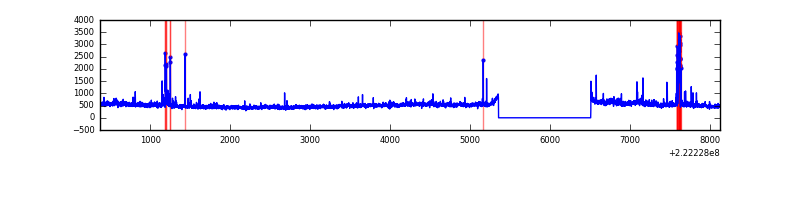 |
Top three noisy pixels from each quadrant. If the there are fewer than three noisy pixels in the level2.evt file, extra rows are filled as -1
| Pixel properties | Quadrant properties | ||||||
|---|---|---|---|---|---|---|---|
| Quadrant | DetID | PixID | Counts | Sigma | Mean | Median | Sigma |
| A | 8 | 15 | 9044 | 50.67 | 801 | 786 | 163.0 |
| A | 0 | 226 | 7539 | 41.43 | 801 | 786 | 163.0 |
| A | 13 | 14 | 7450 | 40.89 | 801 | 786 | 163.0 |
| B | 3 | 220 | 294381 | 1925.2 | 809 | 794 | 152.5 |
| B | 7 | 202 | 128569 | 837.89 | 809 | 794 | 152.5 |
| B | 0 | 214 | 98906 | 643.37 | 809 | 794 | 152.5 |
| C | 9 | 68 | 231126 | 1268.77 | 780 | 788 | 181.5 |
| C | 13 | 61 | 6002 | 28.72 | 780 | 788 | 181.5 |
| C | 1 | 16 | 5501 | 25.96 | 780 | 788 | 181.5 |
| D | 8 | 195 | 442660 | 2323.6 | 771 | 749 | 190.2 |
| D | 12 | 233 | 130012 | 679.67 | 771 | 749 | 190.2 |
| D | 2 | 14 | 37214 | 191.73 | 771 | 749 | 190.2 |
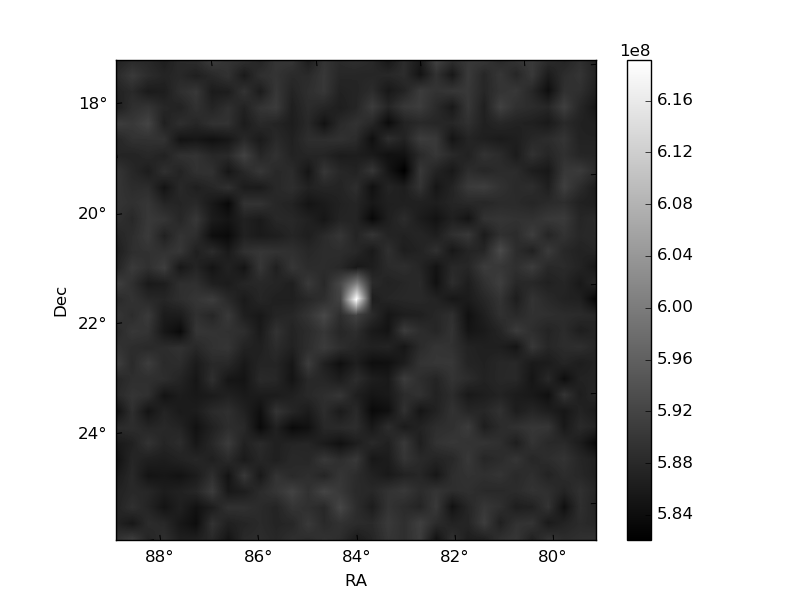
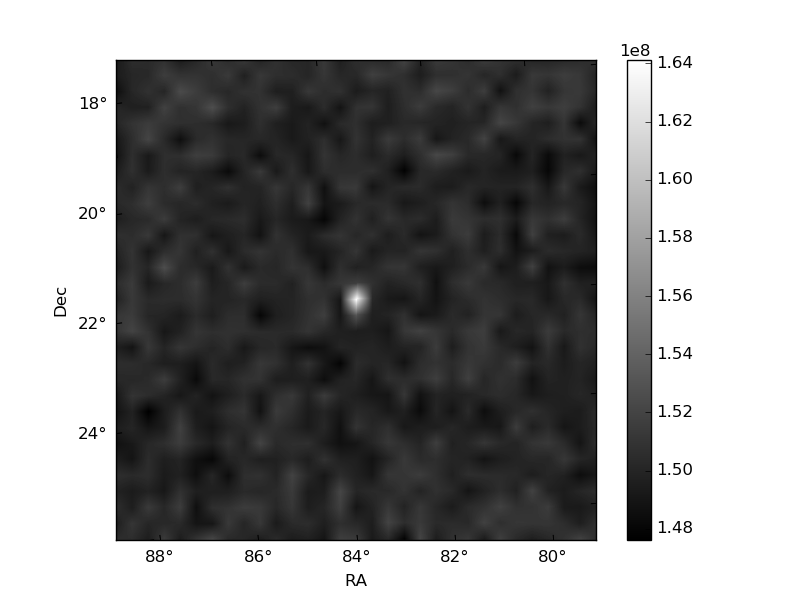
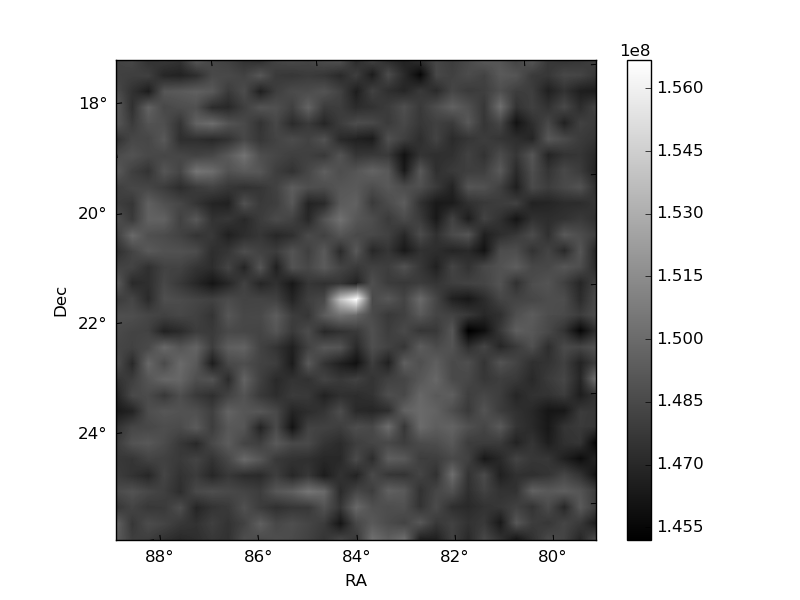
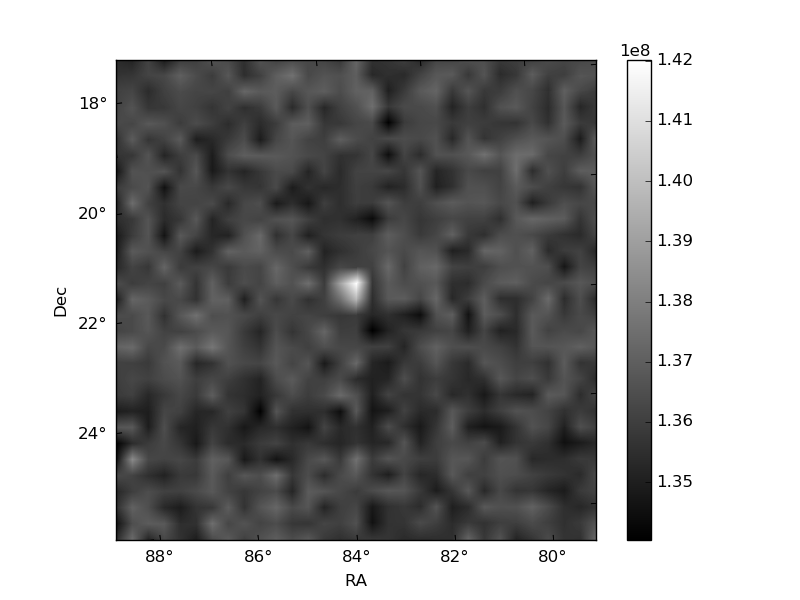
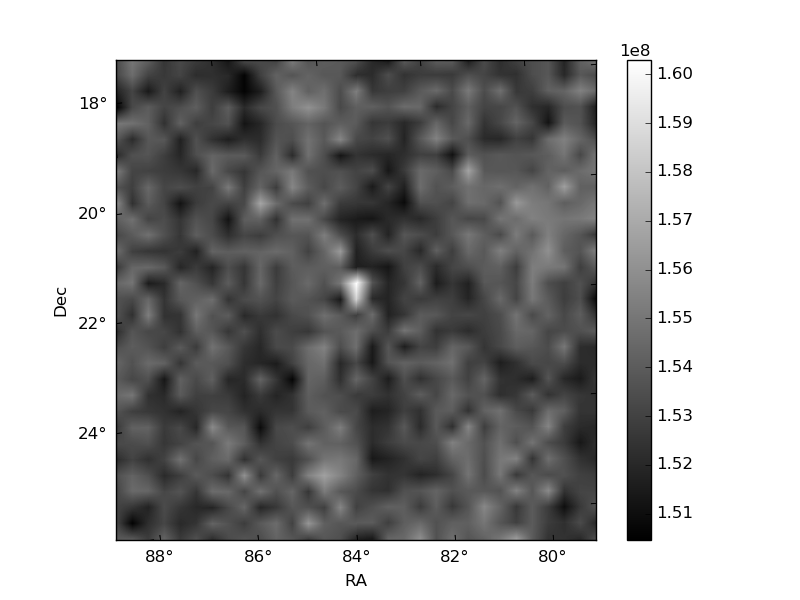
Histogram calculated using DETX and DETY for each event in the final _common_clean file
| Quadrant A | 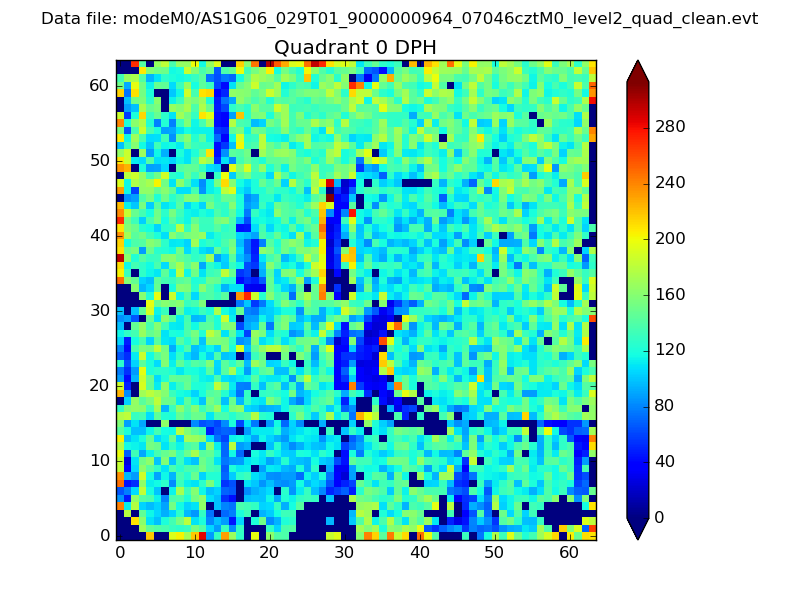 |
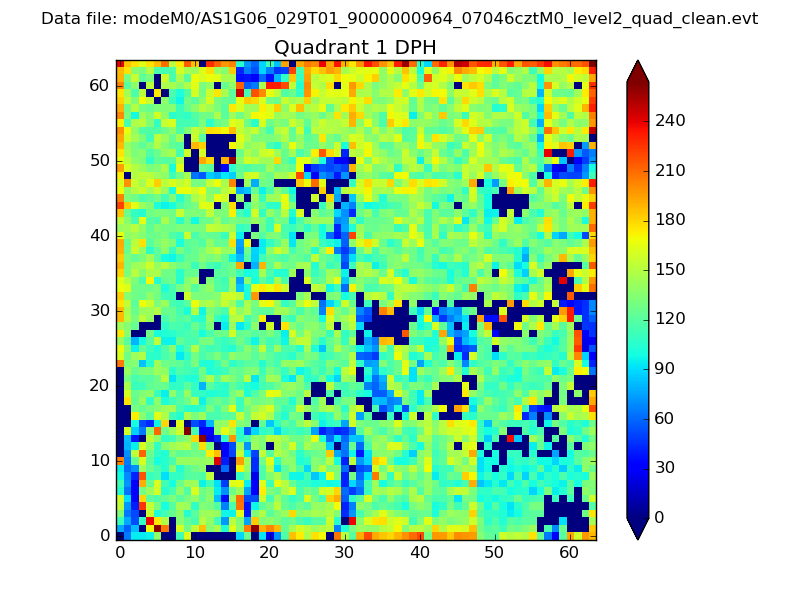 |
Quadrant B |
|---|---|---|---|
| Quadrant D | 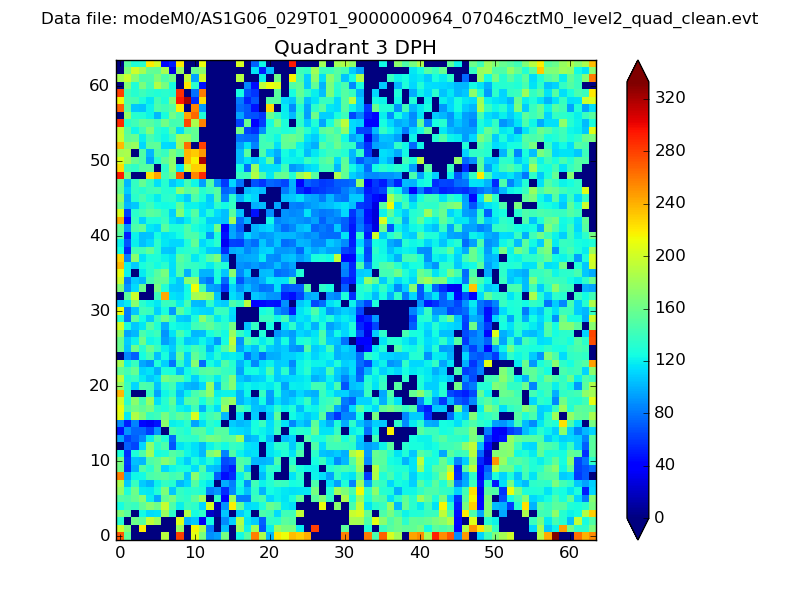 |
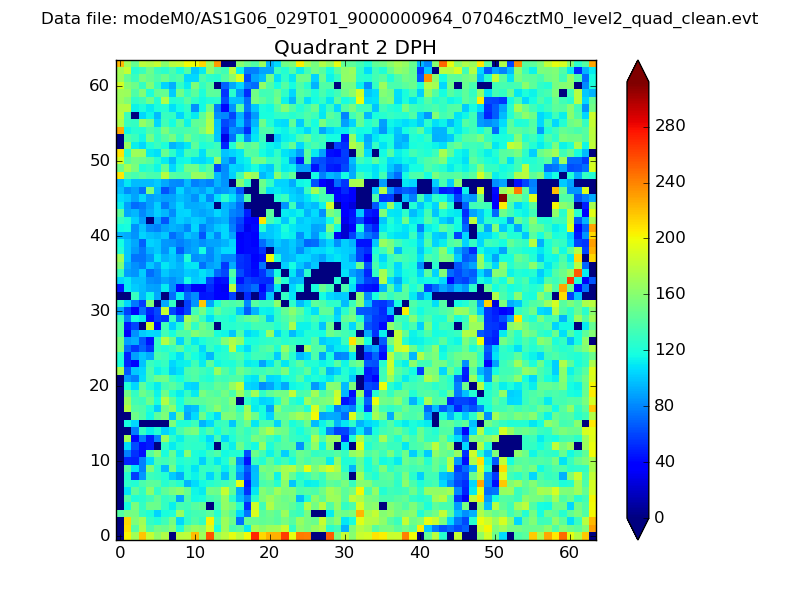 |
Quadrant C |
| Plot type | Count rate plots | Images |
|---|---|---|
| Comparison with Poisson distribution Blue bars denote a histogram of data divided into 1 sec bins. Red curve is a Poisson curve with rate = median count rate of data. |
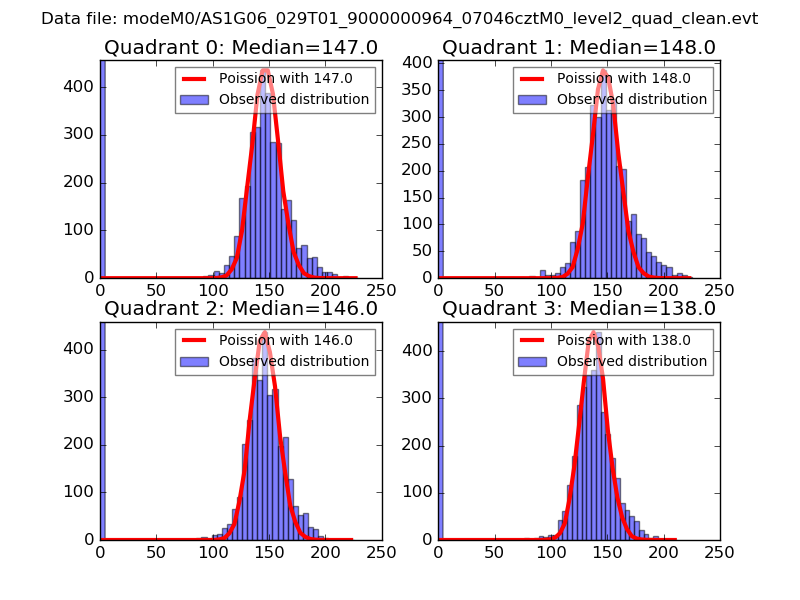 |
 |
| Quadrant-wise count rates Data is divided into 100 sec bins |
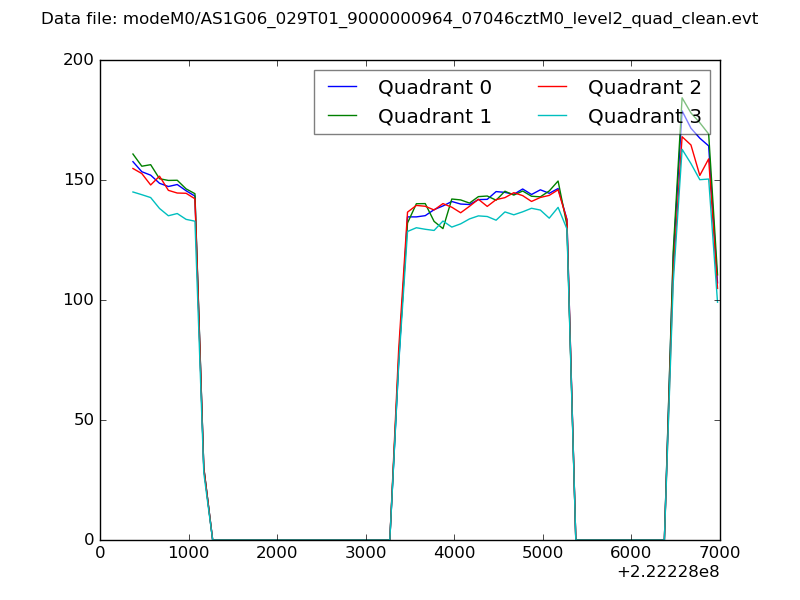 |
|
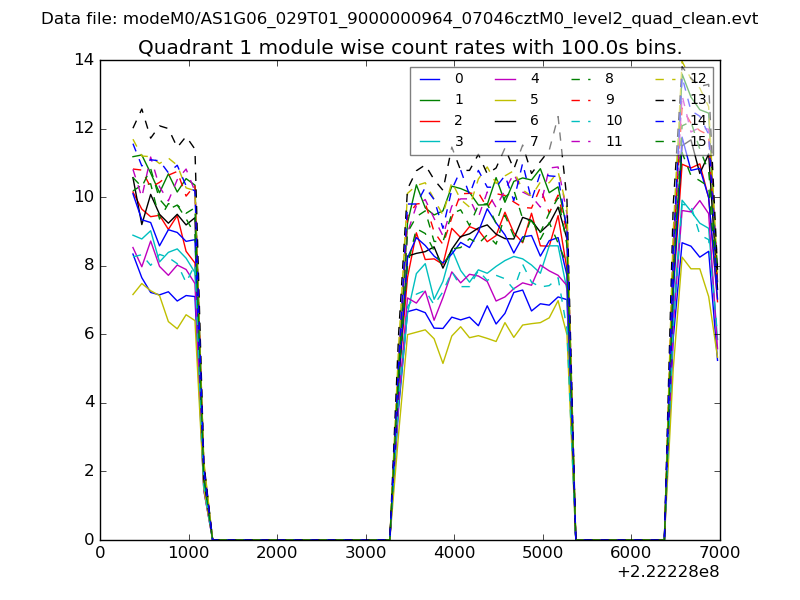
| Module-wise count rates for Quadrant A Data is divided into 100 sec bins |
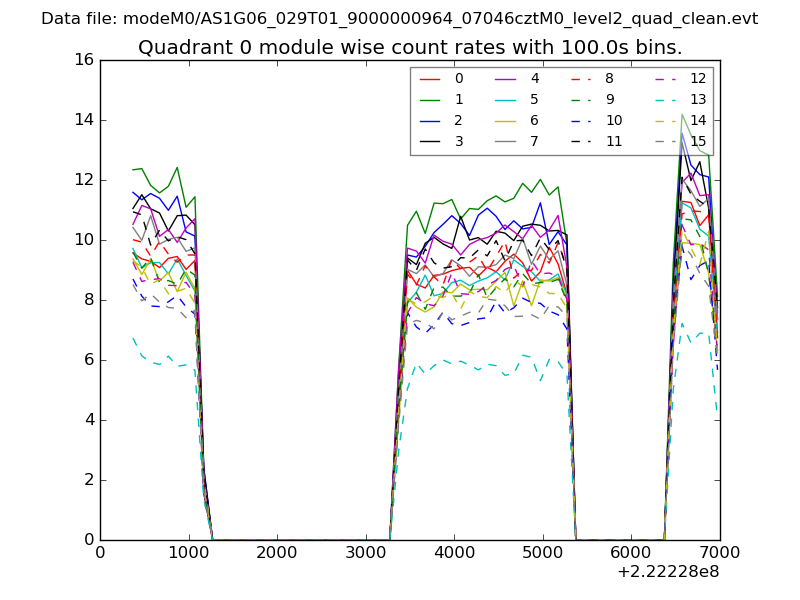 |
 |
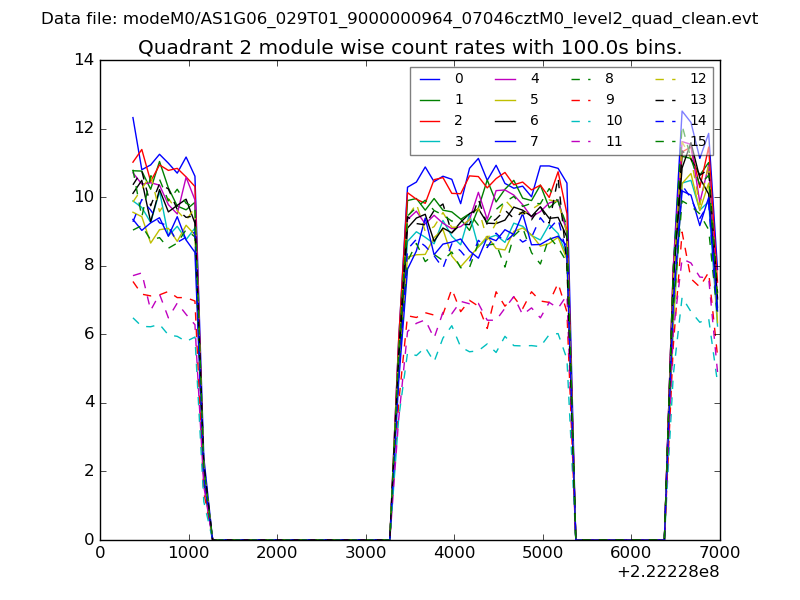
| Module-wise count rates for Quadrant B Data is divided into 100 sec bins |
 |
 |
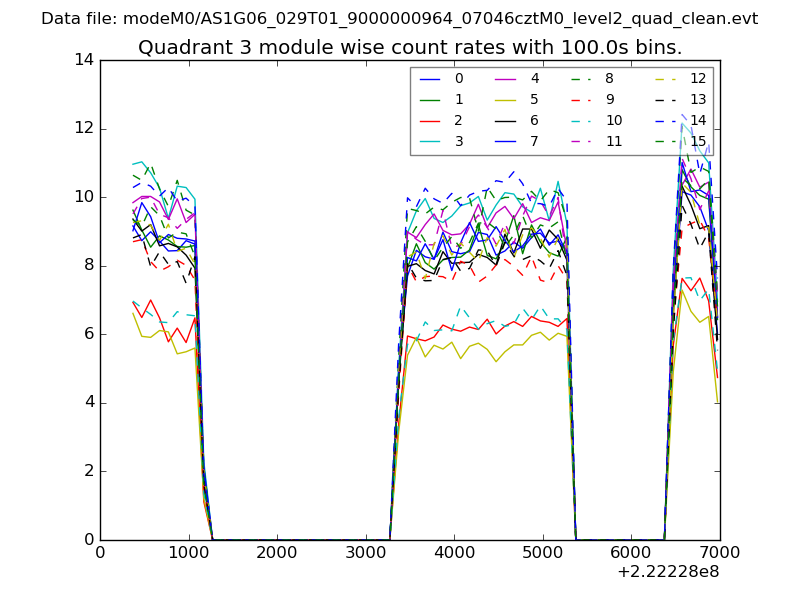
| Module-wise count rates for Quadrant C Data is divided into 100 sec bins |
 |
 |
| Module-wise count rates for Quadrant D Data is divided into 100 sec bins |
 |
 |
| Parameter | Plot |
|---|---|
| CZT HV Monitor | 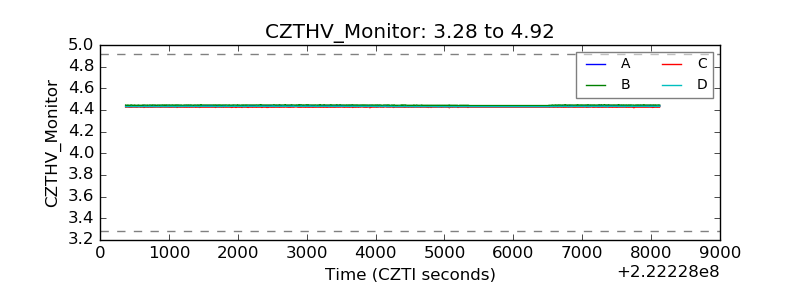 |
| D_VDD | 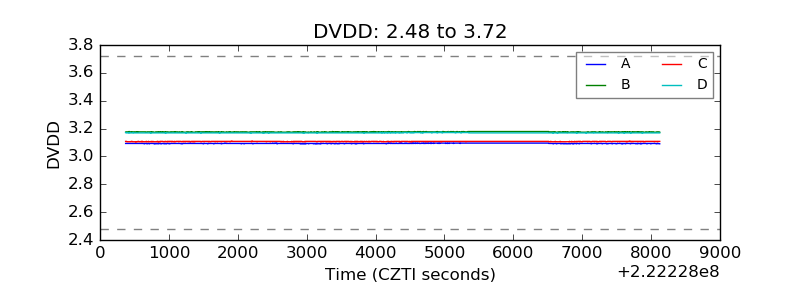 |
| Temperature 1 | 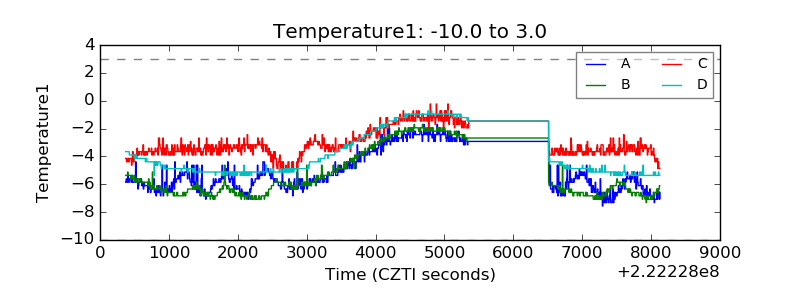 |
| Veto HV Monitor | 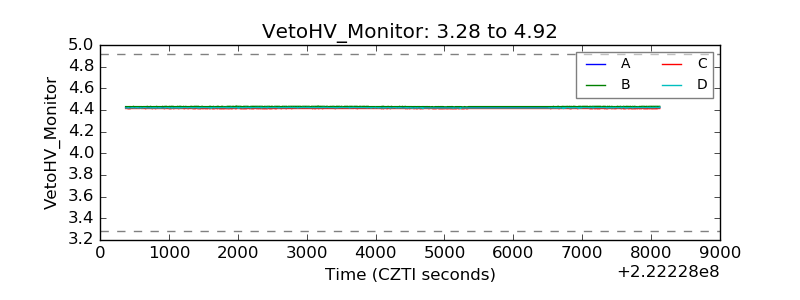 |
| Veto LLD | 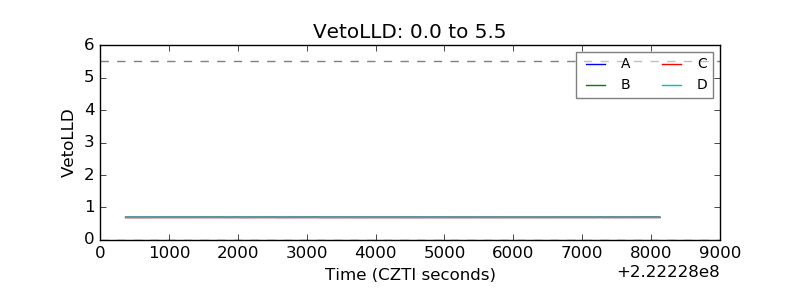 |
| Alpha Counter | 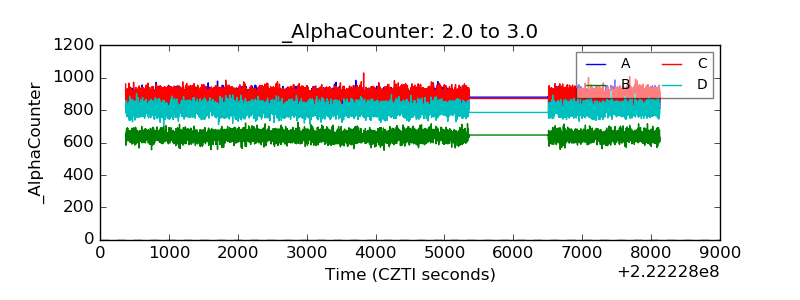 |
| _CPM_Rate | 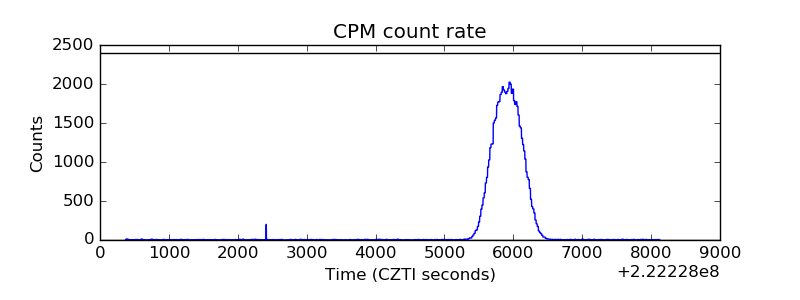 |
| CZT Counter | 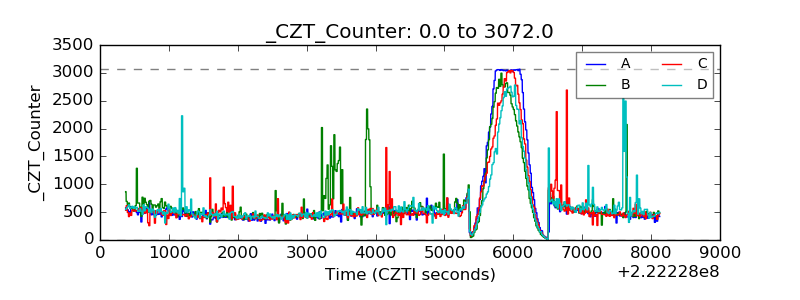 |
| +2.5 Volts monitor |  |
| +5 Volts monitor |  |
| _ROLL_ROT | 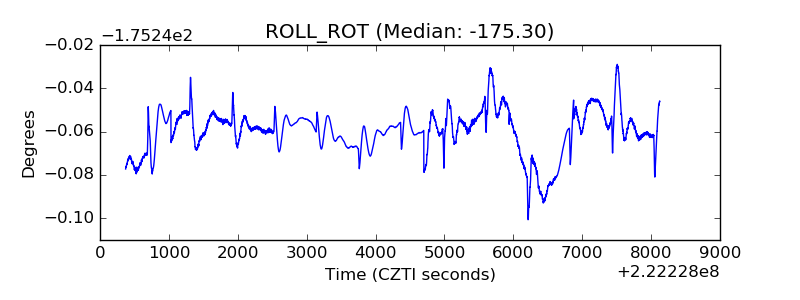 |
| _Roll_DEC | 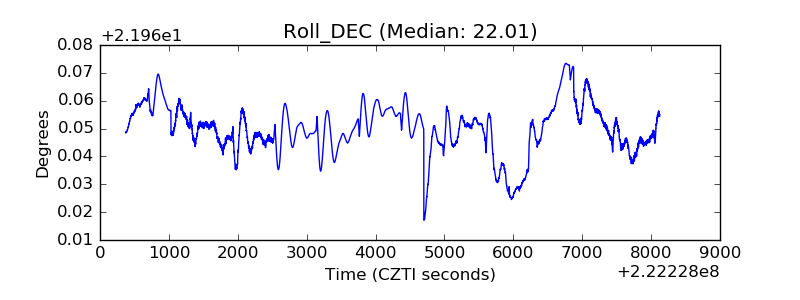 |
| _Roll_RA | 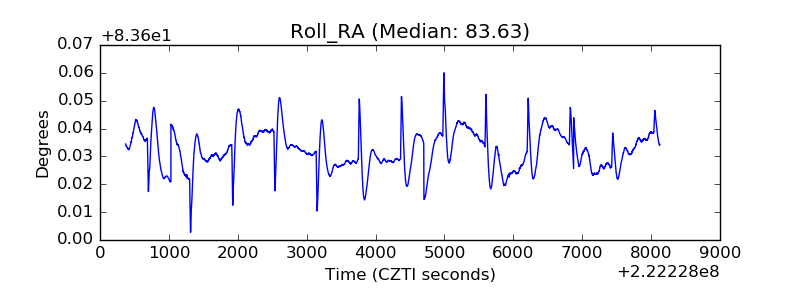 |
| Veto Counter | 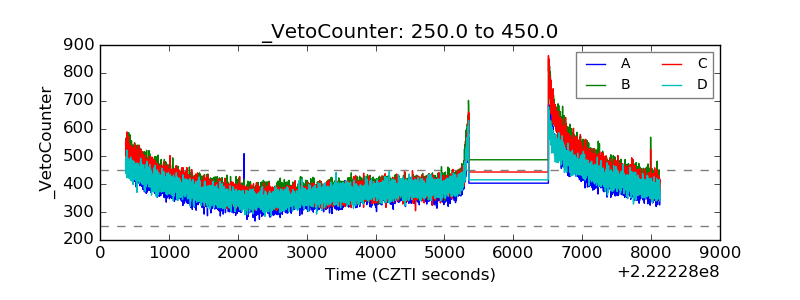 |