| Param | Original file | Final file |
|---|---|---|
| Filename | modeM0/AS1G06_029T01_9000000964_07047cztM0_level2.evt | modeM0/AS1G06_029T01_9000000964_07047cztM0_level2_quad_clean.evt |
| Size (bytes) | 479,033,280 | 72,253,440 |
| Size | 456.8 MB | 68.9 MB |
| Events in quadrant A | 3,230,746 | 440,105 |
| Events in quadrant B | 3,746,093 | 447,666 |
| Events in quadrant C | 3,373,444 | 432,325 |
| Events in quadrant D | 3,713,070 | 411,313 |
| Mode M0 | |||
|---|---|---|---|
| Quadrant | BADHDUFLAG | Total packets | Discarded packets |
| A | 0 | 13600 | 3 |
| B | 0 | 15282 | 2 |
| C | 0 | 14152 | 2 |
| D | 0 | 15136 | 2 |
| Mode M9 | |||
|---|---|---|---|
| Quadrant | BADHDUFLAG | Total packets | Discarded packets |
| A | 0 | 16 | 0 |
| B | 0 | 16 | 0 |
| C | 0 | 16 | 0 |
| D | 0 | 17 | 0 |
| Mode SS | |||
|---|---|---|---|
| Quadrant | BADHDUFLAG | Total packets | Discarded packets |
| A | 0 | 134 | 0 |
| B | 0 | 134 | 0 |
| C | 0 | 134 | 0 |
| D | 0 | 134 | 0 |
| Quadrant | Total seconds | Saturated seconds | Saturation percentage |
|---|---|---|---|
| A | 6541 | 30 | 0.458645% |
| B | 6541 | 70 | 1.070173% |
| C | 6541 | 90 | 1.375936% |
| D | 6541 | 54 | 0.825562% |
Noise dominated data is calculated using 1-second bins in cleaned event files. If a bin has >2000 counts, and if more than 50% of those come from <1% of pixels, then it is considered to be noise-dominated and hence unusable.
| Quadrant | # 1 sec bins | Bins with >0 counts | Bins with >2000 counts | High rate bins dominated by noise | Noise dominated (total time) | Noise dominated (detector-on time) | Marked lightcurve |
|---|---|---|---|---|---|---|---|
| A | 7786 | 6542 | 0 | 0 | 0.00% | 0.00% | 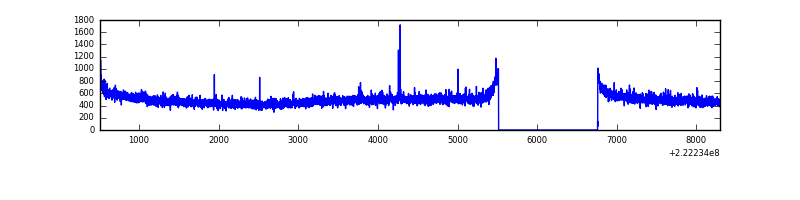 |
| B | 7786 | 6542 | 26 | 26 | 0.33% | 0.40% | 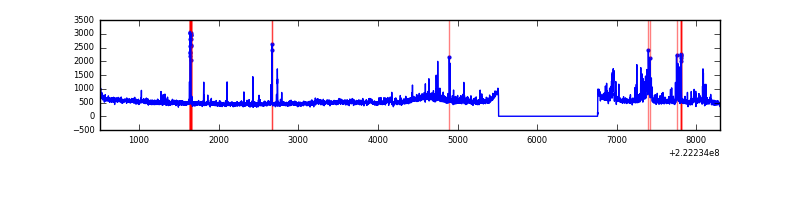 |
| C | 7786 | 6542 | 51 | 51 | 0.66% | 0.78% | 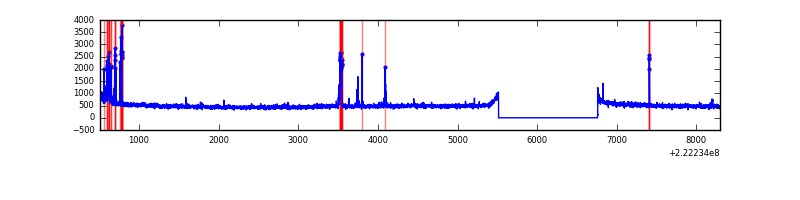 |
| D | 7786 | 6542 | 31 | 31 | 0.40% | 0.47% | 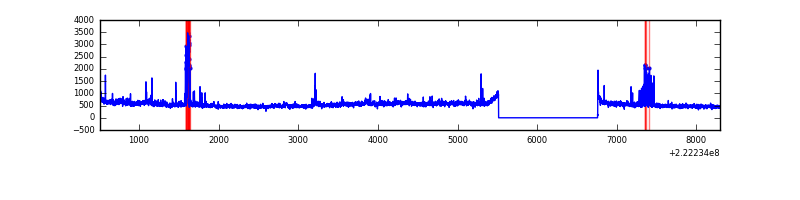 |
Top three noisy pixels from each quadrant. If the there are fewer than three noisy pixels in the level2.evt file, extra rows are filled as -1
| Pixel properties | Quadrant properties | ||||||
|---|---|---|---|---|---|---|---|
| Quadrant | DetID | PixID | Counts | Sigma | Mean | Median | Sigma |
| A | 13 | 251 | 16310 | 92.43 | 828 | 812 | 167.7 |
| A | 13 | 14 | 15722 | 88.93 | 828 | 812 | 167.7 |
| A | 0 | 226 | 7880 | 42.16 | 828 | 812 | 167.7 |
| B | 3 | 220 | 203056 | 1288.36 | 837 | 820 | 157.0 |
| B | 7 | 202 | 111773 | 706.83 | 837 | 820 | 157.0 |
| B | 0 | 214 | 72081 | 453.97 | 837 | 820 | 157.0 |
| C | 9 | 68 | 210773 | 1139.24 | 801 | 809 | 184.3 |
| C | 10 | 22 | 17449 | 90.29 | 801 | 809 | 184.3 |
| C | 1 | 16 | 11335 | 57.11 | 801 | 809 | 184.3 |
| D | 8 | 195 | 521544 | 2665.6 | 792 | 769 | 195.4 |
| D | 12 | 233 | 99807 | 506.93 | 792 | 769 | 195.4 |
| D | 2 | 14 | 85810 | 435.29 | 792 | 769 | 195.4 |
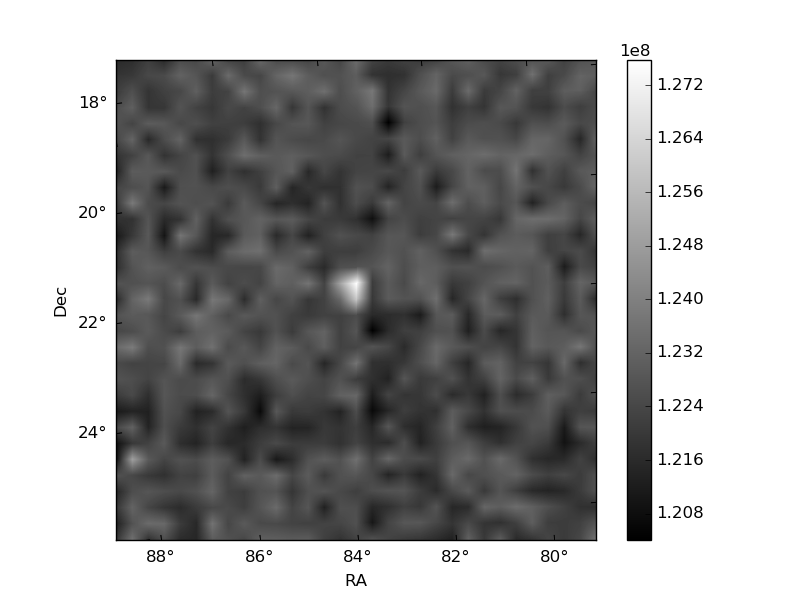
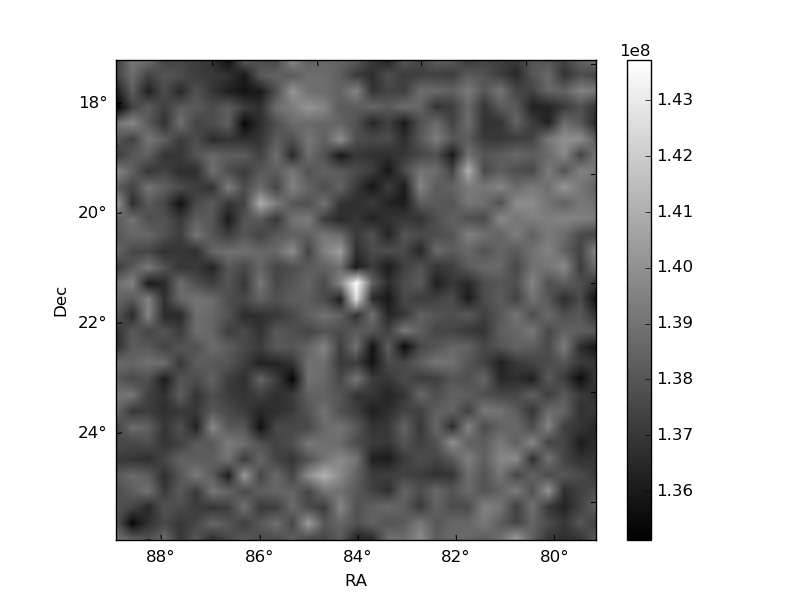
Histogram calculated using DETX and DETY for each event in the final _common_clean file
| Quadrant A | 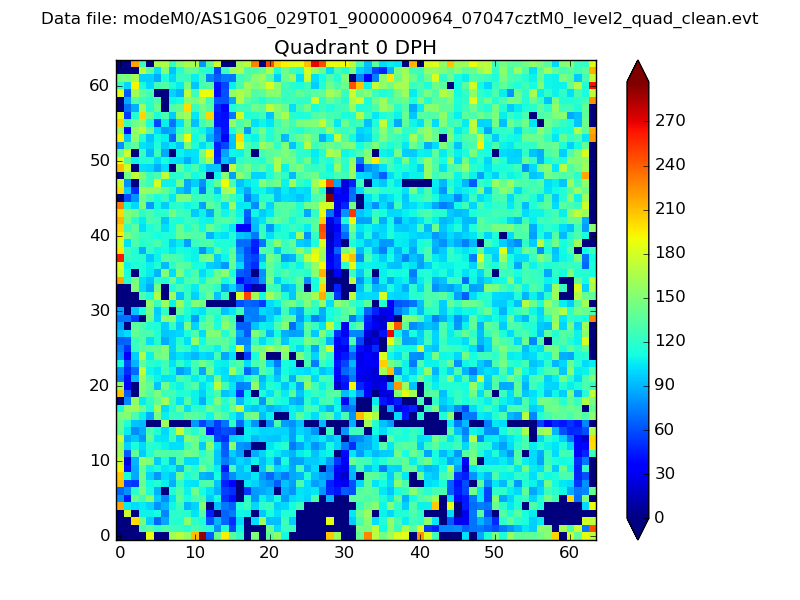 |
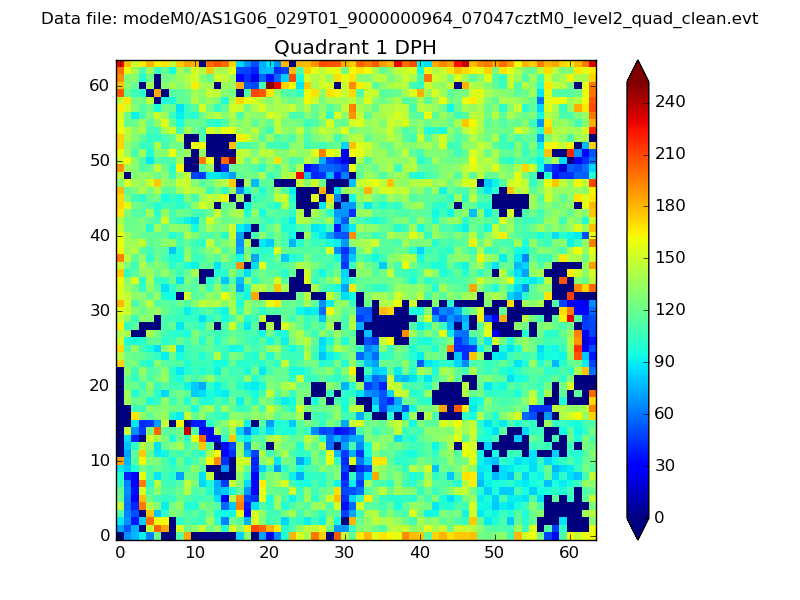 |
Quadrant B |
|---|---|---|---|
| Quadrant D | 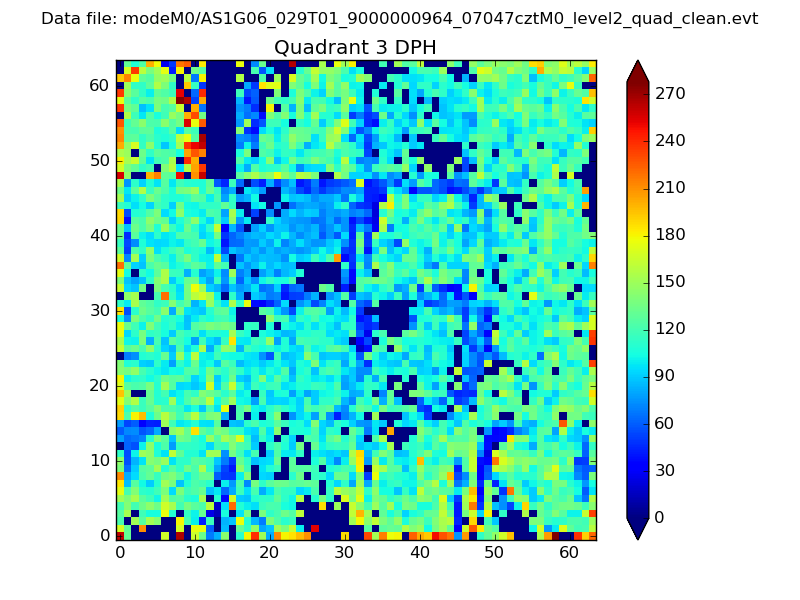 |
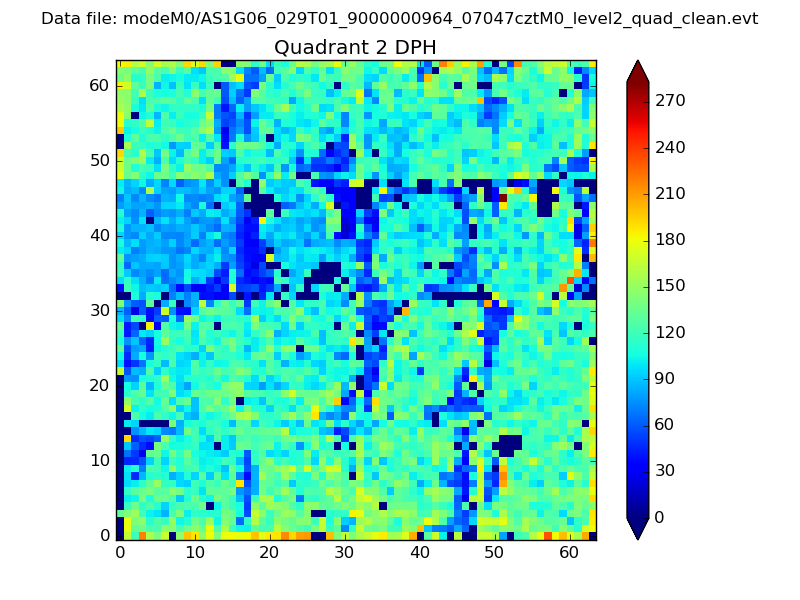 |
Quadrant C |
| Plot type | Count rate plots | Images |
|---|---|---|
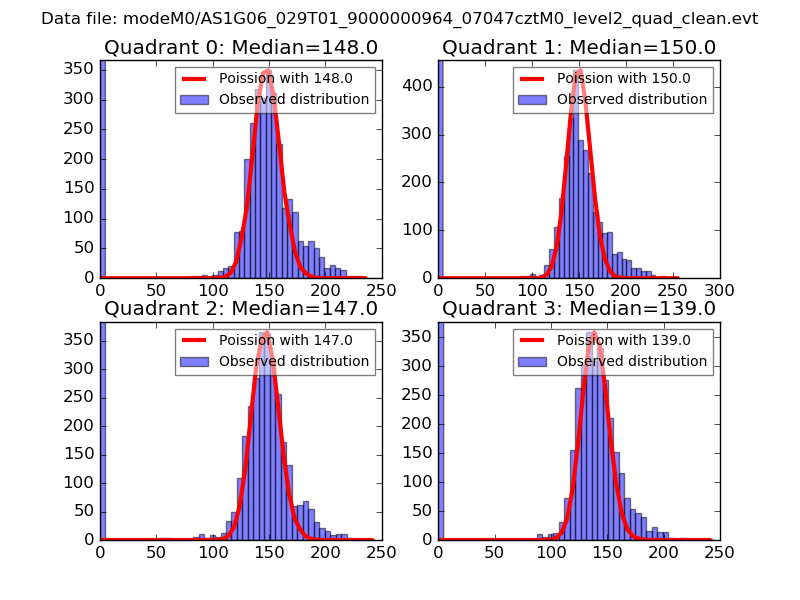
| Comparison with Poisson distribution Blue bars denote a histogram of data divided into 1 sec bins. Red curve is a Poisson curve with rate = median count rate of data. |
 |
 |
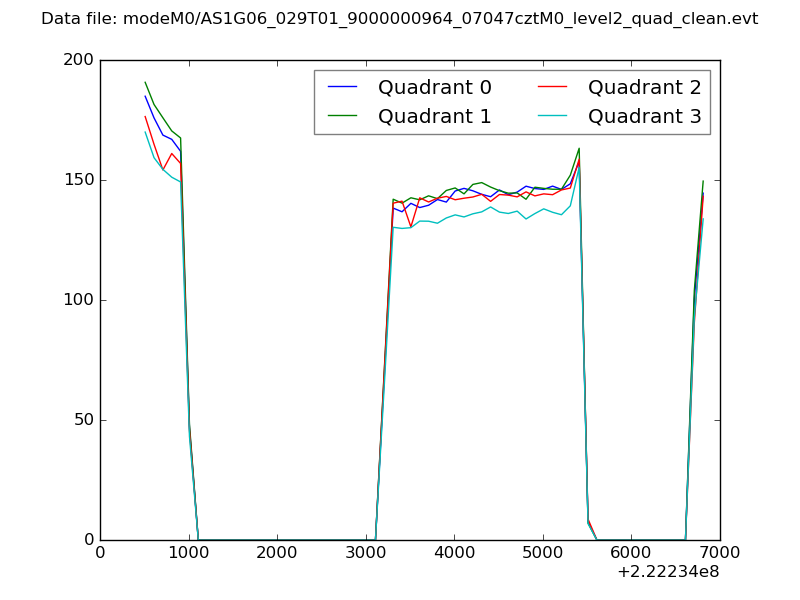
| Quadrant-wise count rates Data is divided into 100 sec bins |
 |
|
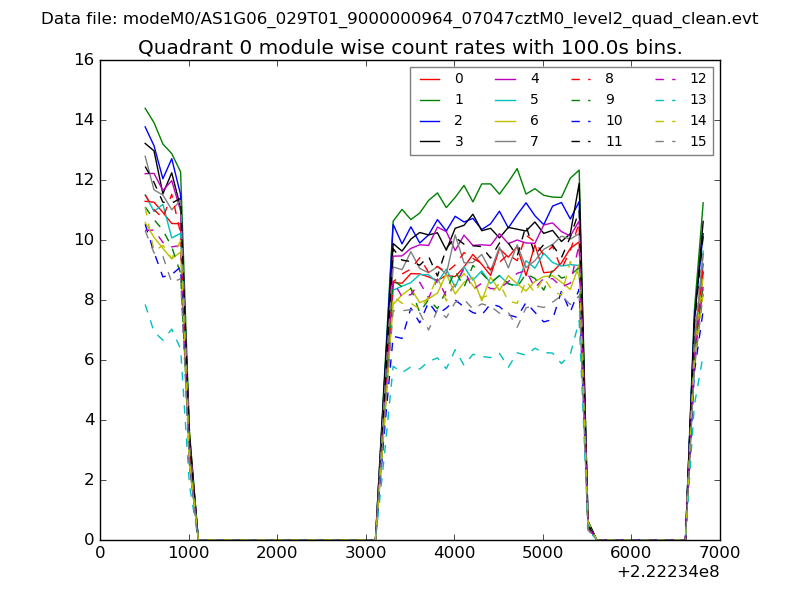
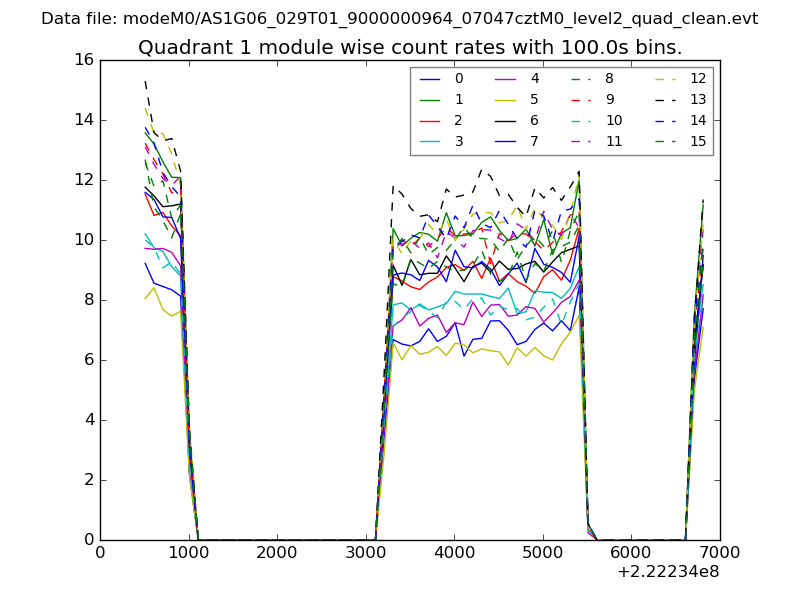
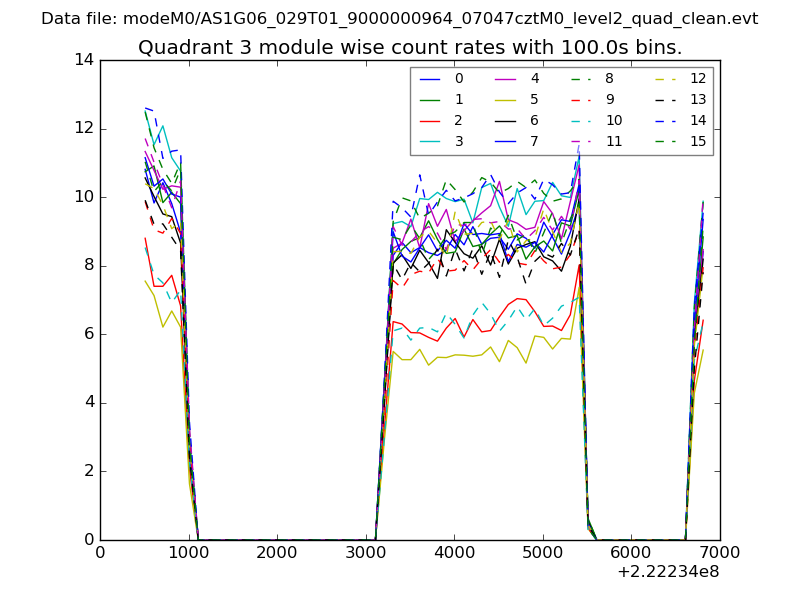
| Module-wise count rates for Quadrant A Data is divided into 100 sec bins |
 |
 |
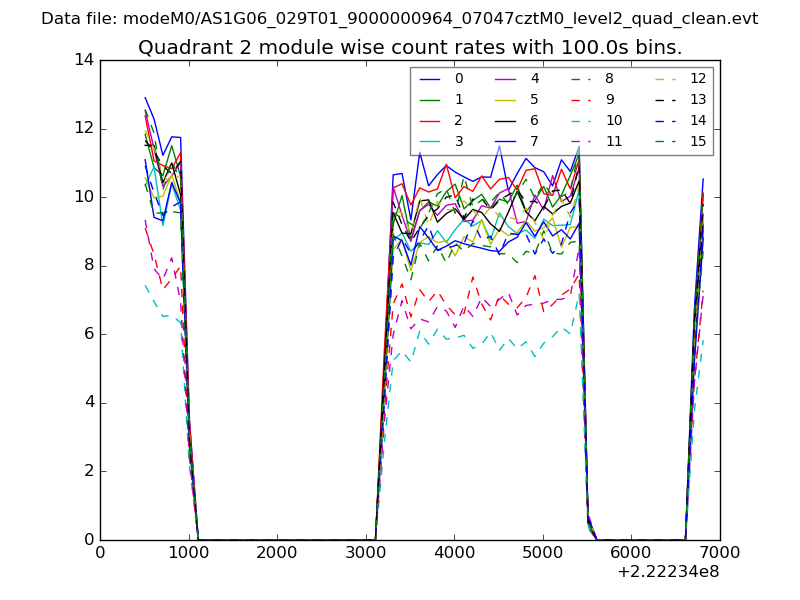
| Module-wise count rates for Quadrant B Data is divided into 100 sec bins |
 |
 |
| Module-wise count rates for Quadrant C Data is divided into 100 sec bins |
 |
 |
| Module-wise count rates for Quadrant D Data is divided into 100 sec bins |
 |
 |
| Parameter | Plot |
|---|---|
| CZT HV Monitor | 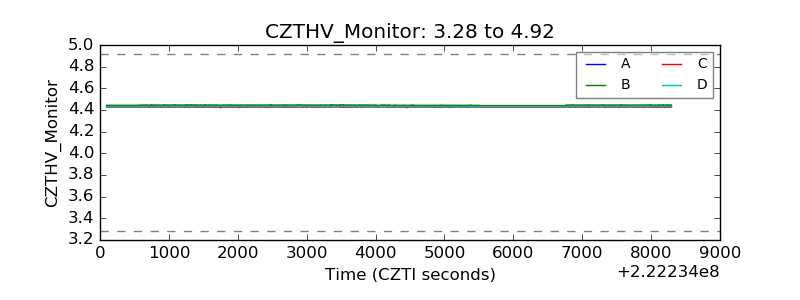 |
| D_VDD | 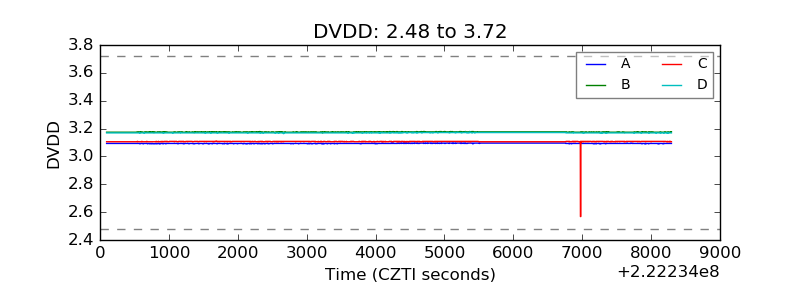 |
| Temperature 1 | 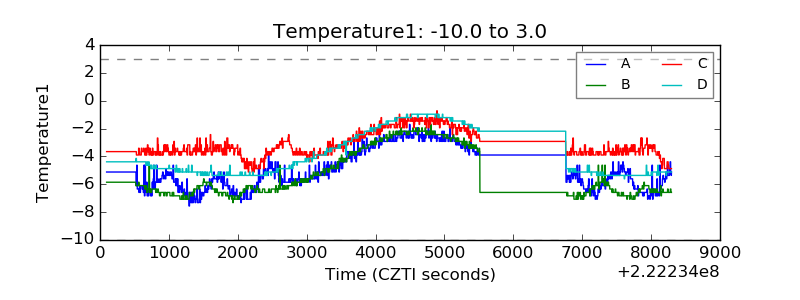 |
| Veto HV Monitor | 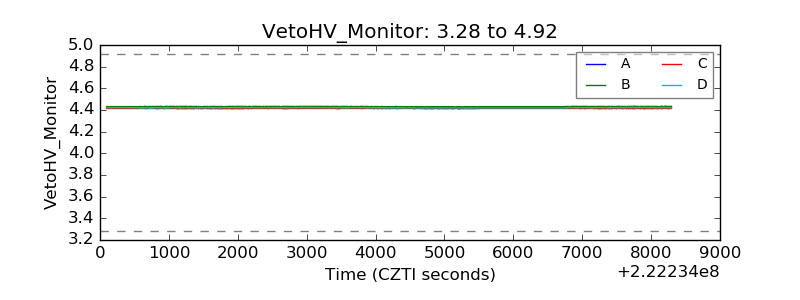 |
| Veto LLD | 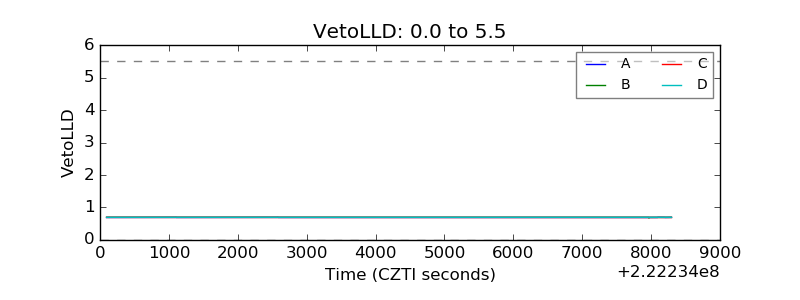 |
| Alpha Counter | 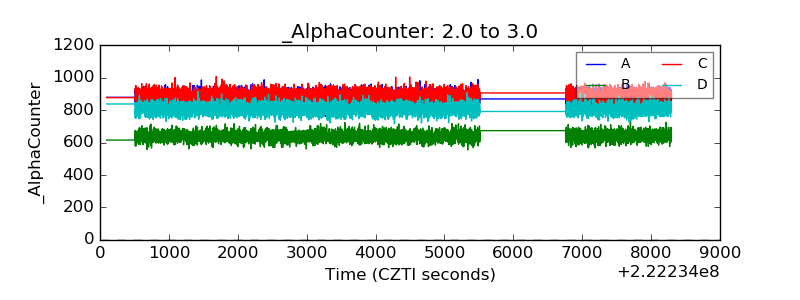 |
| _CPM_Rate | 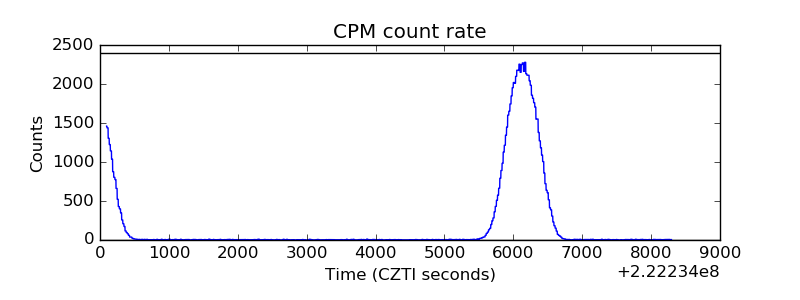 |
| CZT Counter | 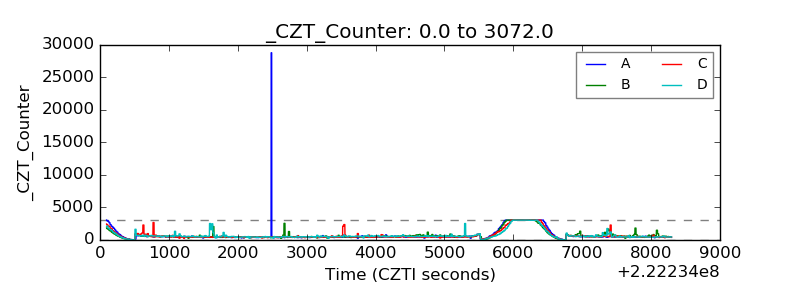 |
| +2.5 Volts monitor |  |
| +5 Volts monitor |  |
| _ROLL_ROT | 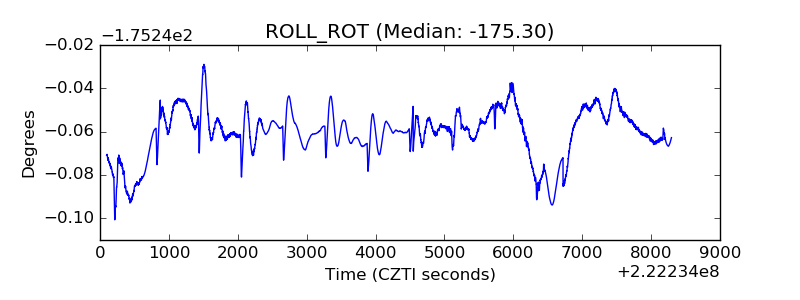 |
| _Roll_DEC | 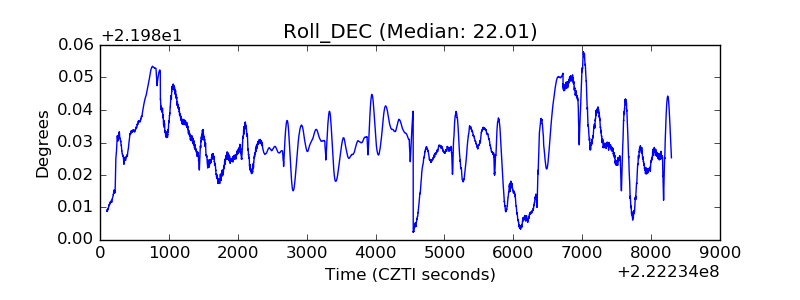 |
| _Roll_RA | 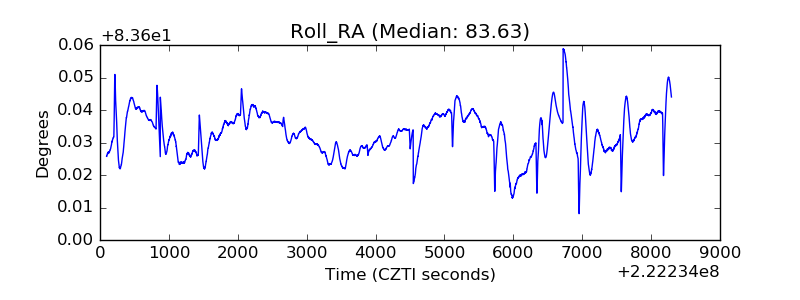 |
| Veto Counter | 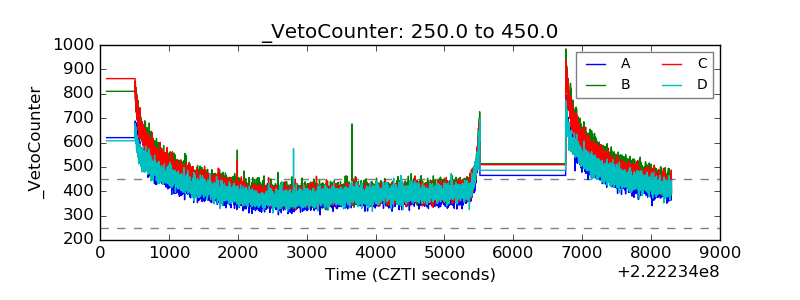 |