| Param | Original file | Final file |
|---|---|---|
| Filename | modeM0/AS1G06_029T01_9000000964_07049cztM0_level2.evt | modeM0/AS1G06_029T01_9000000964_07049cztM0_level2_quad_clean.evt |
| Size (bytes) | 460,929,600 | 72,218,880 |
| Size | 439.6 MB | 68.9 MB |
| Events in quadrant A | 3,298,486 | 441,332 |
| Events in quadrant B | 3,658,935 | 450,658 |
| Events in quadrant C | 3,121,320 | 439,866 |
| Events in quadrant D | 3,451,709 | 414,312 |
| Mode M0 | |||
|---|---|---|---|
| Quadrant | BADHDUFLAG | Total packets | Discarded packets |
| A | 0 | 13403 | 3 |
| B | 0 | 14535 | 2 |
| C | 0 | 13117 | 2 |
| D | 0 | 13817 | 2 |
| Mode M9 | |||
|---|---|---|---|
| Quadrant | BADHDUFLAG | Total packets | Discarded packets |
| A | 0 | 21 | 0 |
| B | 0 | 21 | 0 |
| C | 0 | 21 | 0 |
| D | 0 | 22 | 0 |
| Mode SS | |||
|---|---|---|---|
| Quadrant | BADHDUFLAG | Total packets | Discarded packets |
| A | 0 | 130 | 0 |
| B | 0 | 130 | 0 |
| C | 0 | 130 | 0 |
| D | 0 | 130 | 0 |
| Quadrant | Total seconds | Saturated seconds | Saturation percentage |
|---|---|---|---|
| A | 6306 | 78 | 1.236917% |
| B | 6306 | 137 | 2.172534% |
| C | 6306 | 63 | 0.999049% |
| D | 6306 | 69 | 1.094196% |
Noise dominated data is calculated using 1-second bins in cleaned event files. If a bin has >2000 counts, and if more than 50% of those come from <1% of pixels, then it is considered to be noise-dominated and hence unusable.
| Quadrant | # 1 sec bins | Bins with >0 counts | Bins with >2000 counts | High rate bins dominated by noise | Noise dominated (total time) | Noise dominated (detector-on time) | Marked lightcurve |
|---|---|---|---|---|---|---|---|
| A | 7606 | 6307 | 5 | 5 | 0.07% | 0.08% | 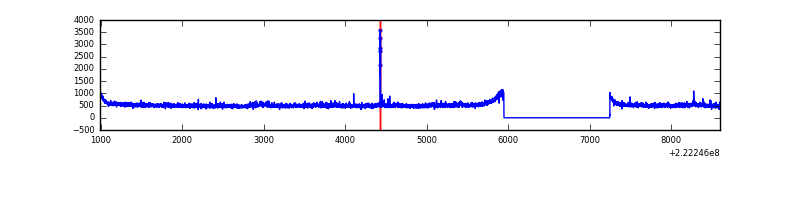 |
| B | 7606 | 6307 | 18 | 18 | 0.24% | 0.29% | 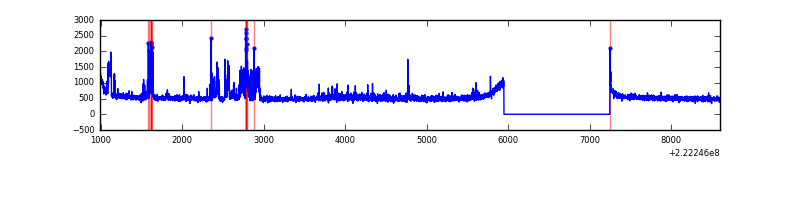 |
| C | 7606 | 6307 | 0 | 0 | 0.00% | 0.00% | 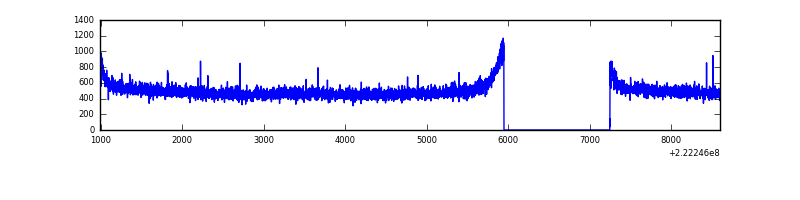 |
| D | 7606 | 6307 | 29 | 29 | 0.38% | 0.46% | 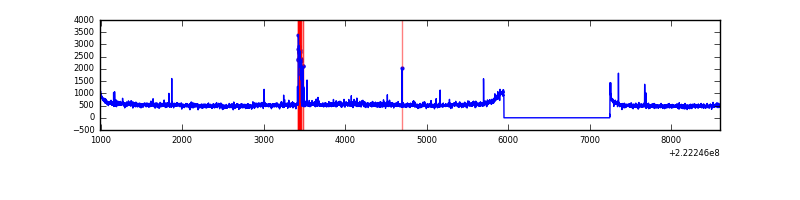 |
Top three noisy pixels from each quadrant. If the there are fewer than three noisy pixels in the level2.evt file, extra rows are filled as -1
| Pixel properties | Quadrant properties | ||||||
|---|---|---|---|---|---|---|---|
| Quadrant | DetID | PixID | Counts | Sigma | Mean | Median | Sigma |
| A | 13 | 251 | 89252 | 533.35 | 827 | 813 | 165.8 |
| A | 15 | 234 | 19143 | 110.54 | 827 | 813 | 165.8 |
| A | 0 | 226 | 7899 | 42.73 | 827 | 813 | 165.8 |
| B | 3 | 220 | 238223 | 1504.73 | 835 | 819 | 157.8 |
| B | 4 | 81 | 74384 | 466.27 | 835 | 819 | 157.8 |
| B | 0 | 214 | 68560 | 429.36 | 835 | 819 | 157.8 |
| C | 1 | 16 | 6813 | 32.63 | 796 | 805 | 184.1 |
| C | 13 | 61 | 6028 | 28.37 | 796 | 805 | 184.1 |
| C | 10 | 22 | 3879 | 16.69 | 796 | 805 | 184.1 |
| D | 8 | 195 | 347596 | 1784.83 | 792 | 770 | 194.3 |
| D | 2 | 33 | 73827 | 375.96 | 792 | 770 | 194.3 |
| D | 12 | 233 | 31424 | 157.75 | 792 | 770 | 194.3 |
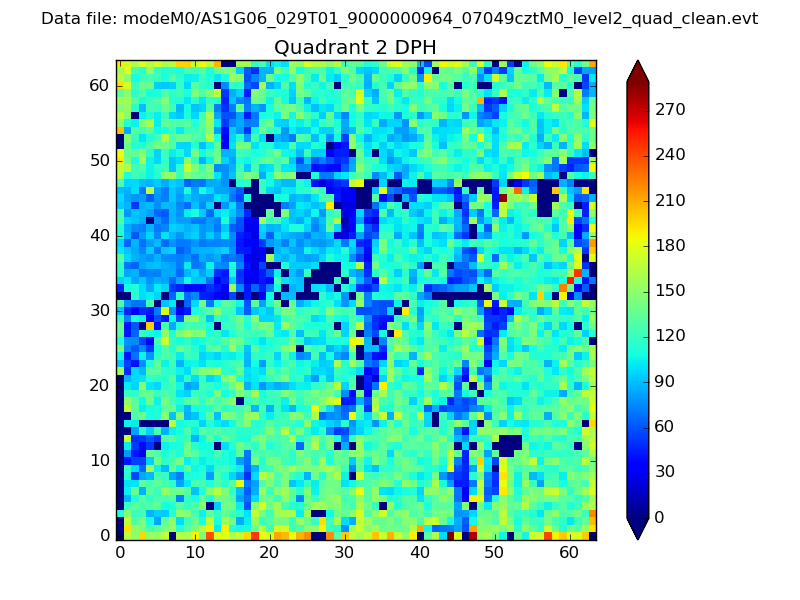
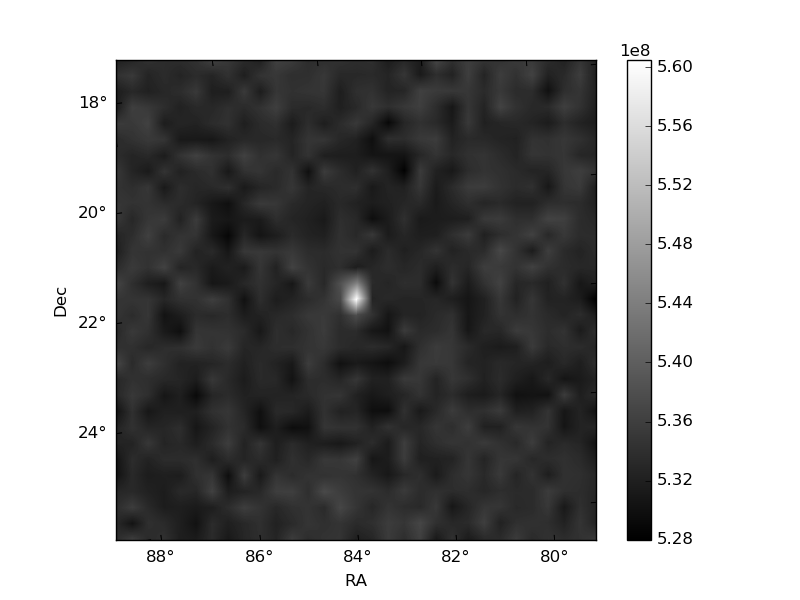
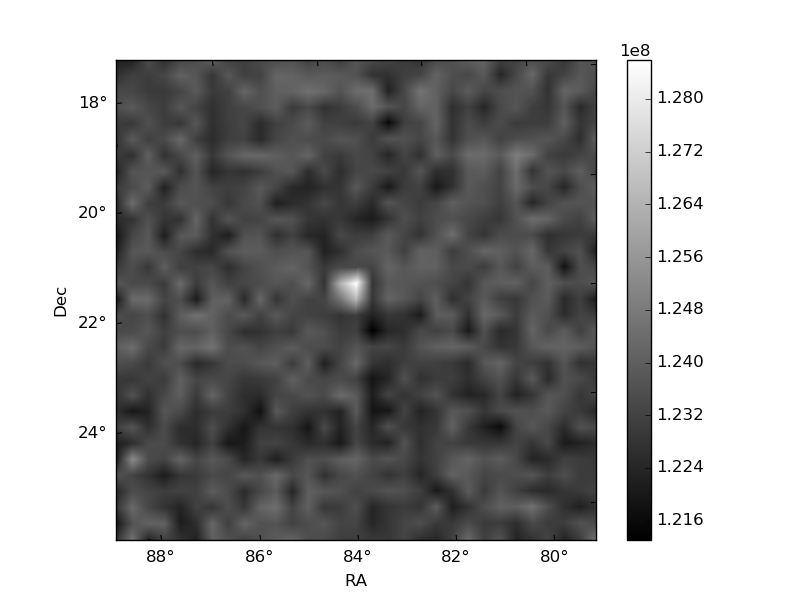
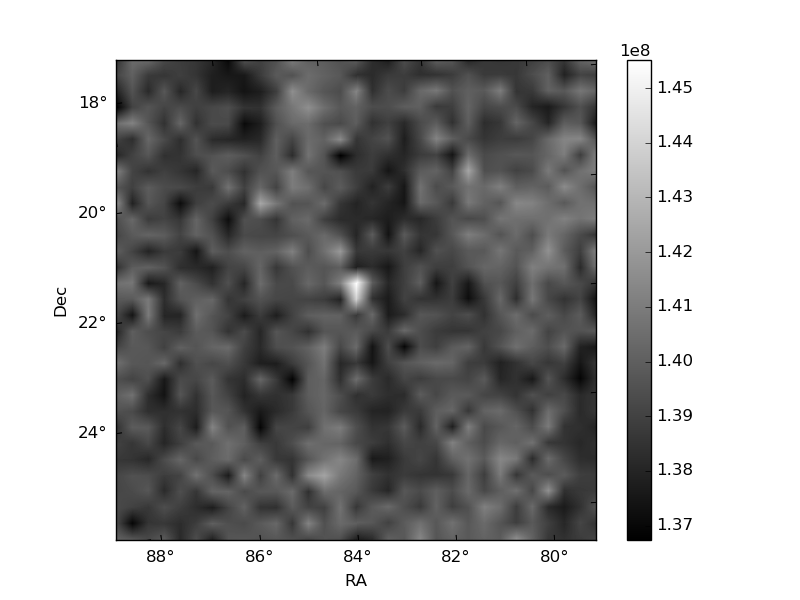
Histogram calculated using DETX and DETY for each event in the final _common_clean file
| Quadrant A | 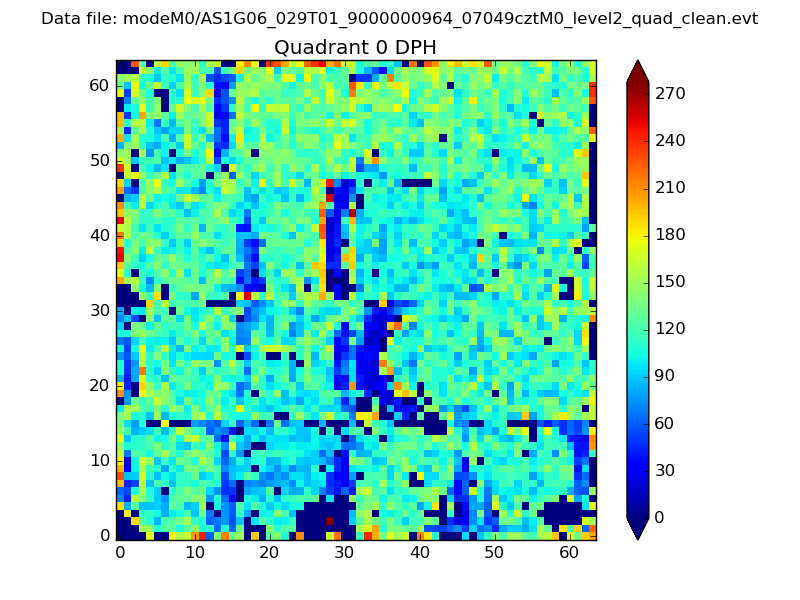 |
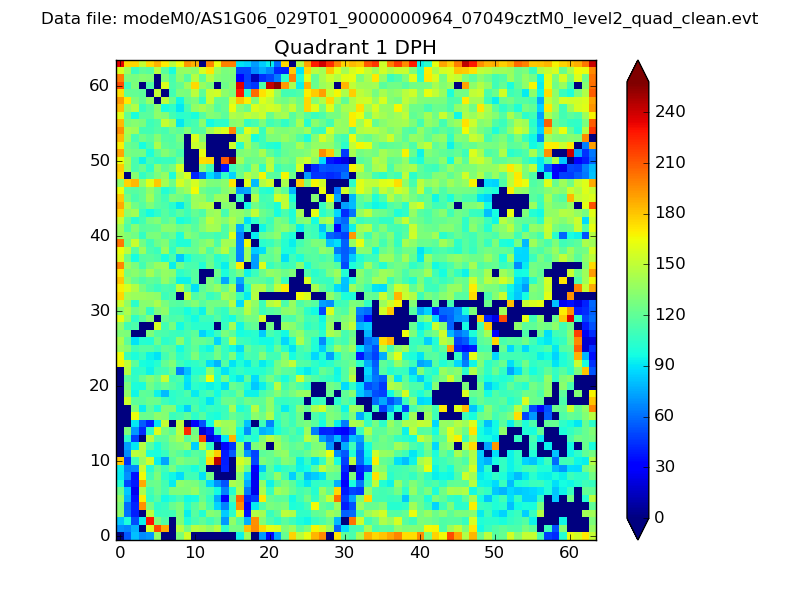 |
Quadrant B |
|---|---|---|---|
| Quadrant D | 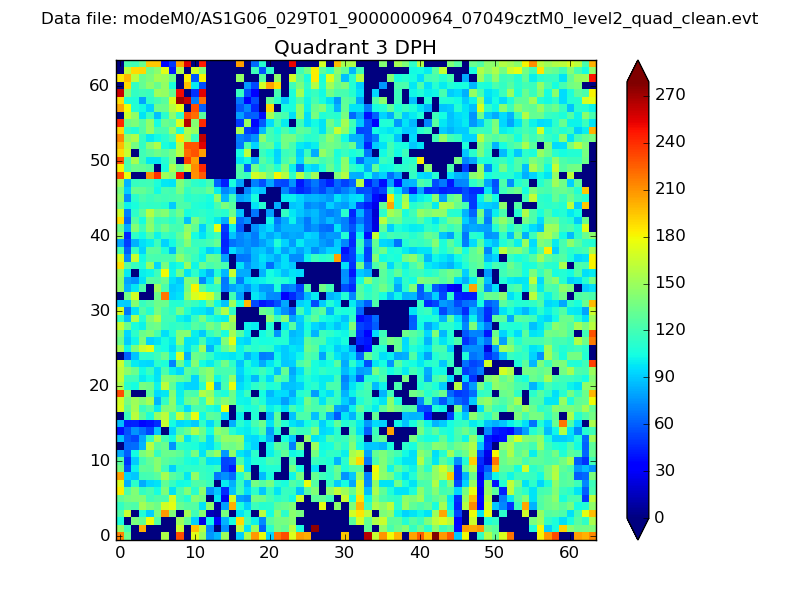 |
 |
Quadrant C |
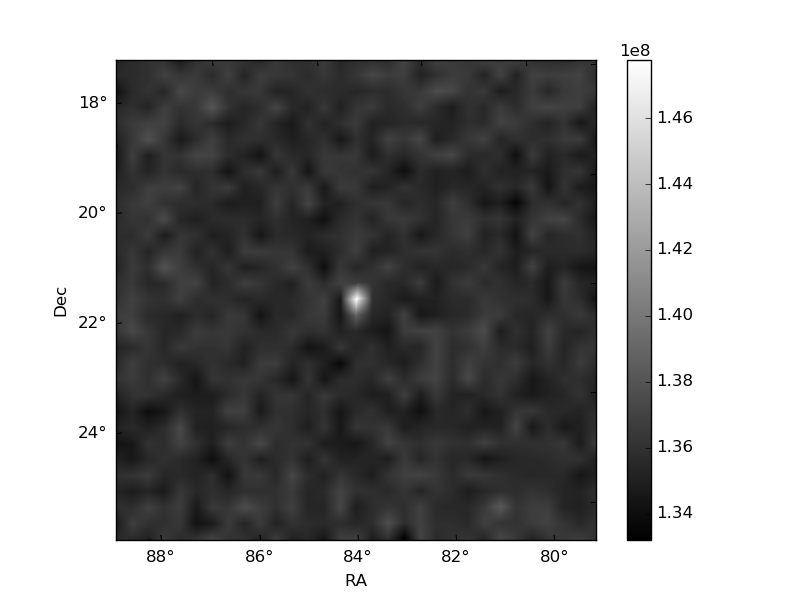
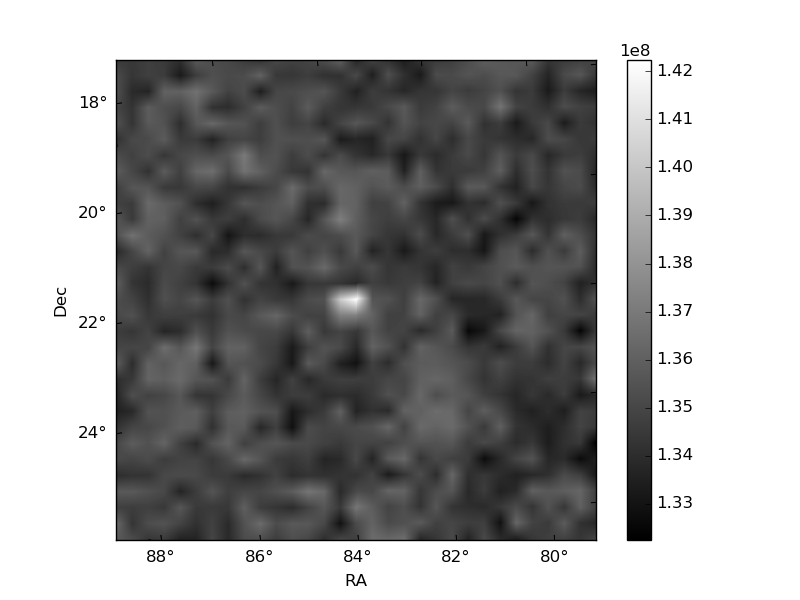
| Plot type | Count rate plots | Images |
|---|---|---|
| Comparison with Poisson distribution Blue bars denote a histogram of data divided into 1 sec bins. Red curve is a Poisson curve with rate = median count rate of data. |
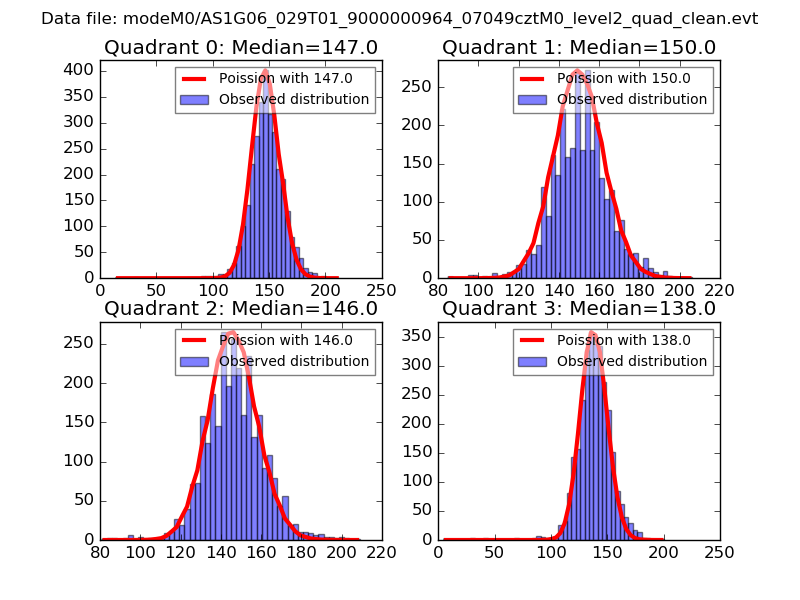 |
 |
| Quadrant-wise count rates Data is divided into 100 sec bins |
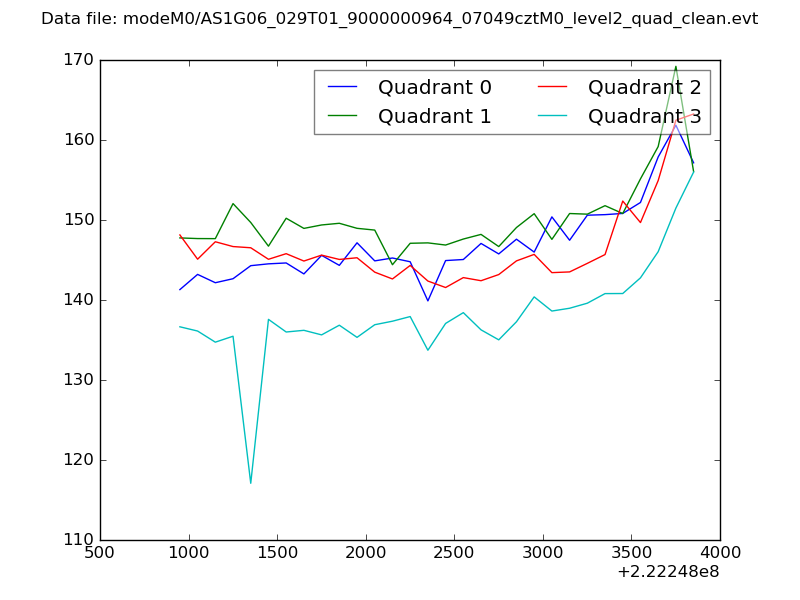 |
|
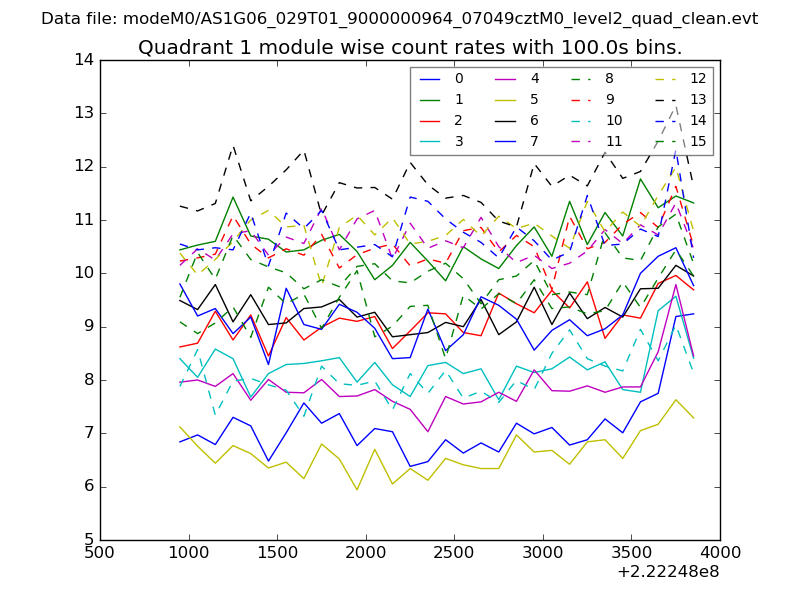
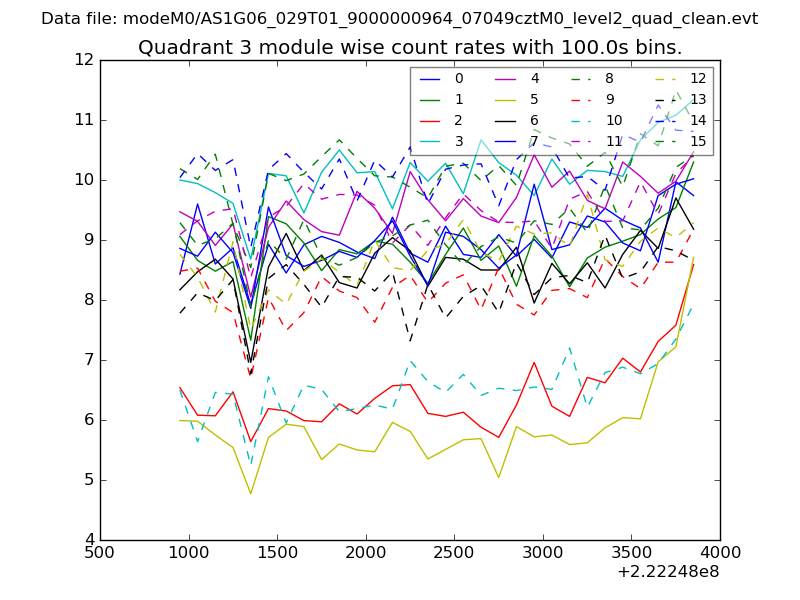
| Module-wise count rates for Quadrant A Data is divided into 100 sec bins |
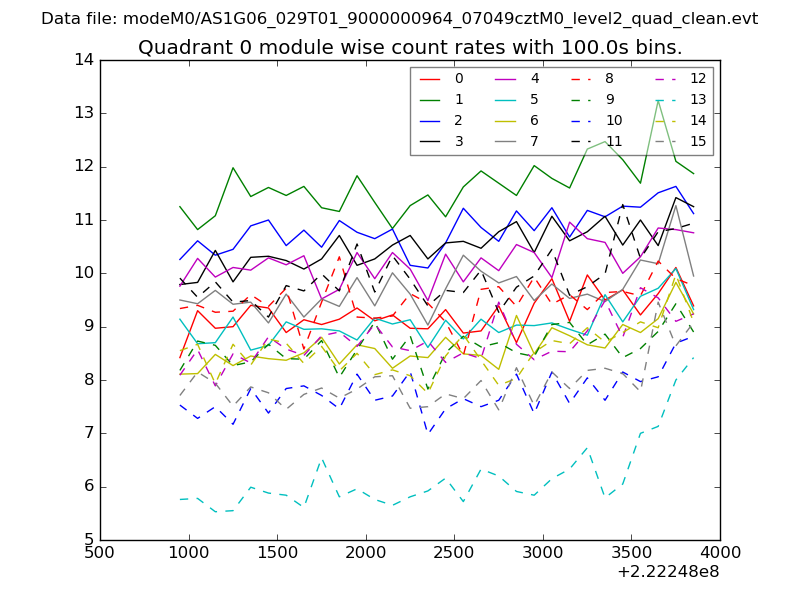 |
 |
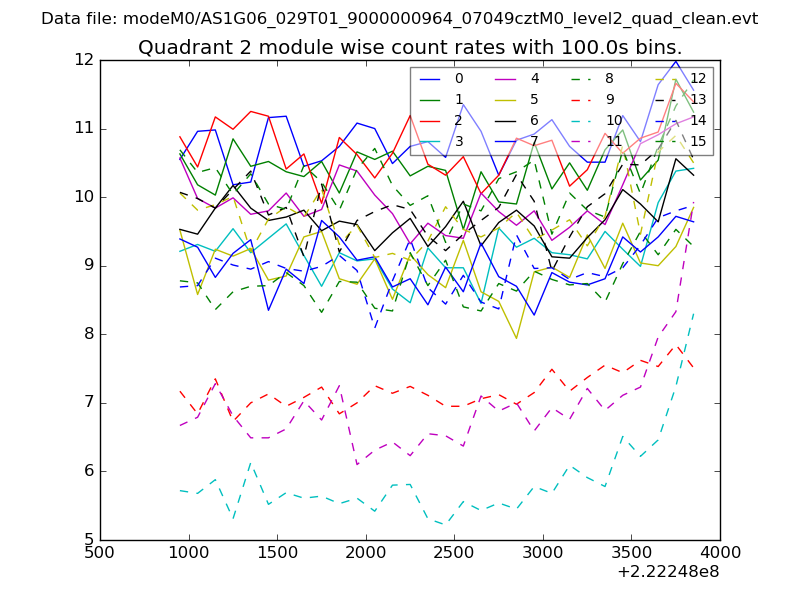
| Module-wise count rates for Quadrant B Data is divided into 100 sec bins |
 |
 |
| Module-wise count rates for Quadrant C Data is divided into 100 sec bins |
 |
 |
| Module-wise count rates for Quadrant D Data is divided into 100 sec bins |
 |
 |
| Parameter | Plot |
|---|---|
| CZT HV Monitor | 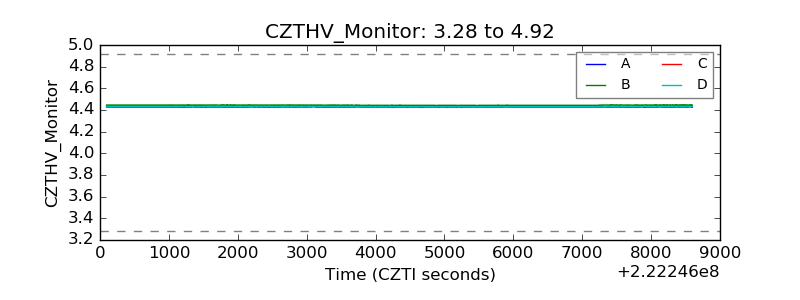 |
| D_VDD | 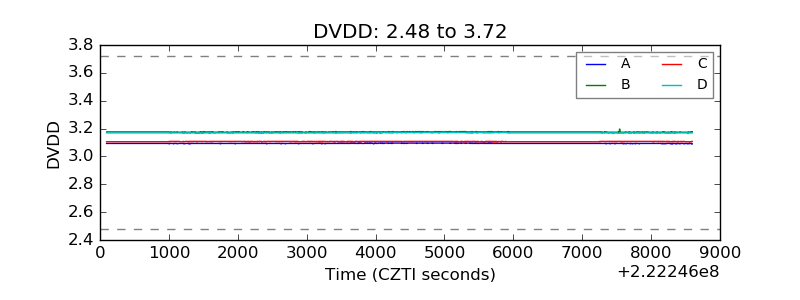 |
| Temperature 1 | 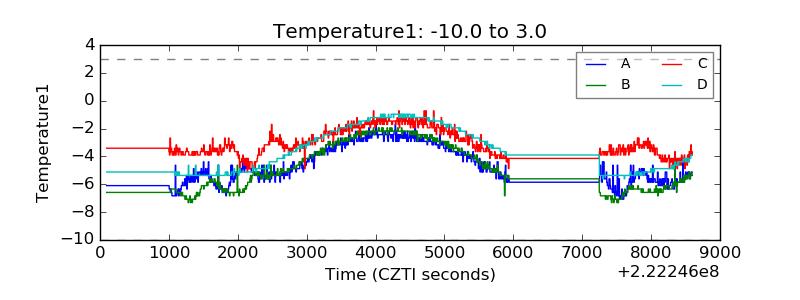 |
| Veto HV Monitor | 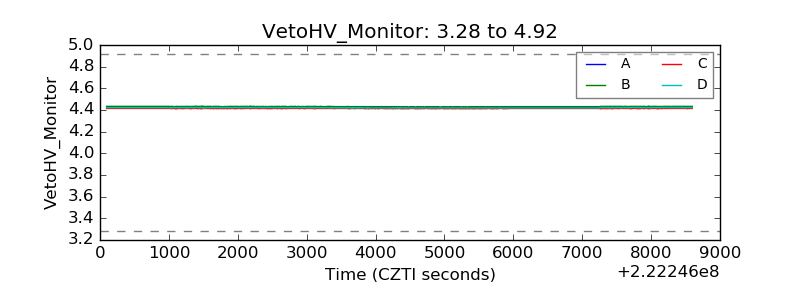 |
| Veto LLD | 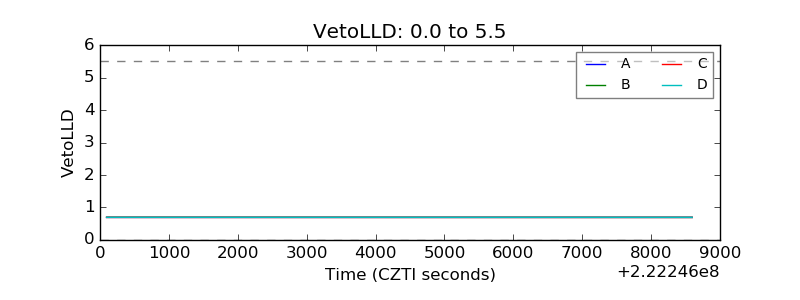 |
| Alpha Counter | 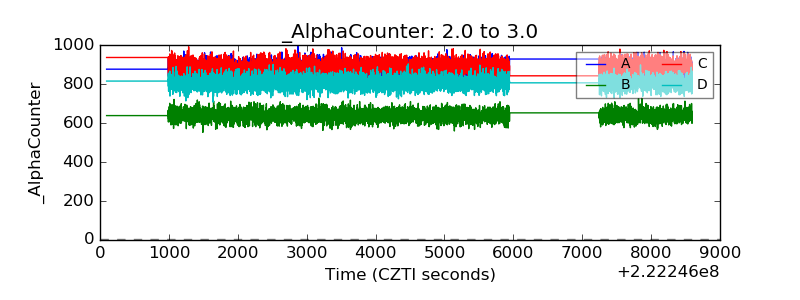 |
| _CPM_Rate | 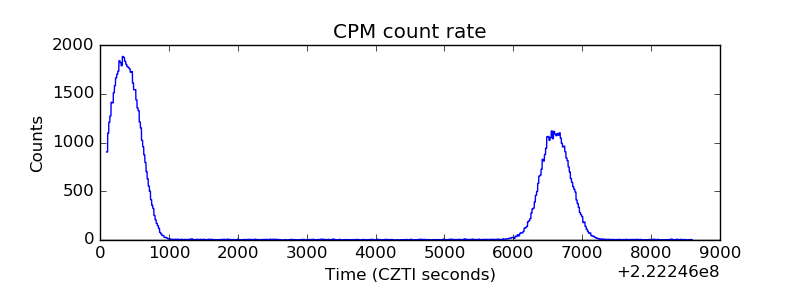 |
| CZT Counter | 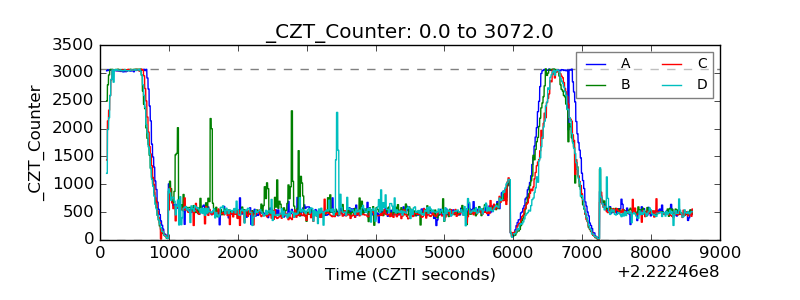 |
| +2.5 Volts monitor |  |
| +5 Volts monitor |  |
| _ROLL_ROT | 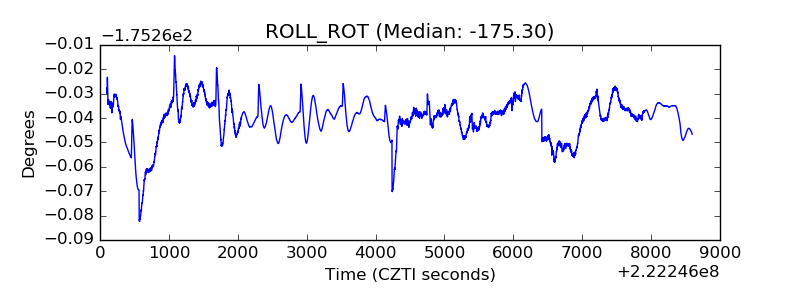 |
| _Roll_DEC | 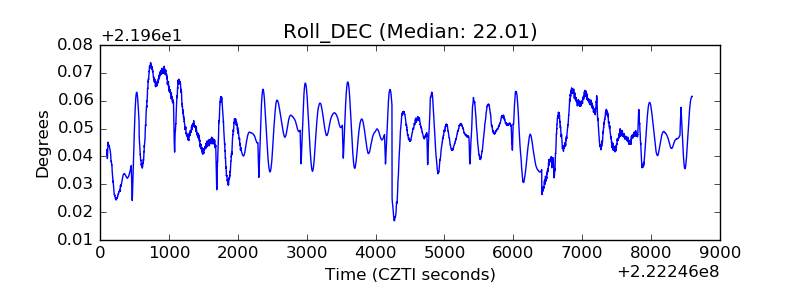 |
| _Roll_RA | 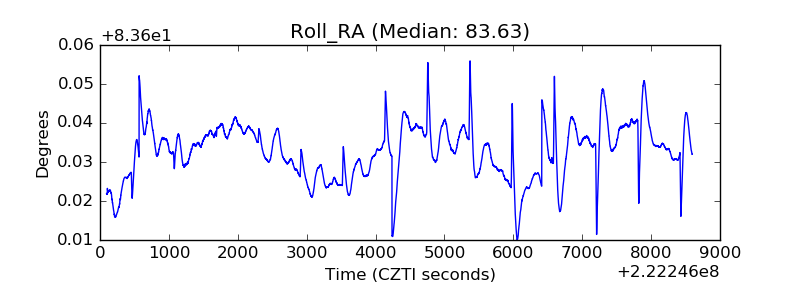 |
| Veto Counter | 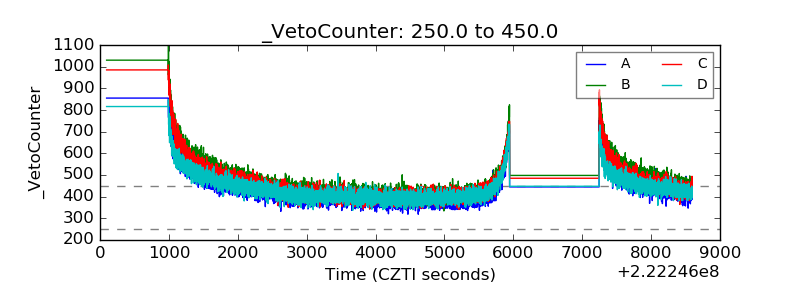 |