| Param | Original file | Final file |
|---|---|---|
| Filename | modeM0/AS1G06_029T01_9000000964_07050cztM0_level2.evt | modeM0/AS1G06_029T01_9000000964_07050cztM0_level2_quad_clean.evt |
| Size (bytes) | 824,832,000 | 157,357,440 |
| Size | 786.6 MB | 150.1 MB |
| Events in quadrant A | 5,953,453 | 1,005,181 |
| Events in quadrant B | 6,399,608 | 1,022,224 |
| Events in quadrant C | 5,718,123 | 999,710 |
| Events in quadrant D | 6,132,647 | 945,042 |
| Mode M0 | |||
|---|---|---|---|
| Quadrant | BADHDUFLAG | Total packets | Discarded packets |
| A | 0 | 24272 | 3 |
| B | 0 | 25746 | 2 |
| C | 0 | 24068 | 2 |
| D | 0 | 24937 | 2 |
| Mode M9 | |||
|---|---|---|---|
| Quadrant | BADHDUFLAG | Total packets | Discarded packets |
| A | 0 | 24 | 0 |
| B | 0 | 24 | 0 |
| C | 0 | 24 | 0 |
| D | 0 | 24 | 0 |
| Mode SS | |||
|---|---|---|---|
| Quadrant | BADHDUFLAG | Total packets | Discarded packets |
| A | 0 | 234 | 0 |
| B | 0 | 234 | 0 |
| C | 0 | 234 | 0 |
| D | 0 | 234 | 0 |
| Quadrant | Total seconds | Saturated seconds | Saturation percentage |
|---|---|---|---|
| A | 11467 | 211 | 1.840063% |
| B | 11467 | 310 | 2.703410% |
| C | 11467 | 151 | 1.316822% |
| D | 11467 | 170 | 1.482515% |
Noise dominated data is calculated using 1-second bins in cleaned event files. If a bin has >2000 counts, and if more than 50% of those come from <1% of pixels, then it is considered to be noise-dominated and hence unusable.
| Quadrant | # 1 sec bins | Bins with >0 counts | Bins with >2000 counts | High rate bins dominated by noise | Noise dominated (total time) | Noise dominated (detector-on time) | Marked lightcurve |
|---|---|---|---|---|---|---|---|
| A | 13897 | 11469 | 6 | 6 | 0.04% | 0.05% | 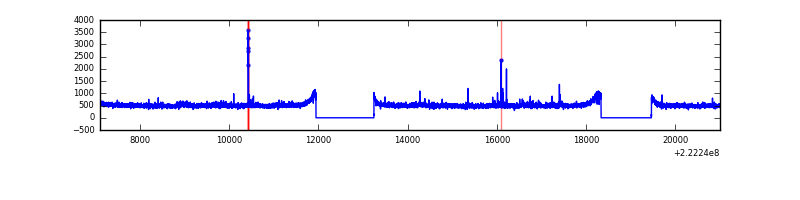 |
| B | 13897 | 11469 | 41 | 41 | 0.30% | 0.36% | 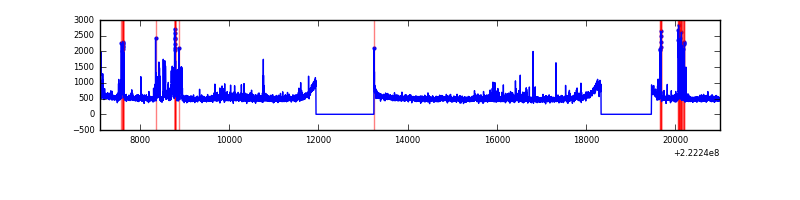 |
| C | 13897 | 11469 | 5 | 5 | 0.04% | 0.04% | 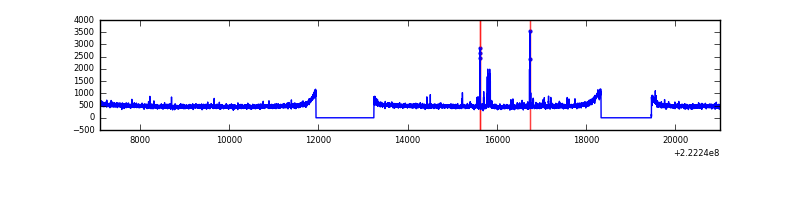 |
| D | 13897 | 11469 | 37 | 37 | 0.27% | 0.32% | 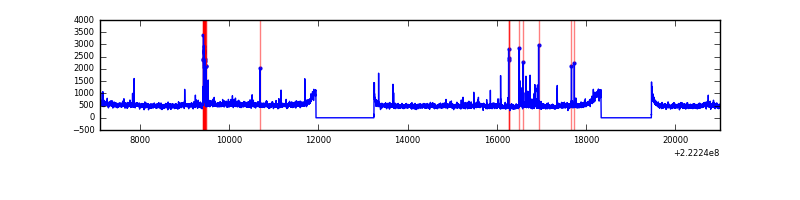 |
Top three noisy pixels from each quadrant. If the there are fewer than three noisy pixels in the level2.evt file, extra rows are filled as -1
| Pixel properties | Quadrant properties | ||||||
|---|---|---|---|---|---|---|---|
| Quadrant | DetID | PixID | Counts | Sigma | Mean | Median | Sigma |
| A | 13 | 251 | 195246 | 646.26 | 1489 | 1461 | 299.9 |
| A | 15 | 234 | 21648 | 67.32 | 1489 | 1461 | 299.9 |
| A | 0 | 226 | 14052 | 41.99 | 1489 | 1461 | 299.9 |
| B | 3 | 220 | 234171 | 823.37 | 1498 | 1470 | 282.6 |
| B | 4 | 81 | 191844 | 673.6 | 1498 | 1470 | 282.6 |
| B | 0 | 214 | 135820 | 475.37 | 1498 | 1470 | 282.6 |
| C | 9 | 68 | 112578 | 336.35 | 1433 | 1451 | 330.4 |
| C | 13 | 61 | 10947 | 28.74 | 1433 | 1451 | 330.4 |
| C | 1 | 16 | 7857 | 19.39 | 1433 | 1451 | 330.4 |
| D | 8 | 195 | 483192 | 1375.46 | 1431 | 1392 | 350.3 |
| D | 14 | 34 | 81781 | 229.5 | 1431 | 1392 | 350.3 |
| D | 2 | 33 | 74878 | 209.79 | 1431 | 1392 | 350.3 |
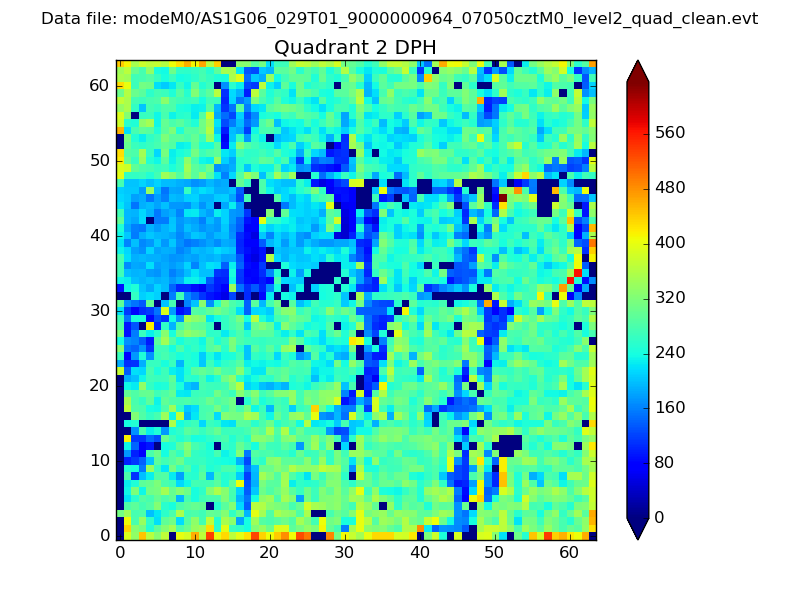
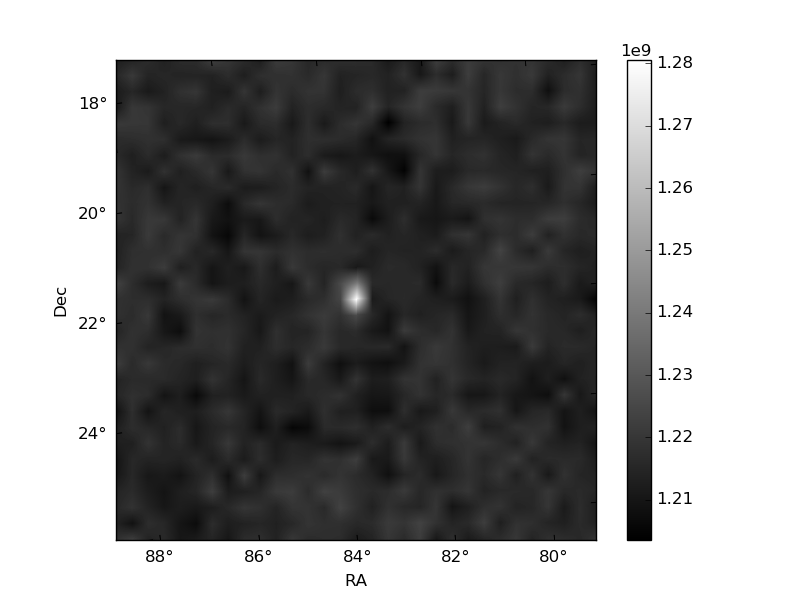
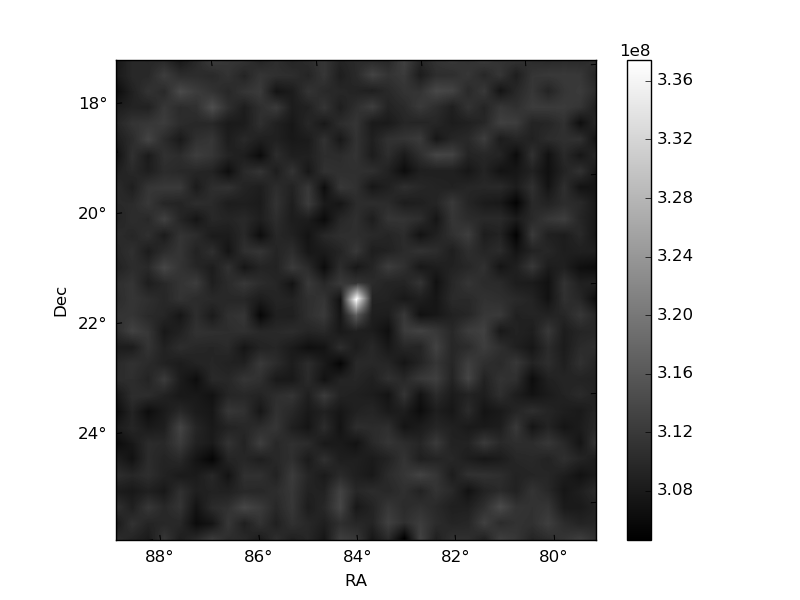
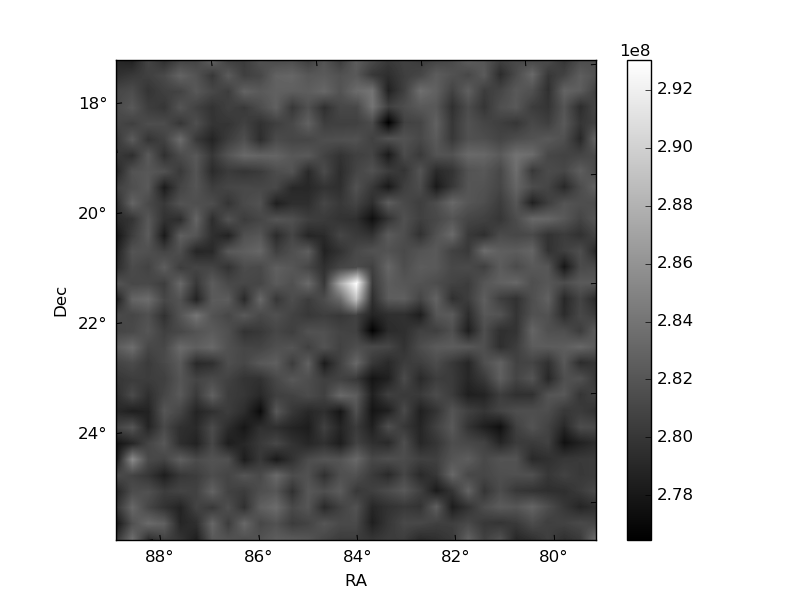
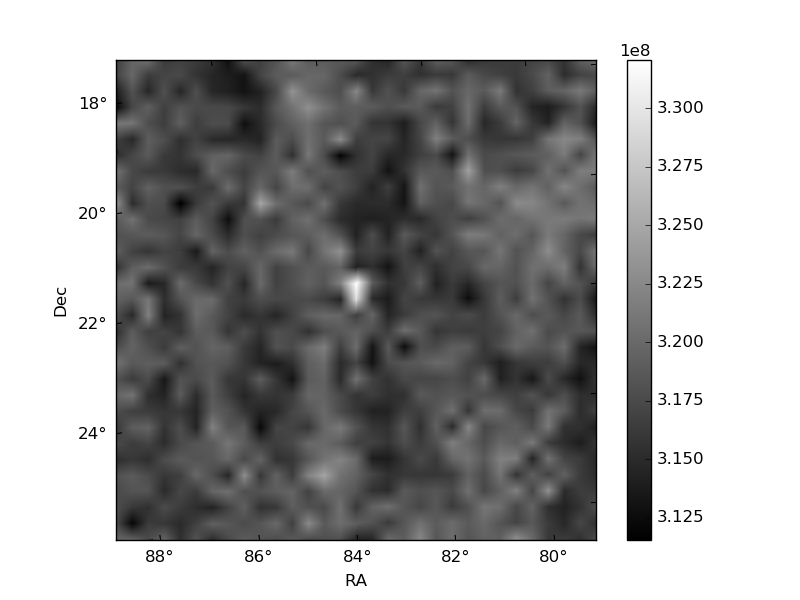
Histogram calculated using DETX and DETY for each event in the final _common_clean file
| Quadrant A | 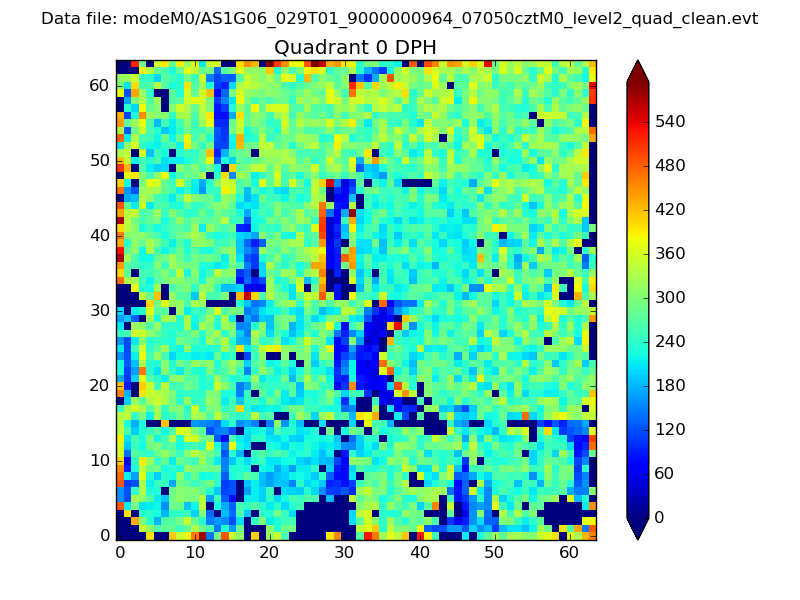 |
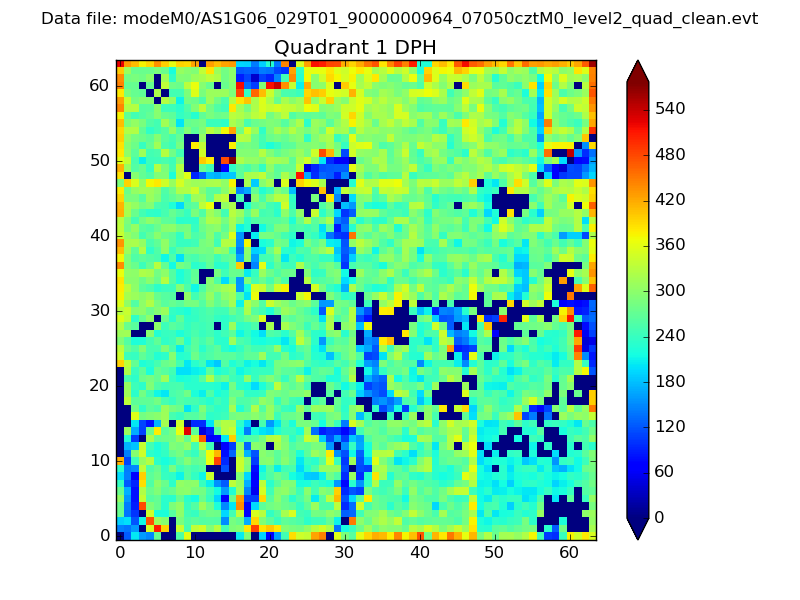 |
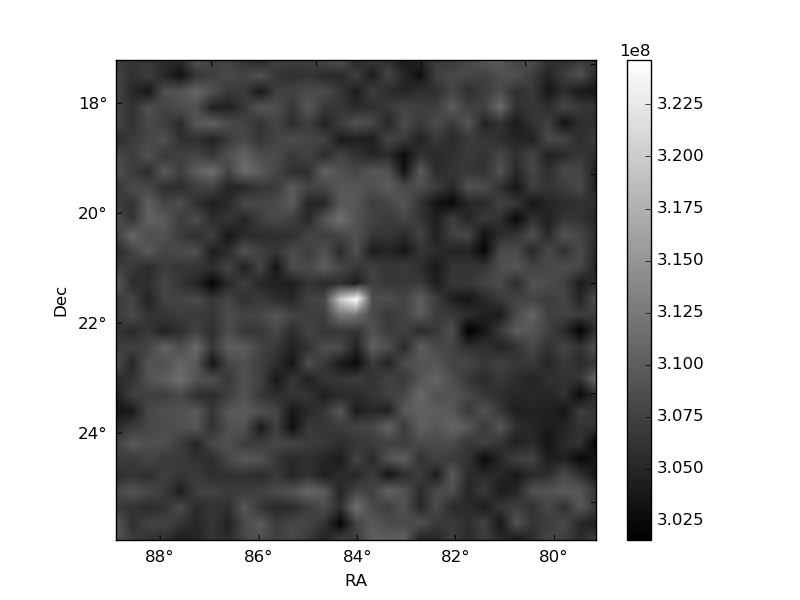
Quadrant B |
|---|---|---|---|
| Quadrant D | 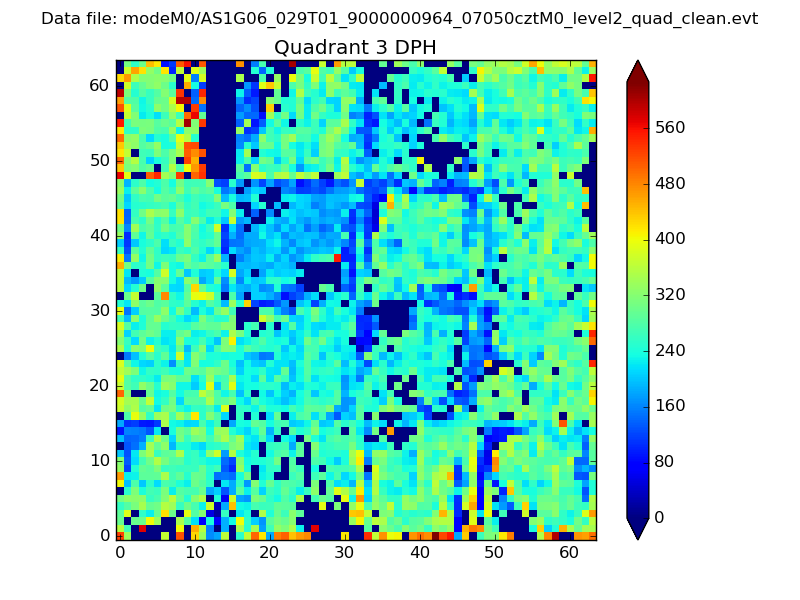 |
 |
Quadrant C |
| Plot type | Count rate plots | Images |
|---|---|---|
| Comparison with Poisson distribution Blue bars denote a histogram of data divided into 1 sec bins. Red curve is a Poisson curve with rate = median count rate of data. |
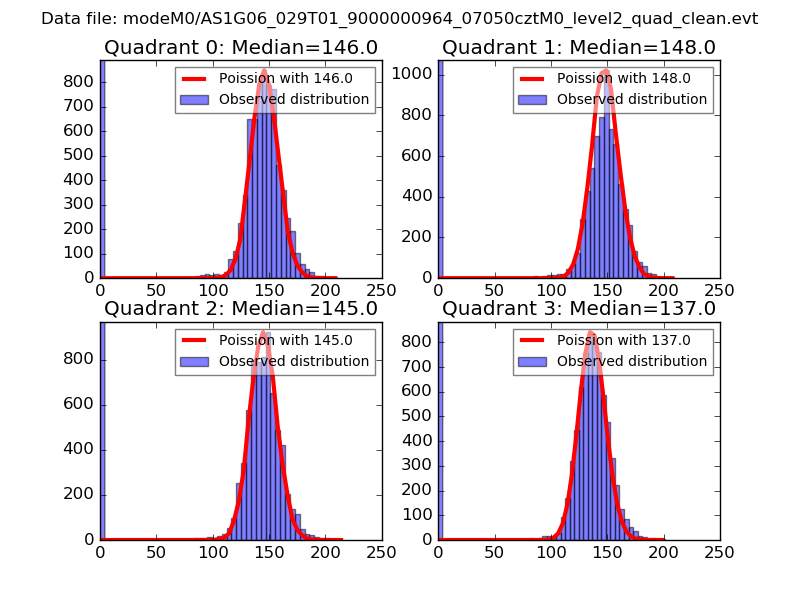 |
 |
| Quadrant-wise count rates Data is divided into 100 sec bins |
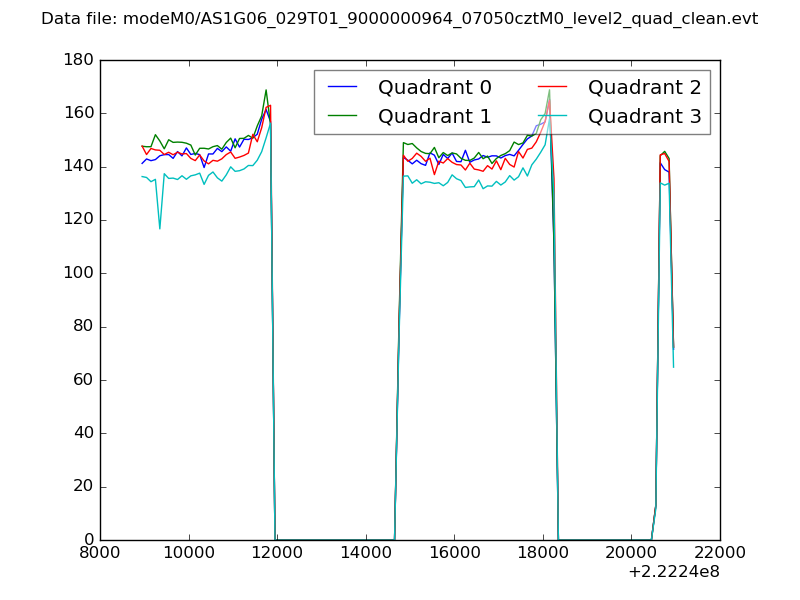 |
|
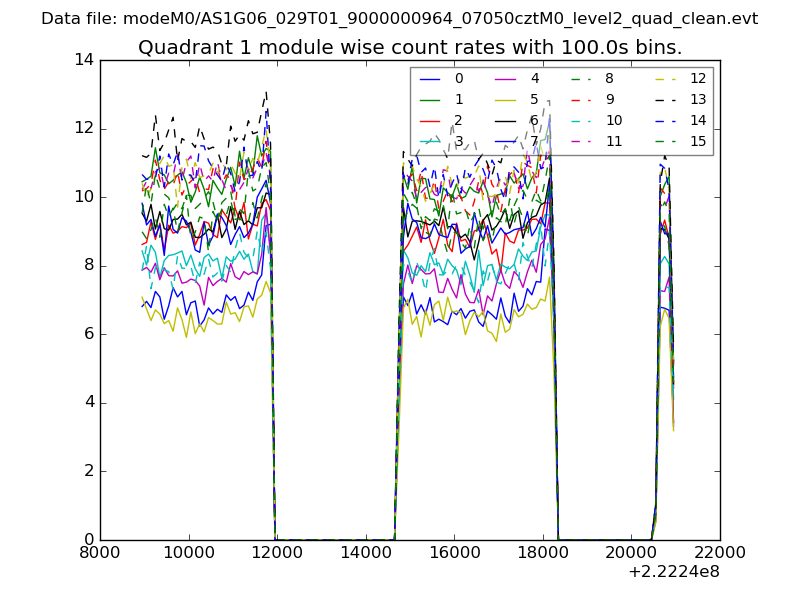
| Module-wise count rates for Quadrant A Data is divided into 100 sec bins |
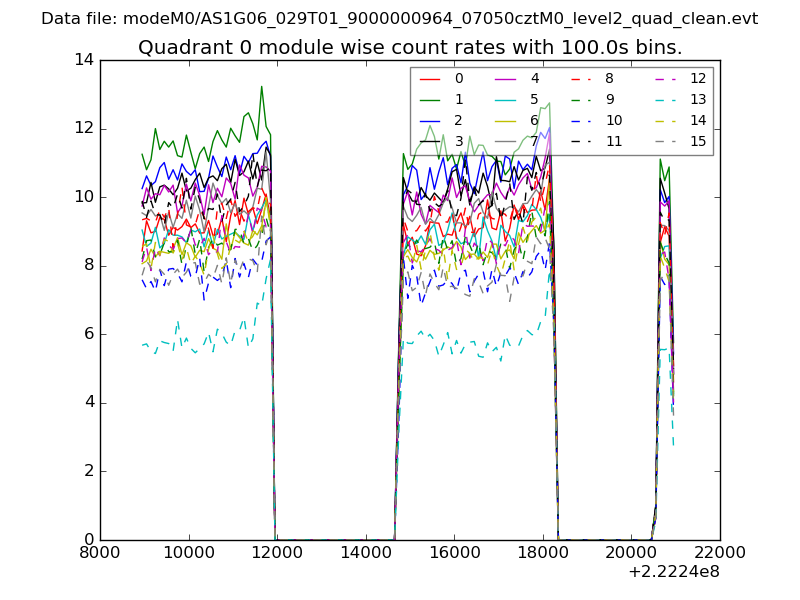 |
 |
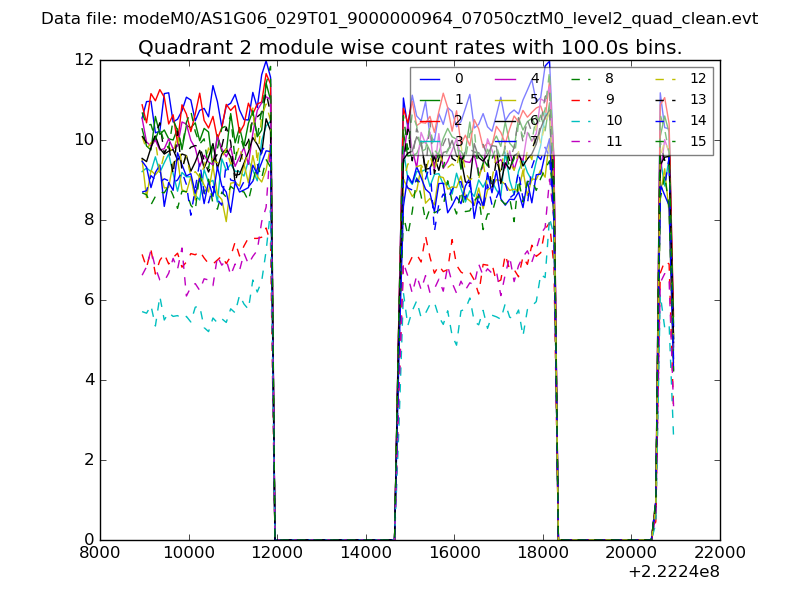
| Module-wise count rates for Quadrant B Data is divided into 100 sec bins |
 |
 |
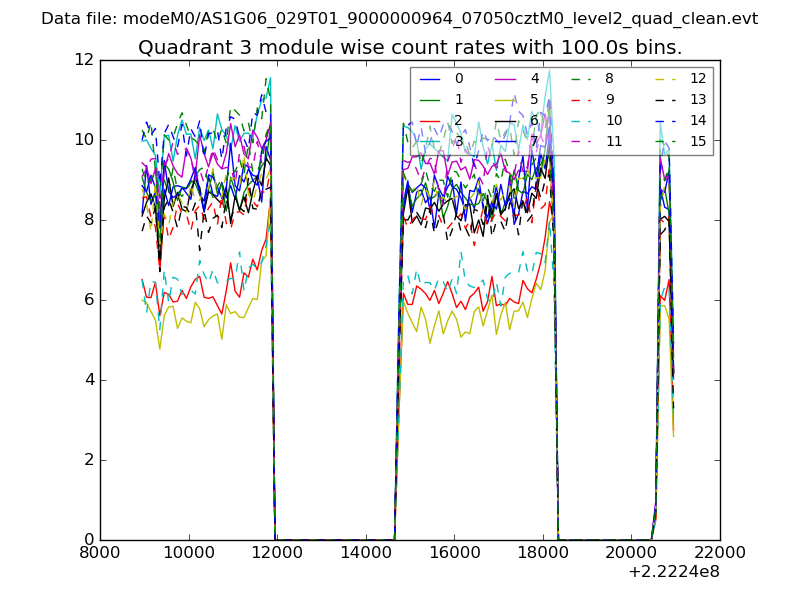
| Module-wise count rates for Quadrant C Data is divided into 100 sec bins |
 |
 |
| Module-wise count rates for Quadrant D Data is divided into 100 sec bins |
 |
 |
| Parameter | Plot |
|---|---|
| CZT HV Monitor | 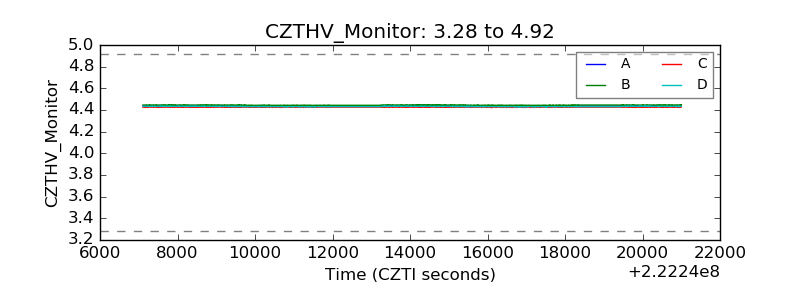 |
| D_VDD | 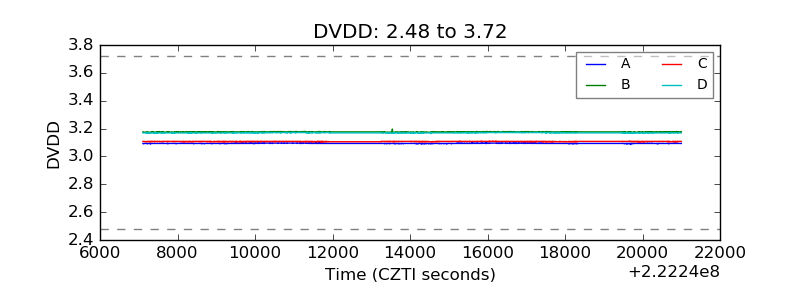 |
| Temperature 1 | 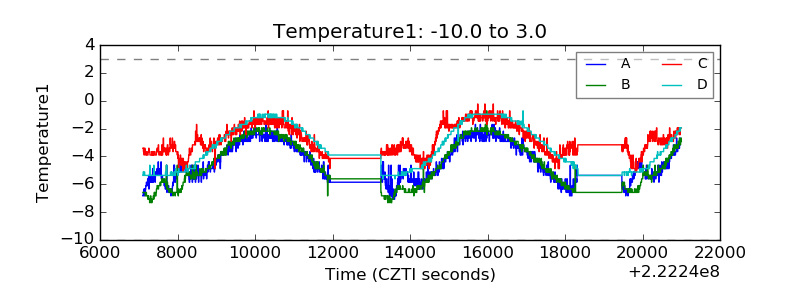 |
| Veto HV Monitor | 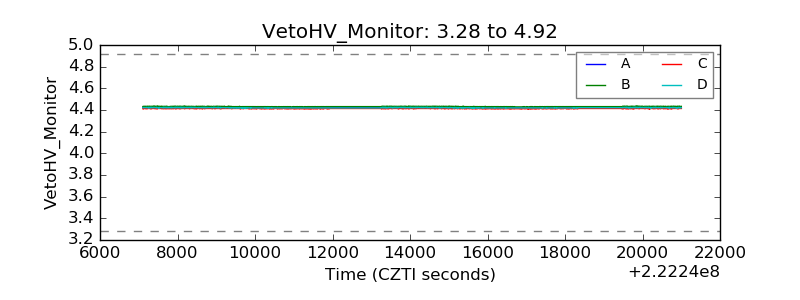 |
| Veto LLD | 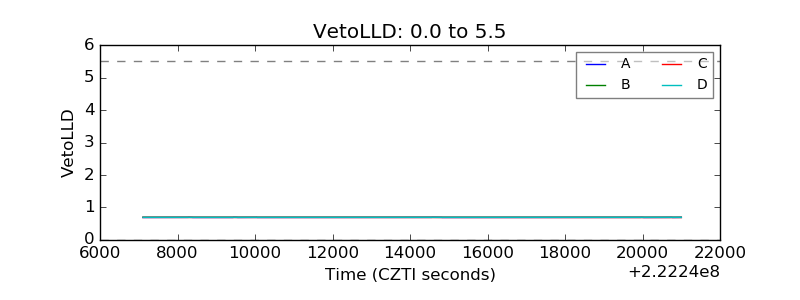 |
| Alpha Counter | 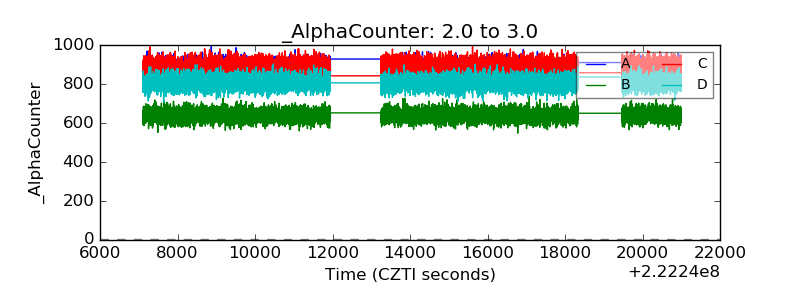 |
| _CPM_Rate | 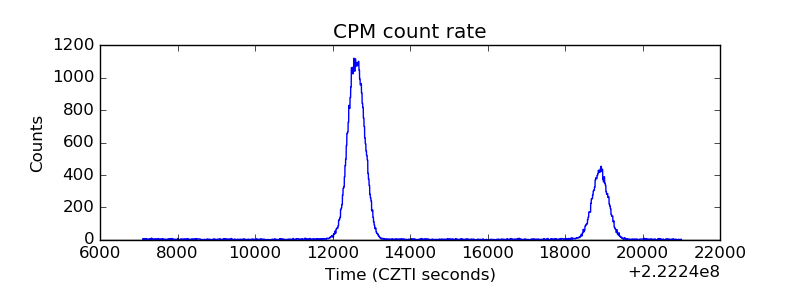 |
| CZT Counter | 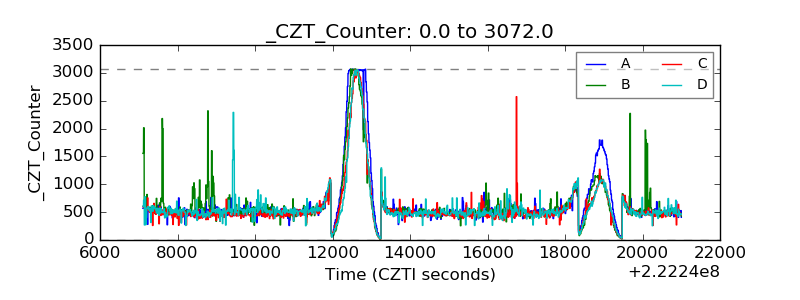 |
| +2.5 Volts monitor |  |
| +5 Volts monitor |  |
| _ROLL_ROT | 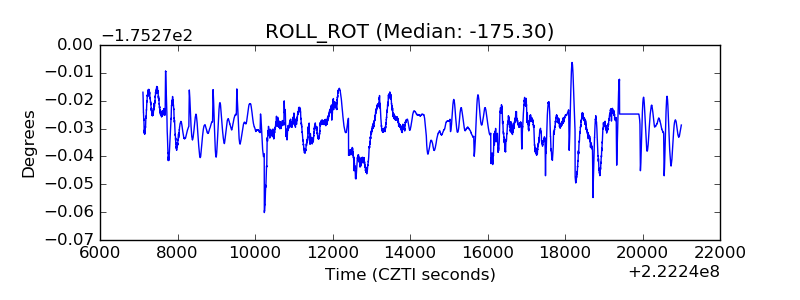 |
| _Roll_DEC | 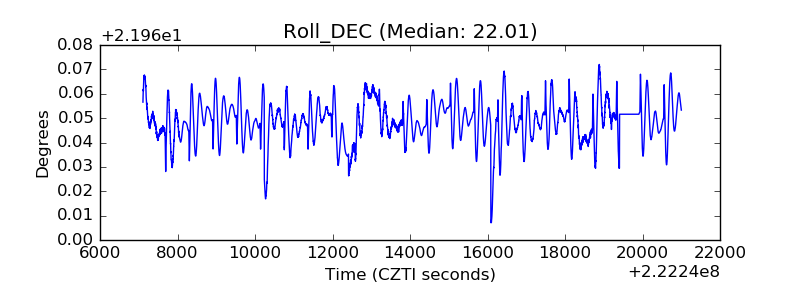 |
| _Roll_RA | 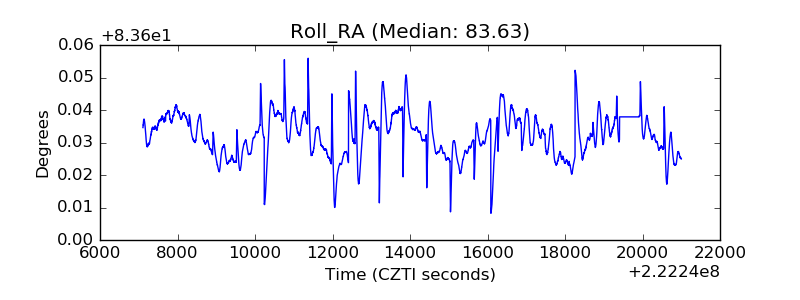 |
| Veto Counter | 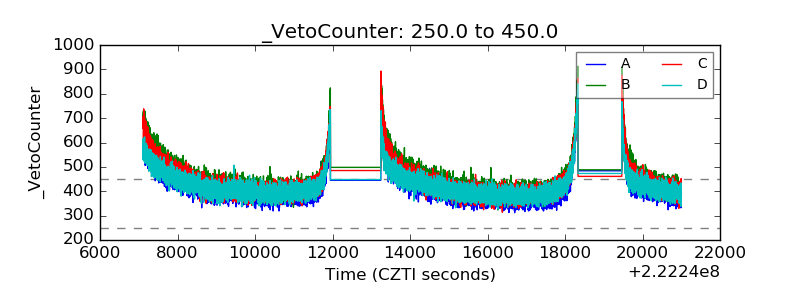 |