| Param | Original file | Final file |
|---|---|---|
| Filename | modeM0/AS1G06_029T01_9000000964_07051cztM0_level2.evt | modeM0/AS1G06_029T01_9000000964_07051cztM0_level2_quad_clean.evt |
| Size (bytes) | 501,523,200 | 92,810,880 |
| Size | 478.3 MB | 88.5 MB |
| Events in quadrant A | 3,287,818 | 595,812 |
| Events in quadrant B | 3,736,962 | 601,923 |
| Events in quadrant C | 4,243,223 | 579,873 |
| Events in quadrant D | 3,461,568 | 561,890 |
| Mode M0 | |||
|---|---|---|---|
| Quadrant | BADHDUFLAG | Total packets | Discarded packets |
| A | 0 | 13948 | 3 |
| B | 0 | 15206 | 2 |
| C | 0 | 17041 | 2 |
| D | 0 | 14424 | 2 |
| Mode M9 | |||
|---|---|---|---|
| Quadrant | BADHDUFLAG | Total packets | Discarded packets |
| A | 0 | 16 | 0 |
| B | 0 | 16 | 0 |
| C | 0 | 16 | 0 |
| D | 0 | 17 | 0 |
| Mode SS | |||
|---|---|---|---|
| Quadrant | BADHDUFLAG | Total packets | Discarded packets |
| A | 0 | 138 | 0 |
| B | 0 | 138 | 0 |
| C | 0 | 138 | 0 |
| D | 0 | 138 | 0 |
| Quadrant | Total seconds | Saturated seconds | Saturation percentage |
|---|---|---|---|
| A | 6754 | 114 | 1.687889% |
| B | 6754 | 226 | 3.346165% |
| C | 6754 | 547 | 8.098904% |
| D | 6754 | 85 | 1.258513% |
Noise dominated data is calculated using 1-second bins in cleaned event files. If a bin has >2000 counts, and if more than 50% of those come from <1% of pixels, then it is considered to be noise-dominated and hence unusable.
| Quadrant | # 1 sec bins | Bins with >0 counts | Bins with >2000 counts | High rate bins dominated by noise | Noise dominated (total time) | Noise dominated (detector-on time) | Marked lightcurve |
|---|---|---|---|---|---|---|---|
| A | 7669 | 6755 | 0 | 0 | 0.00% | 0.00% | 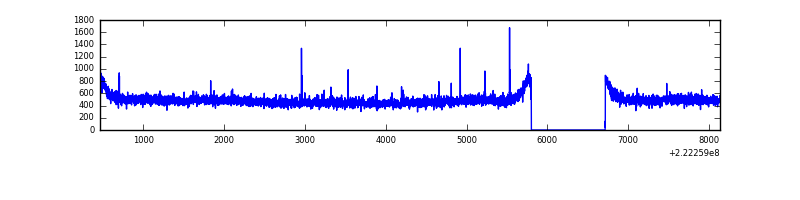 |
| B | 7669 | 6755 | 52 | 52 | 0.68% | 0.77% | 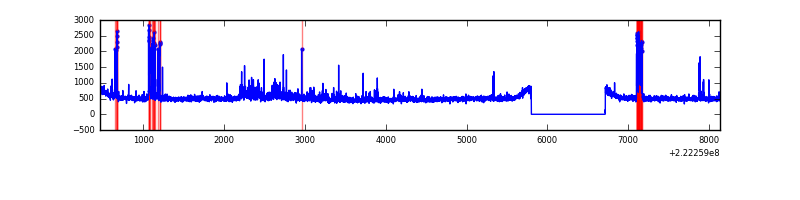 |
| C | 7669 | 6755 | 441 | 441 | 5.75% | 6.53% | 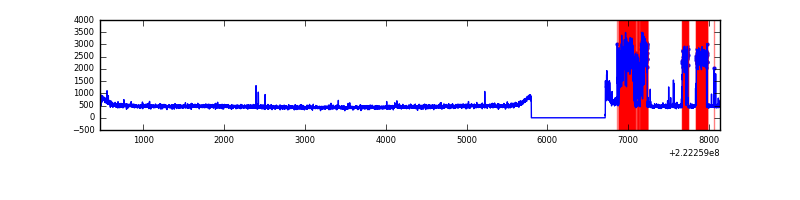 |
| D | 7669 | 6755 | 13 | 13 | 0.17% | 0.19% | 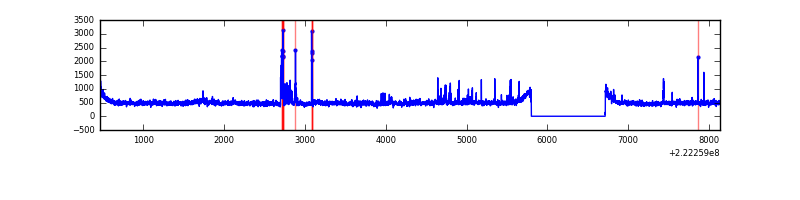 |
Top three noisy pixels from each quadrant. If the there are fewer than three noisy pixels in the level2.evt file, extra rows are filled as -1
| Pixel properties | Quadrant properties | ||||||
|---|---|---|---|---|---|---|---|
| Quadrant | DetID | PixID | Counts | Sigma | Mean | Median | Sigma |
| A | 13 | 251 | 10876 | 58.26 | 847 | 830 | 172.4 |
| A | 15 | 234 | 9629 | 51.03 | 847 | 830 | 172.4 |
| A | 8 | 15 | 8344 | 43.58 | 847 | 830 | 172.4 |
| B | 4 | 81 | 244165 | 1488.43 | 848 | 830 | 163.5 |
| B | 10 | 246 | 91124 | 552.31 | 848 | 830 | 163.5 |
| B | 0 | 214 | 86743 | 525.51 | 848 | 830 | 163.5 |
| C | 9 | 68 | 1166499 | 6352.66 | 786 | 794 | 183.5 |
| C | 12 | 4 | 7480 | 36.44 | 786 | 794 | 183.5 |
| C | 13 | 61 | 6094 | 28.88 | 786 | 794 | 183.5 |
| D | 8 | 195 | 188357 | 923.47 | 817 | 791 | 203.1 |
| D | 14 | 34 | 77875 | 379.52 | 817 | 791 | 203.1 |
| D | 12 | 233 | 47659 | 230.75 | 817 | 791 | 203.1 |
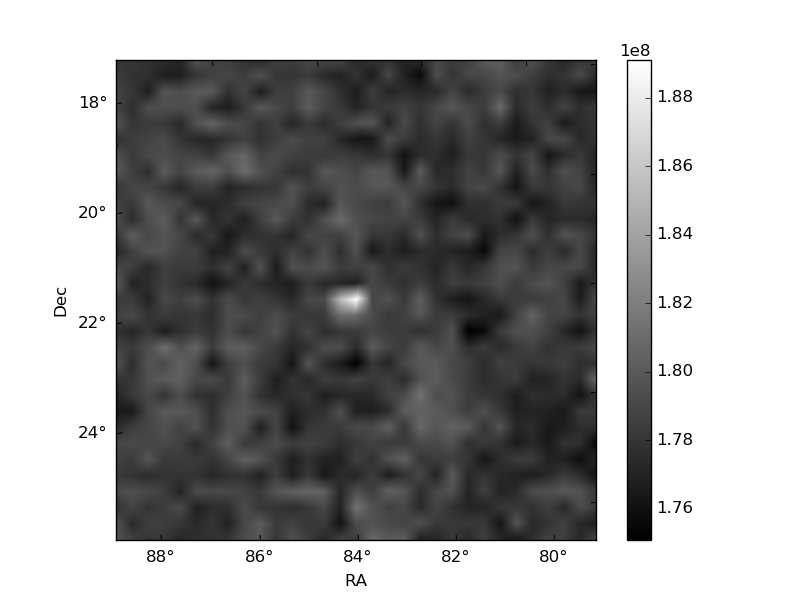
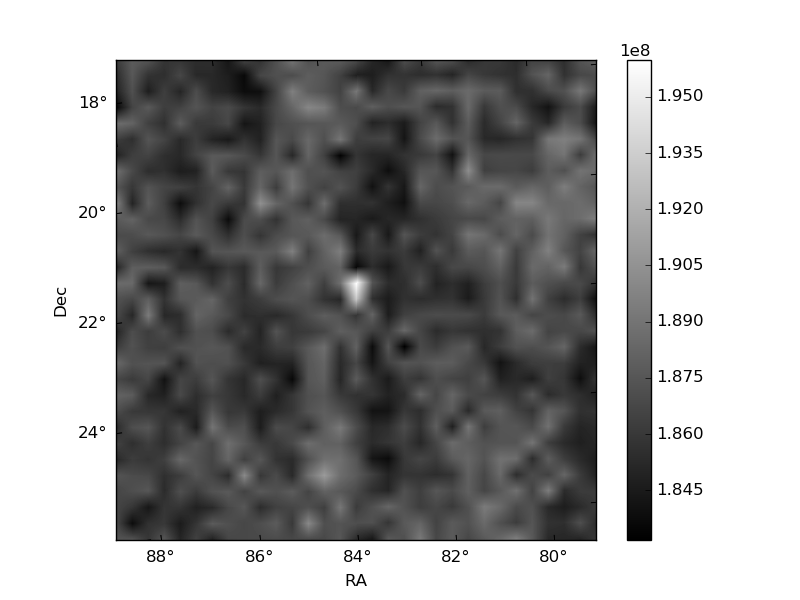
Histogram calculated using DETX and DETY for each event in the final _common_clean file
| Quadrant A | 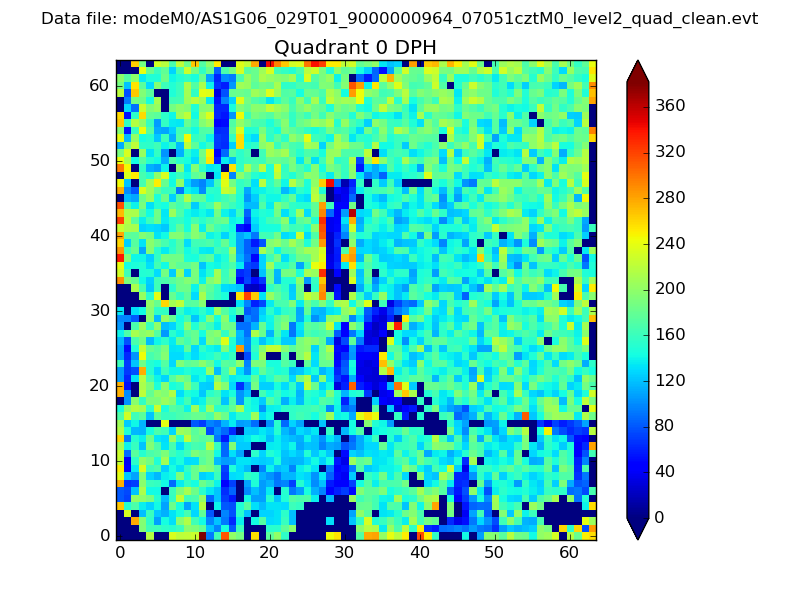 |
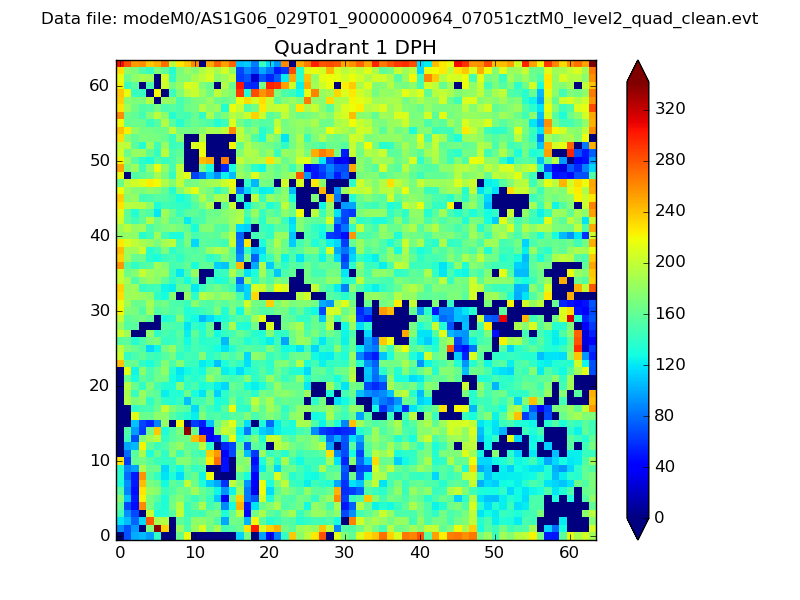 |
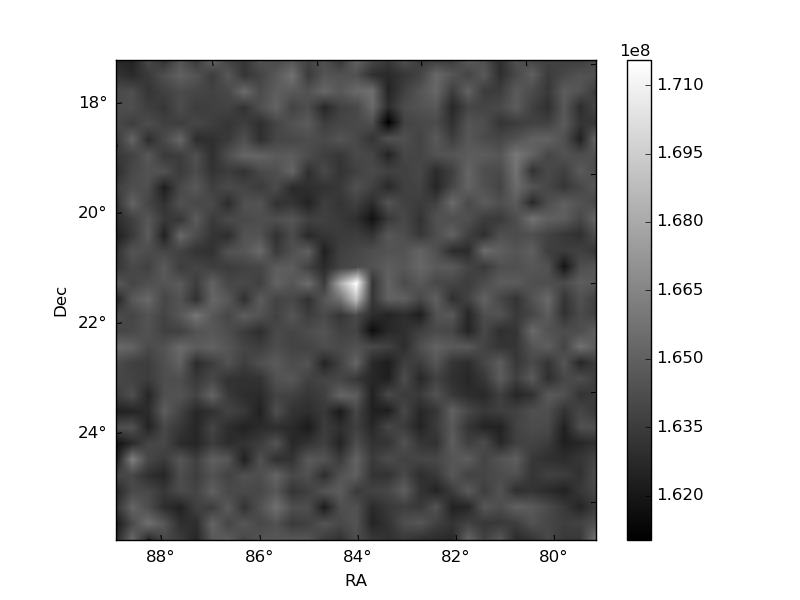
Quadrant B |
|---|---|---|---|
| Quadrant D | 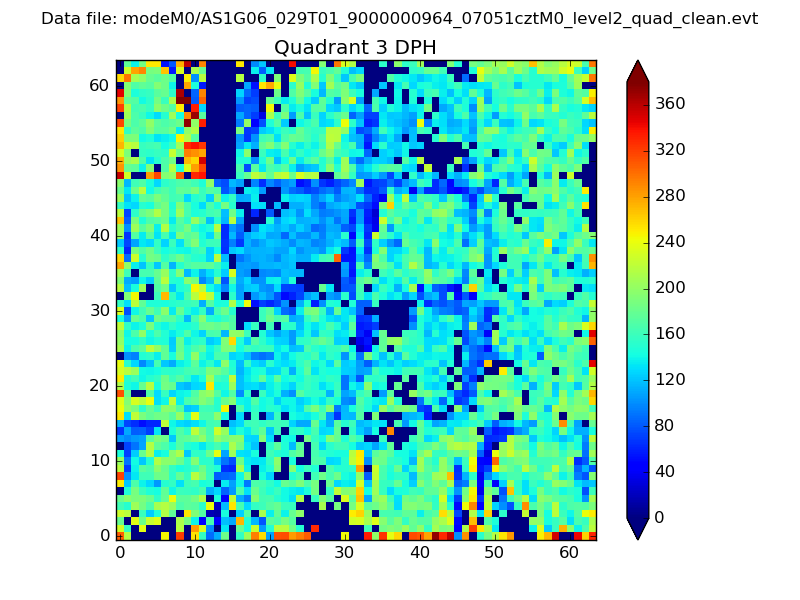 |
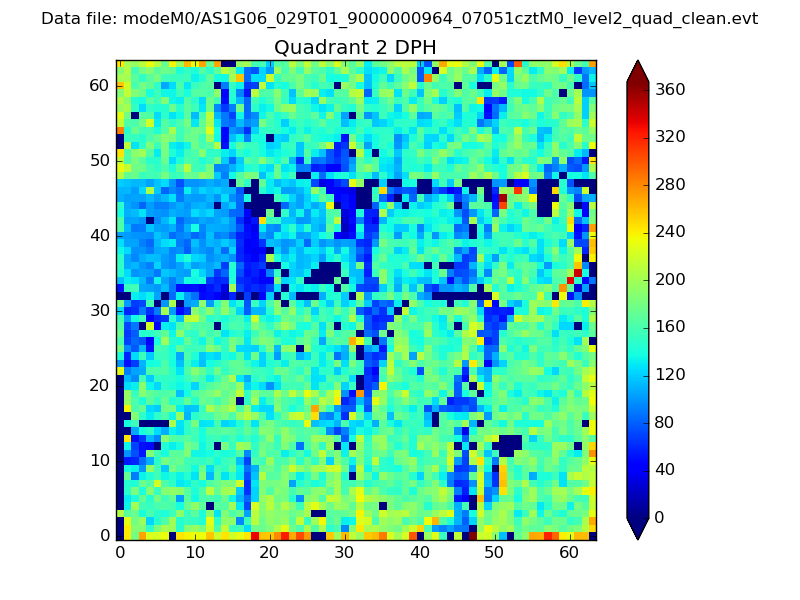 |
Quadrant C |
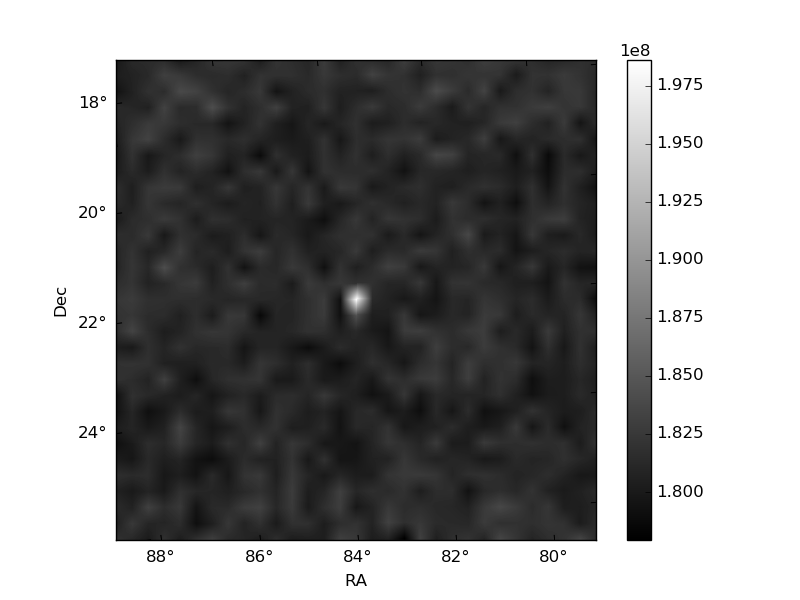
| Plot type | Count rate plots | Images |
|---|---|---|
| Comparison with Poisson distribution Blue bars denote a histogram of data divided into 1 sec bins. Red curve is a Poisson curve with rate = median count rate of data. |
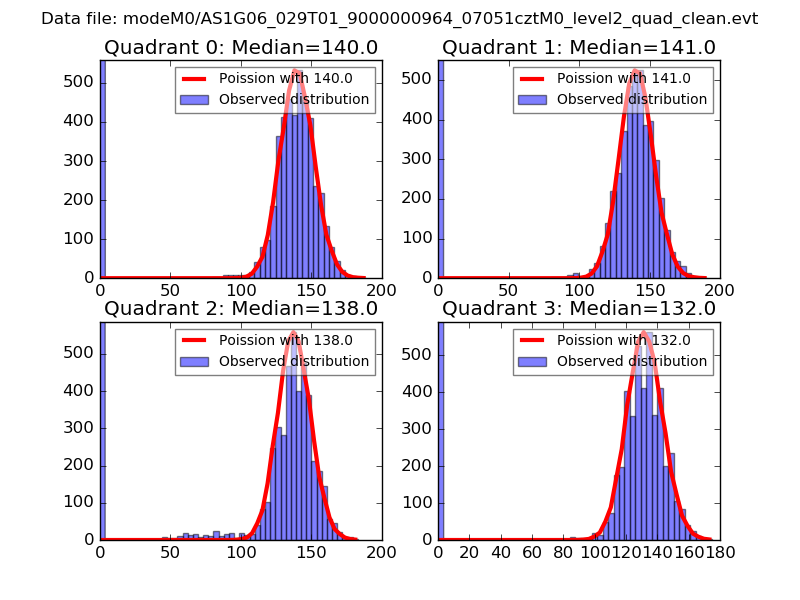 |
 |
| Quadrant-wise count rates Data is divided into 100 sec bins |
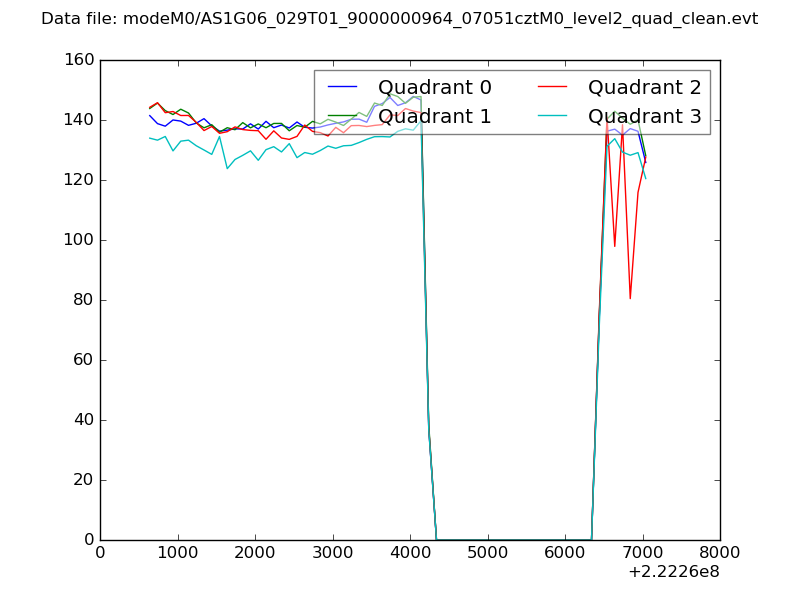 |
|
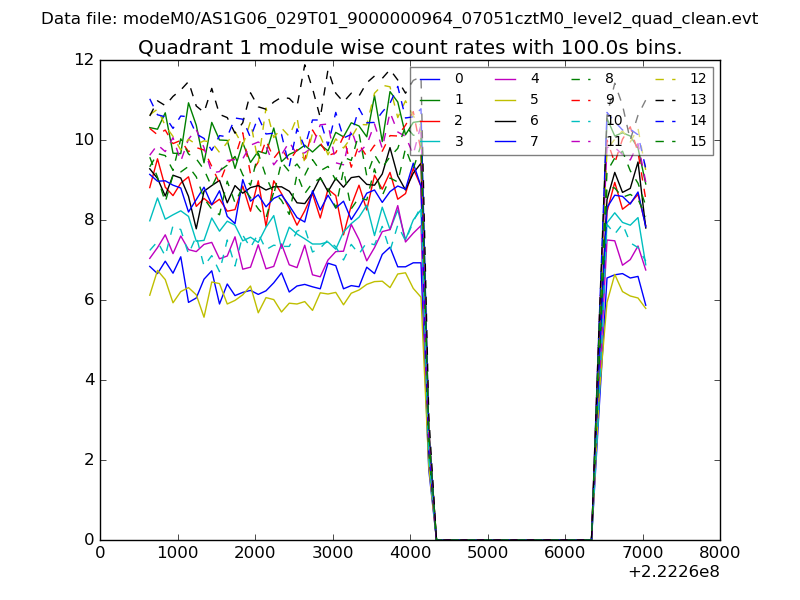
| Module-wise count rates for Quadrant A Data is divided into 100 sec bins |
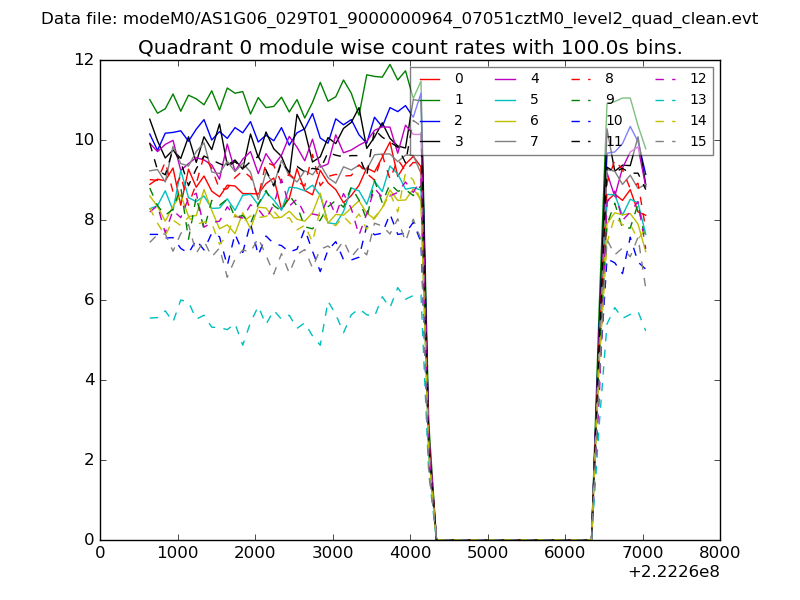 |
 |
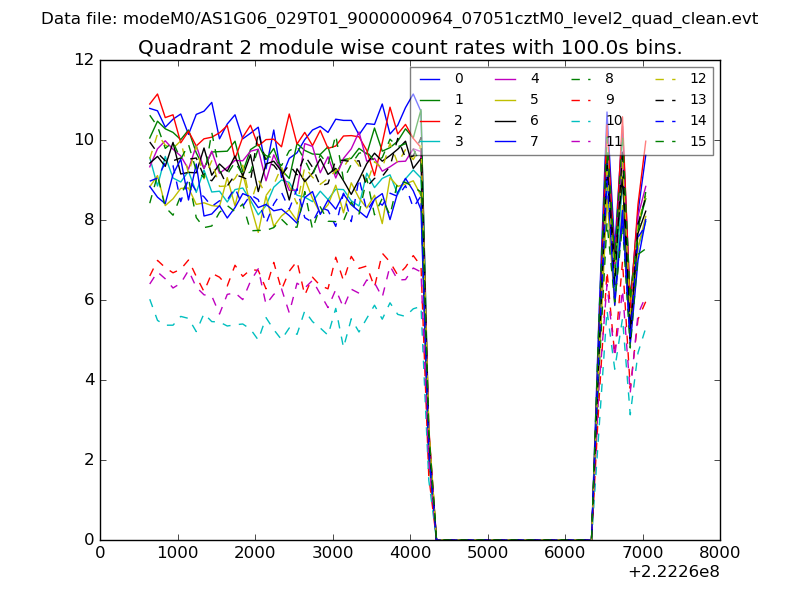
| Module-wise count rates for Quadrant B Data is divided into 100 sec bins |
 |
 |
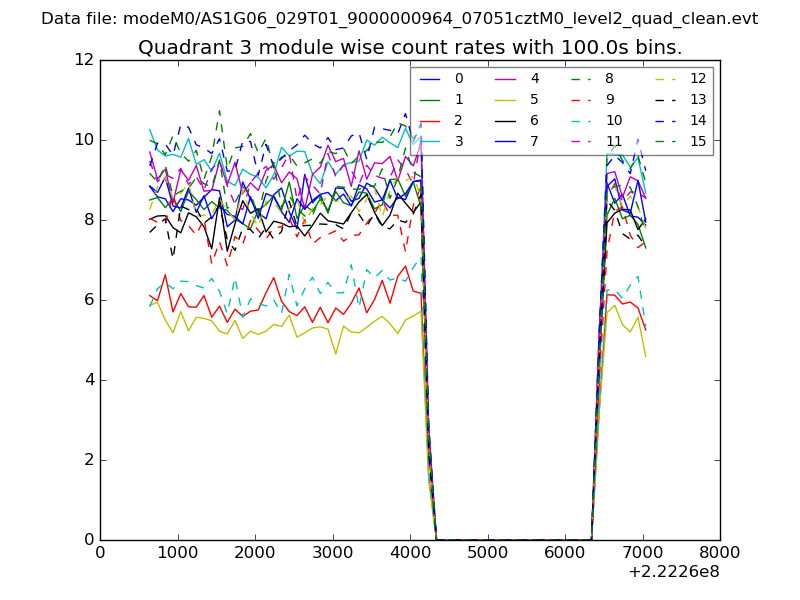
| Module-wise count rates for Quadrant C Data is divided into 100 sec bins |
 |
 |
| Module-wise count rates for Quadrant D Data is divided into 100 sec bins |
 |
 |
| Parameter | Plot |
|---|---|
| CZT HV Monitor | 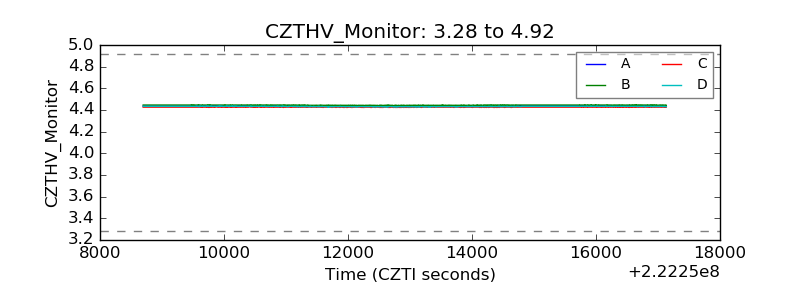 |
| D_VDD | 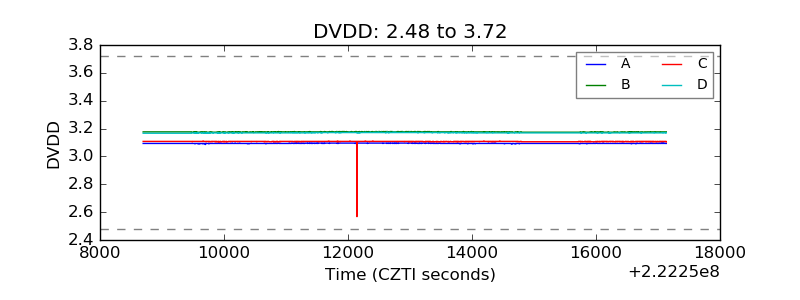 |
| Temperature 1 | 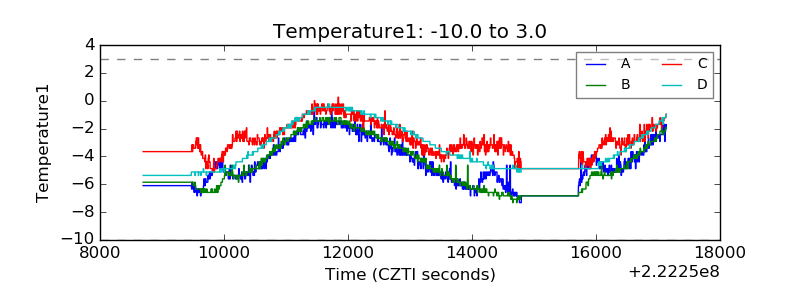 |
| Veto HV Monitor | 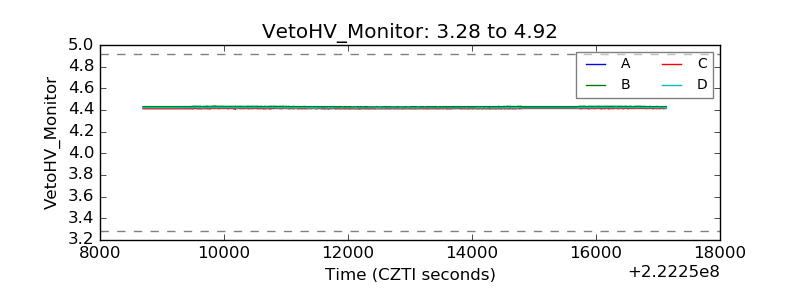 |
| Veto LLD | 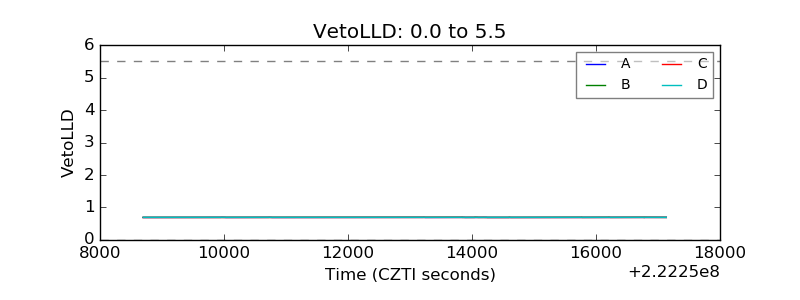 |
| Alpha Counter | 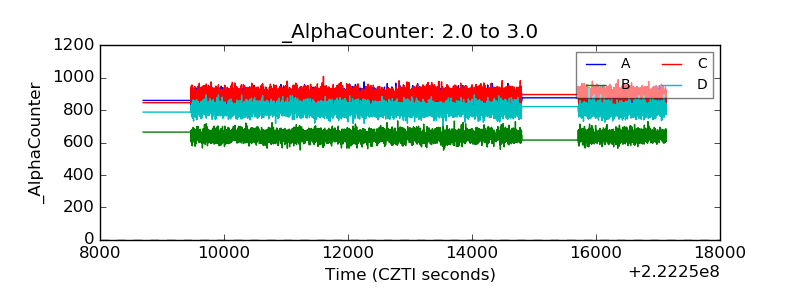 |
| _CPM_Rate | 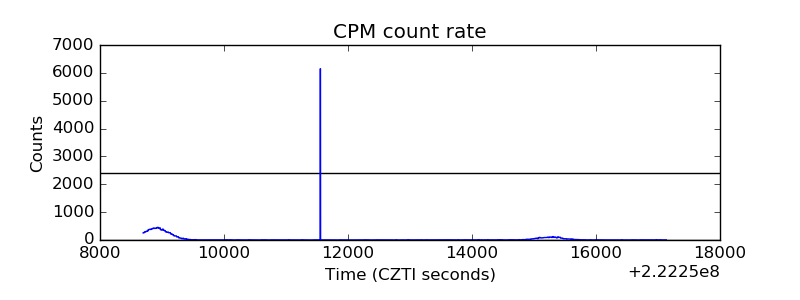 |
| CZT Counter | 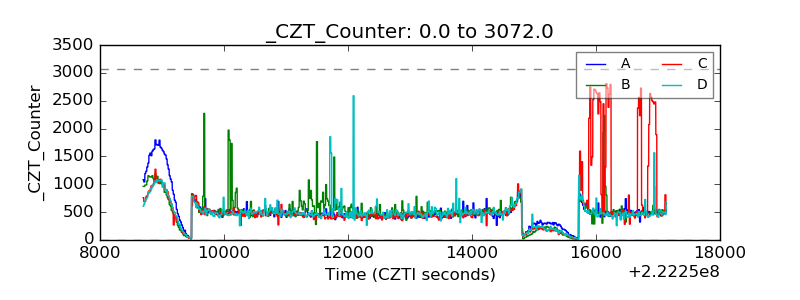 |
| +2.5 Volts monitor |  |
| +5 Volts monitor |  |
| _ROLL_ROT | 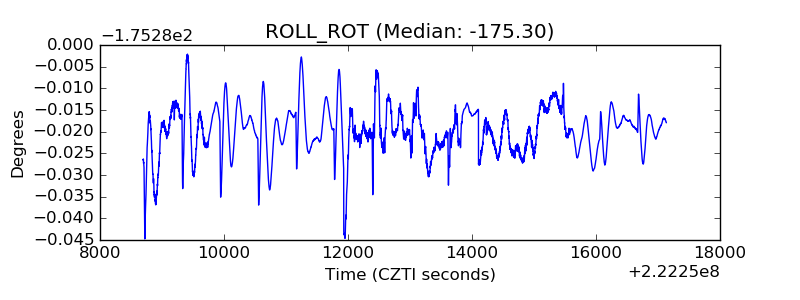 |
| _Roll_DEC | 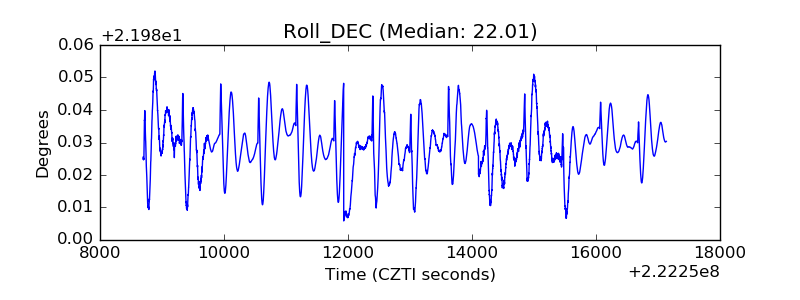 |
| _Roll_RA | 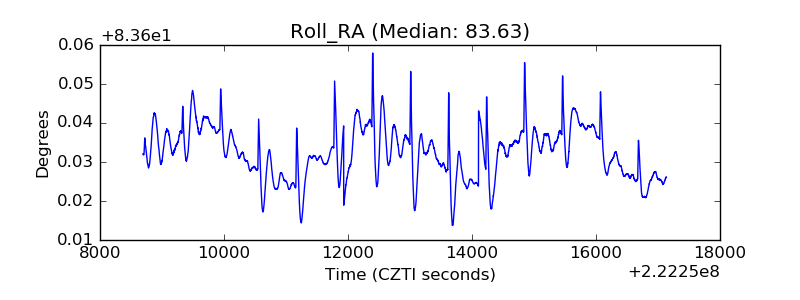 |
| Veto Counter | 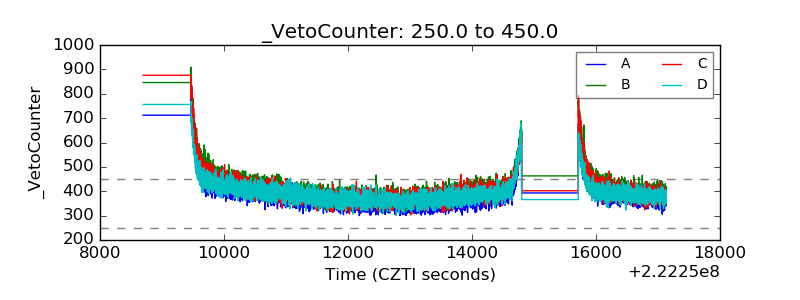 |