| Param | Original file | Final file |
|---|---|---|
| Filename | modeM0/AS1G06_029T01_9000000964_07052cztM0_level2.evt | modeM0/AS1G06_029T01_9000000964_07052cztM0_level2_quad_clean.evt |
| Size (bytes) | 157,936,320 | 24,062,400 |
| Size | 150.6 MB | 22.9 MB |
| Events in quadrant A | 858,396 | 153,134 |
| Events in quadrant B | 1,010,625 | 156,319 |
| Events in quadrant C | 1,924,743 | 141,532 |
| Events in quadrant D | 865,745 | 146,542 |
| Mode M0 | |||
|---|---|---|---|
| Quadrant | BADHDUFLAG | Total packets | Discarded packets |
| A | 0 | 3592 | 0 |
| B | 0 | 4018 | 0 |
| C | 0 | 6880 | 0 |
| D | 0 | 3646 | 0 |
| Mode SS | |||
|---|---|---|---|
| Quadrant | BADHDUFLAG | Total packets | Discarded packets |
| A | 0 | 36 | 0 |
| B | 0 | 36 | 0 |
| C | 0 | 36 | 0 |
| D | 0 | 36 | 0 |
| Quadrant | Total seconds | Saturated seconds | Saturation percentage |
|---|---|---|---|
| A | 1780 | 4 | 0.224719% |
| B | 1780 | 58 | 3.258427% |
| C | 1780 | 469 | 26.348315% |
| D | 1780 | 1 | 0.056180% |
Noise dominated data is calculated using 1-second bins in cleaned event files. If a bin has >2000 counts, and if more than 50% of those come from <1% of pixels, then it is considered to be noise-dominated and hence unusable.
| Quadrant | # 1 sec bins | Bins with >0 counts | Bins with >2000 counts | High rate bins dominated by noise | Noise dominated (total time) | Noise dominated (detector-on time) | Marked lightcurve |
|---|---|---|---|---|---|---|---|
| A | 1780 | 1780 | 0 | 0 | 0.00% | 0.00% |  |
| B | 1780 | 1780 | 28 | 28 | 1.57% | 1.57% | 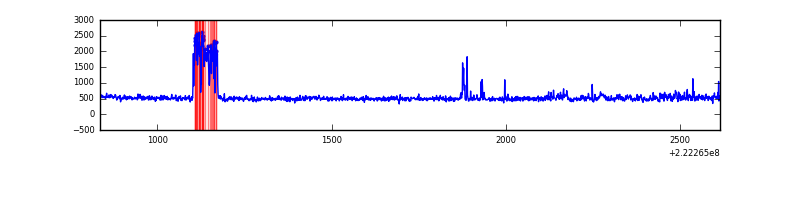 |
| C | 1780 | 1780 | 450 | 450 | 25.28% | 25.28% | 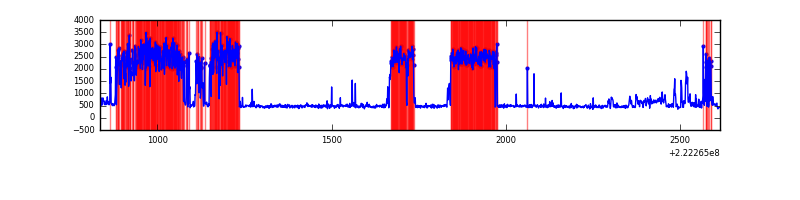 |
| D | 1780 | 1780 | 1 | 1 | 0.06% | 0.06% | 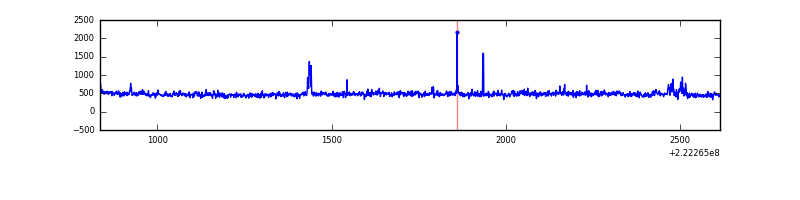 |
Top three noisy pixels from each quadrant. If the there are fewer than three noisy pixels in the level2.evt file, extra rows are filled as -1
| Pixel properties | Quadrant properties | ||||||
|---|---|---|---|---|---|---|---|
| Quadrant | DetID | PixID | Counts | Sigma | Mean | Median | Sigma |
| A | 0 | 226 | 2071 | 39.11 | 222 | 218 | 47.4 |
| A | 12 | 194 | 1987 | 37.33 | 222 | 218 | 47.4 |
| A | 15 | 234 | 1327 | 23.41 | 222 | 218 | 47.4 |
| B | 4 | 81 | 120601 | 2695.8 | 220 | 215 | 44.7 |
| B | 0 | 214 | 29792 | 662.32 | 220 | 215 | 44.7 |
| B | 12 | 111 | 4294 | 91.34 | 220 | 215 | 44.7 |
| C | 9 | 68 | 1204417 | 26779.18 | 184 | 185 | 45.0 |
| C | 12 | 4 | 1719 | 34.11 | 184 | 185 | 45.0 |
| C | 13 | 61 | 1382 | 26.62 | 184 | 185 | 45.0 |
| D | 8 | 195 | 33864 | 618.31 | 213 | 206 | 54.4 |
| D | 14 | 34 | 8214 | 147.1 | 213 | 206 | 54.4 |
| D | 2 | 14 | 7680 | 137.29 | 213 | 206 | 54.4 |
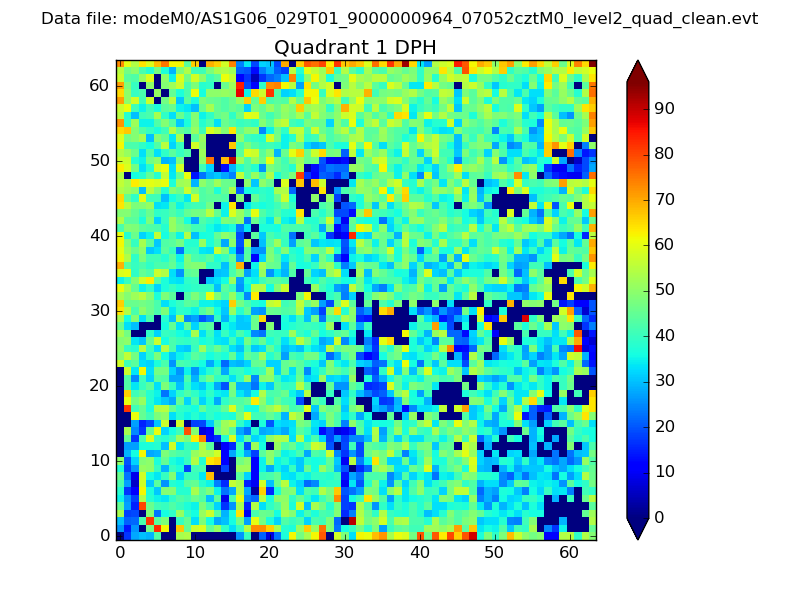
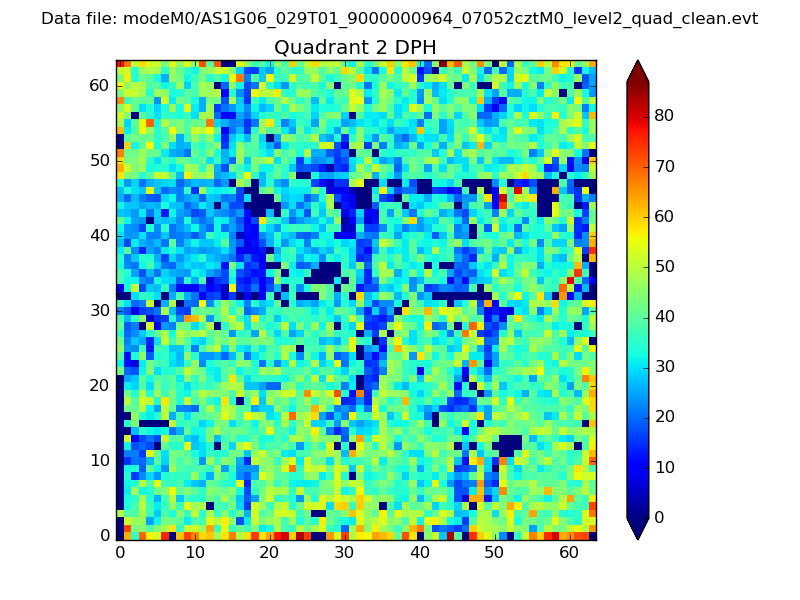
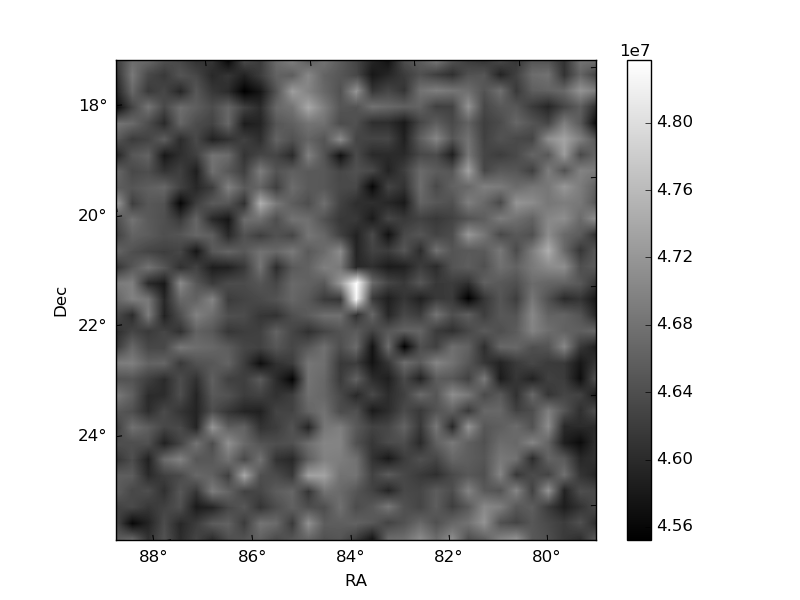
Histogram calculated using DETX and DETY for each event in the final _common_clean file
| Quadrant A | 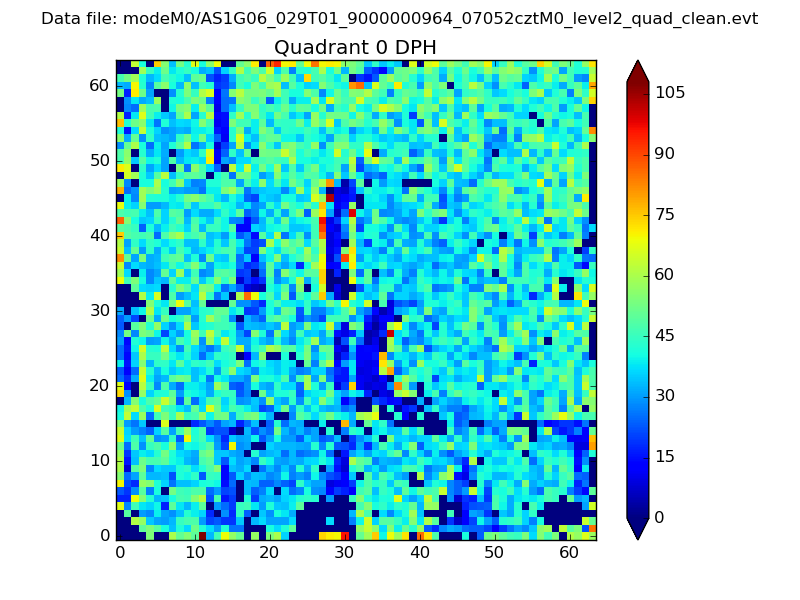 |
 |
Quadrant B |
|---|---|---|---|
| Quadrant D | 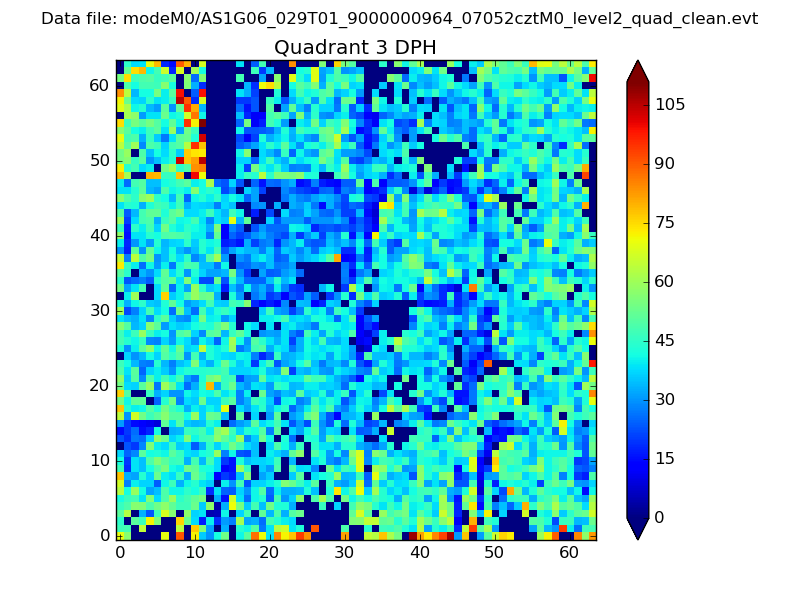 |
 |
Quadrant C |
| Plot type | Count rate plots | Images |
|---|---|---|
| Comparison with Poisson distribution Blue bars denote a histogram of data divided into 1 sec bins. Red curve is a Poisson curve with rate = median count rate of data. |
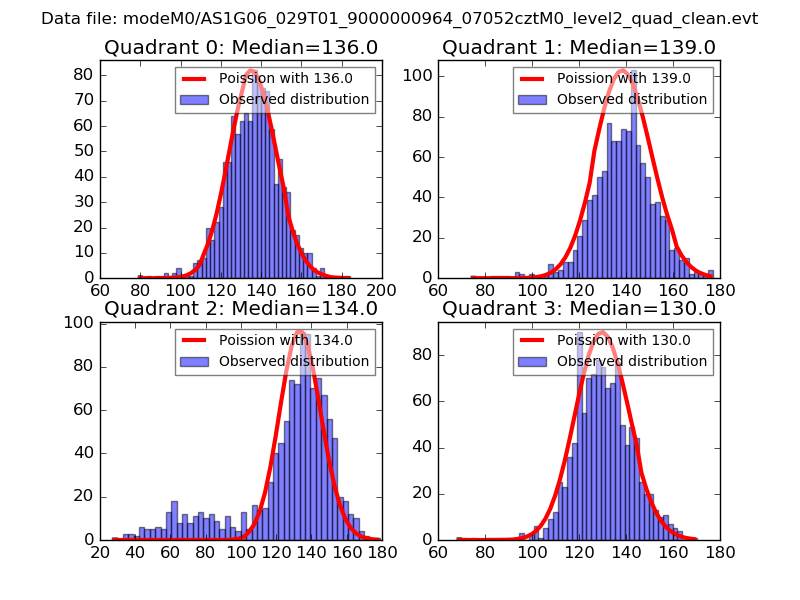 |
 |
| Quadrant-wise count rates Data is divided into 100 sec bins |
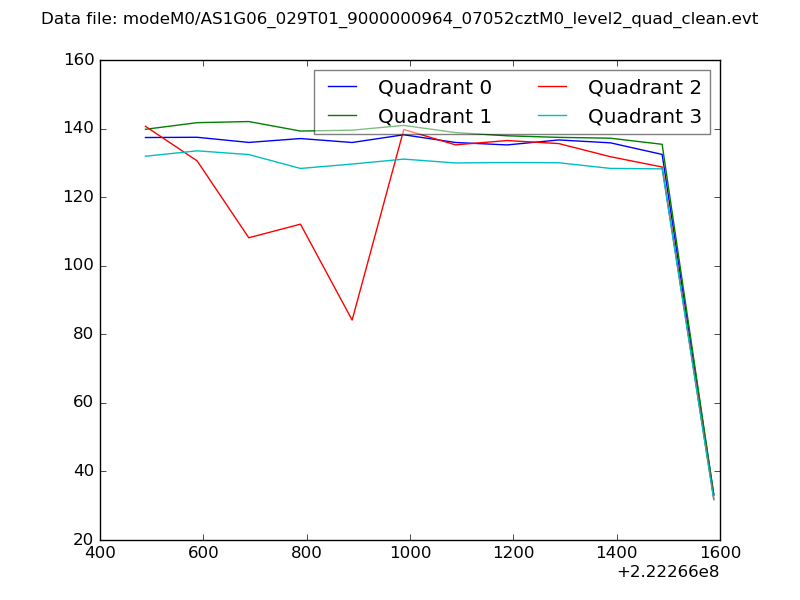 |
|
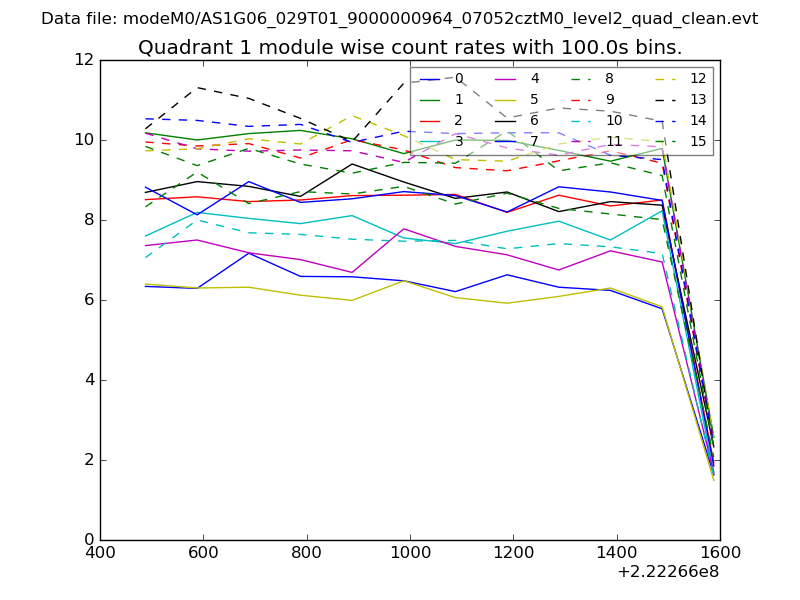
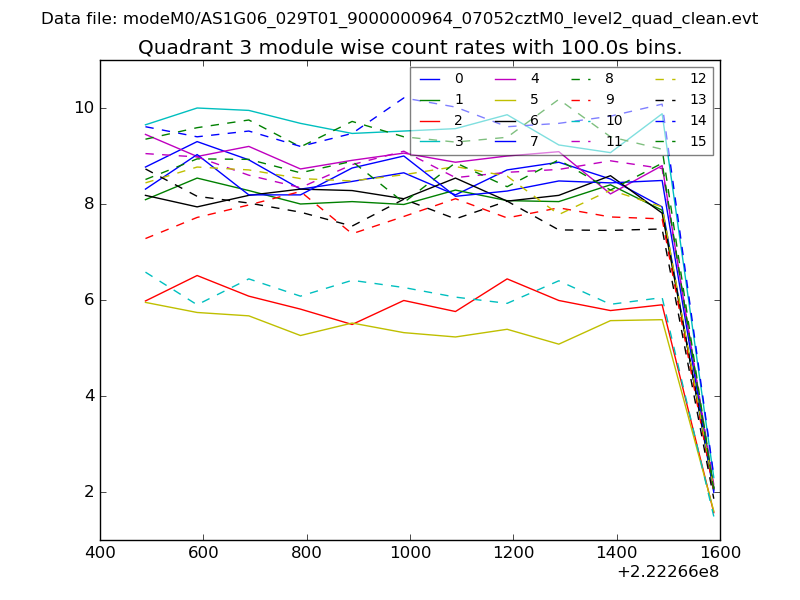
| Module-wise count rates for Quadrant A Data is divided into 100 sec bins |
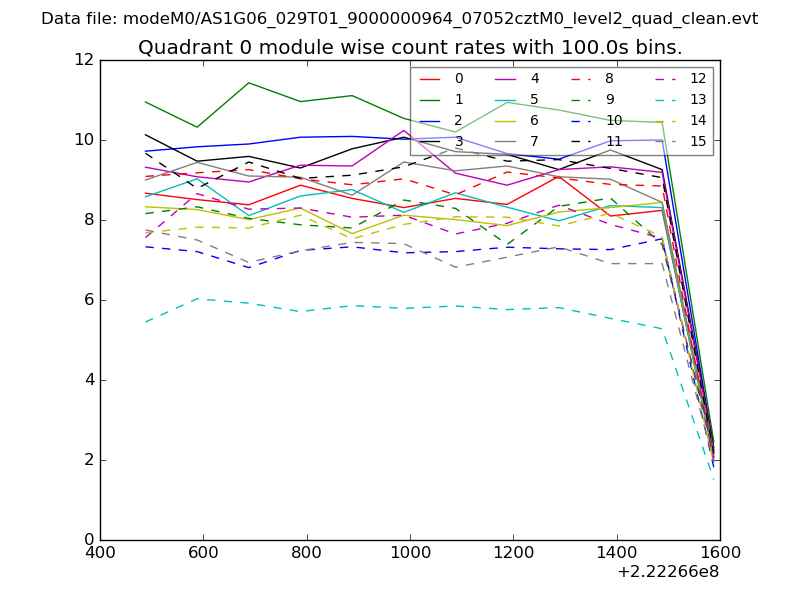 |
 |
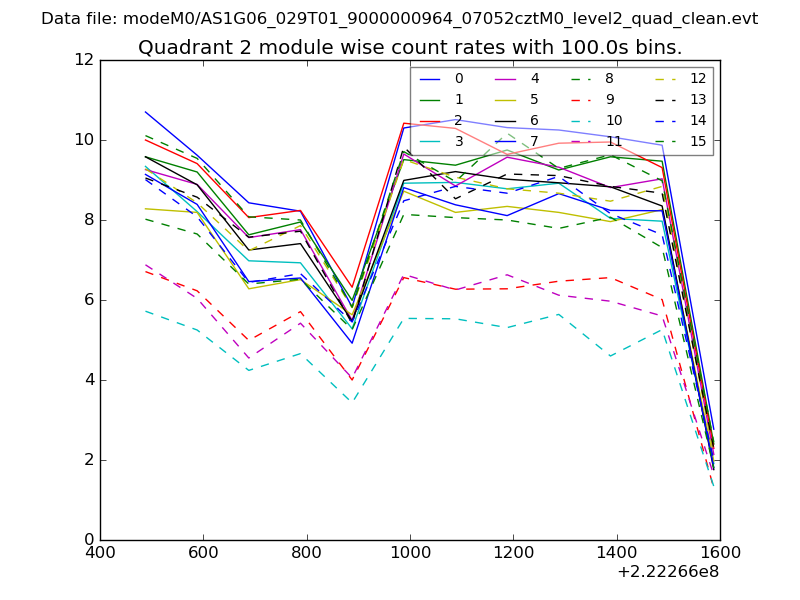
| Module-wise count rates for Quadrant B Data is divided into 100 sec bins |
 |
 |
| Module-wise count rates for Quadrant C Data is divided into 100 sec bins |
 |
 |
| Module-wise count rates for Quadrant D Data is divided into 100 sec bins |
 |
 |
| Parameter | Plot |
|---|---|
| CZT HV Monitor | 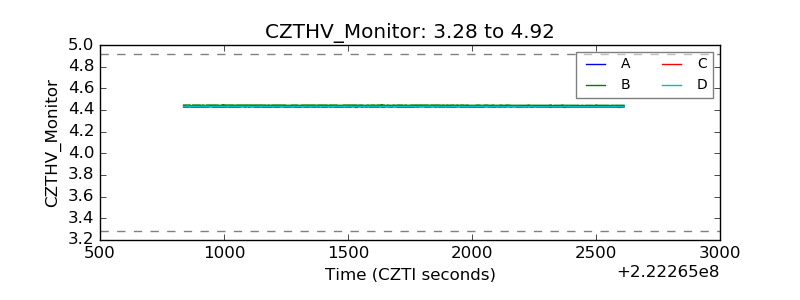 |
| D_VDD | 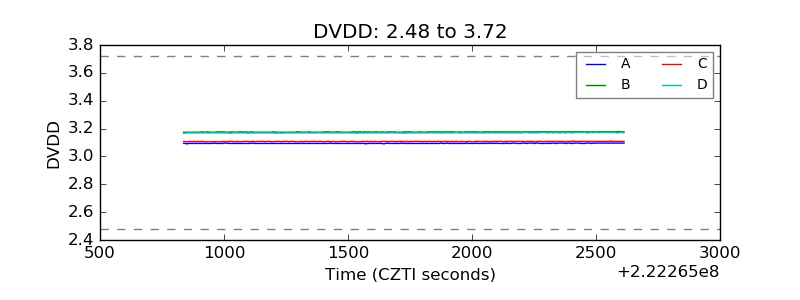 |
| Temperature 1 | 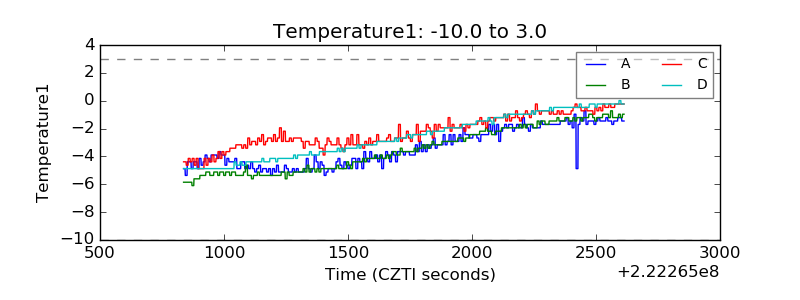 |
| Veto HV Monitor | 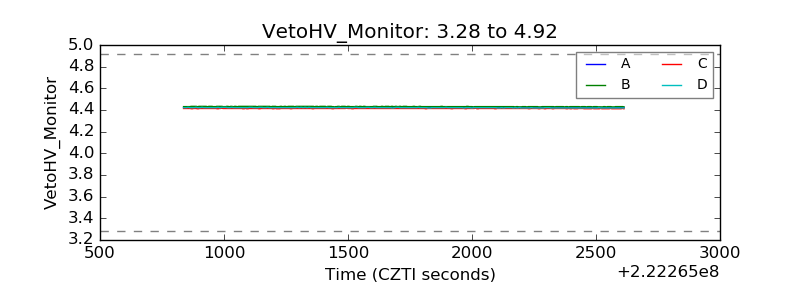 |
| Veto LLD | 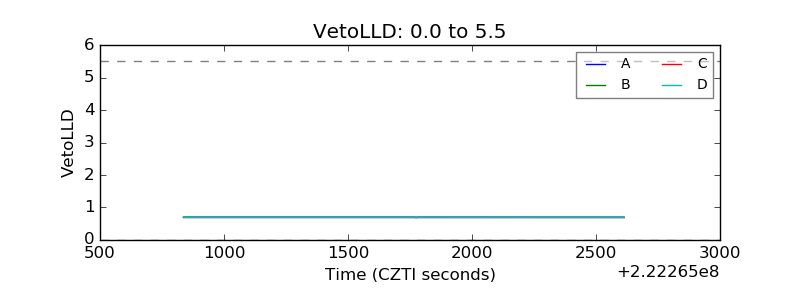 |
| Alpha Counter | 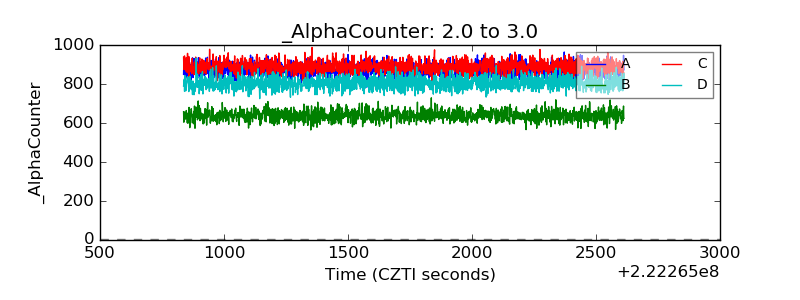 |
| _CPM_Rate | 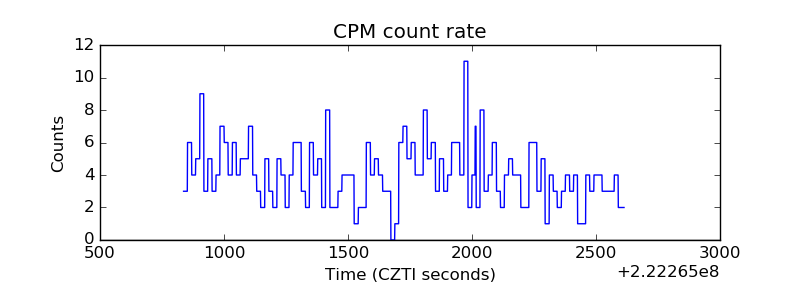 |
| CZT Counter | 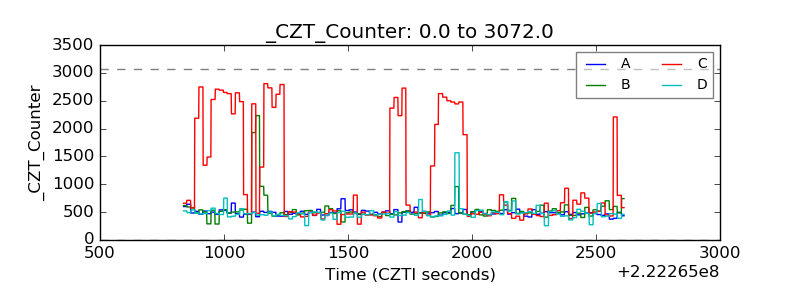 |
| +2.5 Volts monitor |  |
| +5 Volts monitor |  |
| _ROLL_ROT | 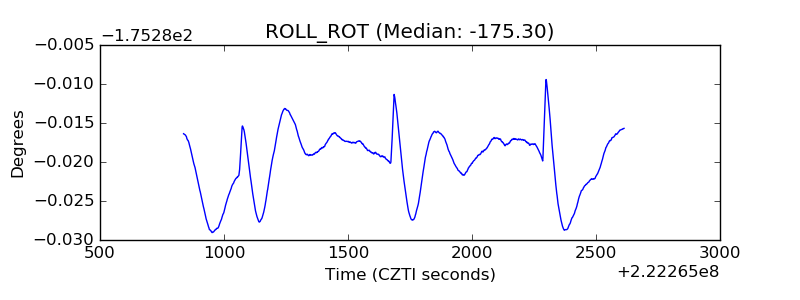 |
| _Roll_DEC | 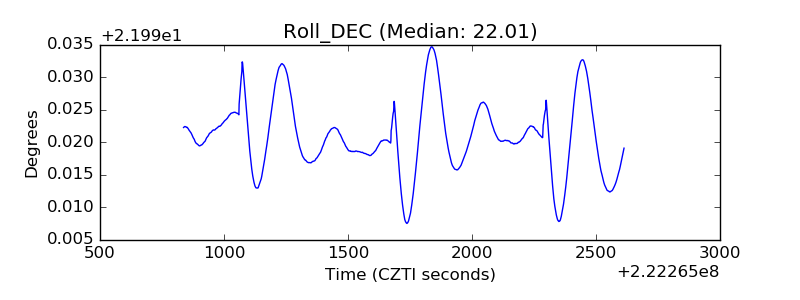 |
| _Roll_RA | 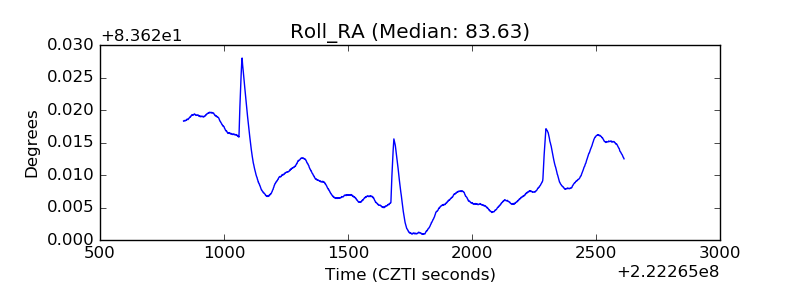 |
| Veto Counter | 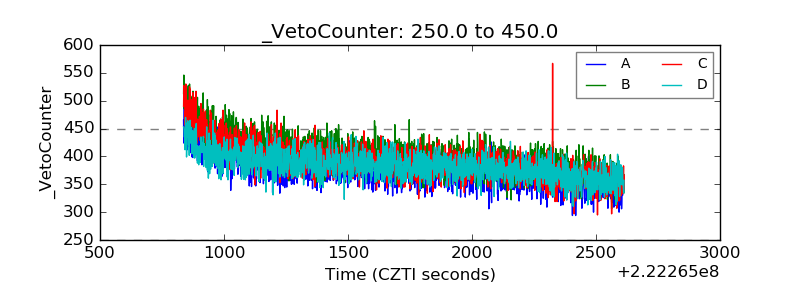 |