| Param | Original file | Final file |
|---|---|---|
| Filename | modeM0/AS1A02_155T01_9000000966_07052cztM0_level2.evt | modeM0/AS1A02_155T01_9000000966_07052cztM0_level2_quad_clean.evt |
| Size (bytes) | 280,267,200 | 48,568,320 |
| Size | 267.3 MB | 46.3 MB |
| Events in quadrant A | 1,806,069 | 305,186 |
| Events in quadrant B | 1,933,857 | 308,326 |
| Events in quadrant C | 2,322,134 | 296,390 |
| Events in quadrant D | 2,166,167 | 291,803 |
| Mode M0 | |||
|---|---|---|---|
| Quadrant | BADHDUFLAG | Total packets | Discarded packets |
| A | 0 | 7935 | 2 |
| B | 0 | 8188 | 1 |
| C | 0 | 9530 | 1 |
| D | 0 | 8917 | 1 |
| Mode M9 | |||
|---|---|---|---|
| Quadrant | BADHDUFLAG | Total packets | Discarded packets |
| A | 0 | 5 | 0 |
| B | 0 | 5 | 0 |
| C | 0 | 5 | 0 |
| D | 0 | 5 | 0 |
| Mode SS | |||
|---|---|---|---|
| Quadrant | BADHDUFLAG | Total packets | Discarded packets |
| A | 0 | 80 | 0 |
| B | 0 | 80 | 0 |
| C | 0 | 80 | 0 |
| D | 0 | 80 | 0 |
| Quadrant | Total seconds | Saturated seconds | Saturation percentage |
|---|---|---|---|
| A | 3794 | 104 | 2.741170% |
| B | 3794 | 98 | 2.583026% |
| C | 3794 | 242 | 6.378492% |
| D | 3794 | 132 | 3.479178% |
Noise dominated data is calculated using 1-second bins in cleaned event files. If a bin has >2000 counts, and if more than 50% of those come from <1% of pixels, then it is considered to be noise-dominated and hence unusable.
| Quadrant | # 1 sec bins | Bins with >0 counts | Bins with >2000 counts | High rate bins dominated by noise | Noise dominated (total time) | Noise dominated (detector-on time) | Marked lightcurve |
|---|---|---|---|---|---|---|---|
| A | 4334 | 3795 | 0 | 0 | 0.00% | 0.00% | 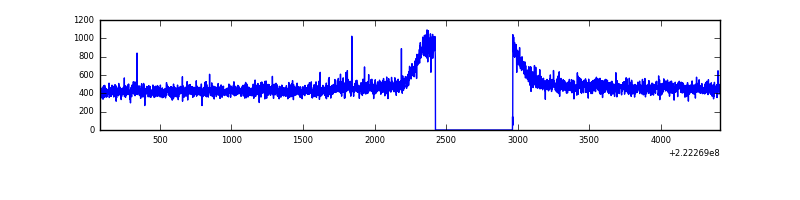 |
| B | 4334 | 3795 | 0 | 0 | 0.00% | 0.00% | 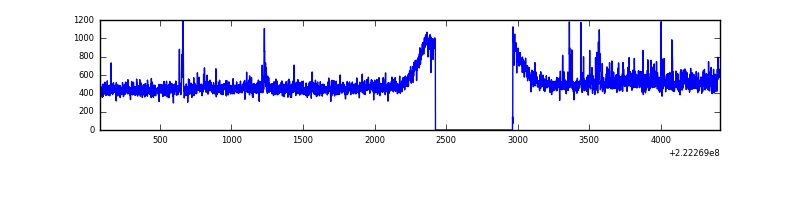 |
| C | 4334 | 3795 | 50 | 50 | 1.15% | 1.32% | 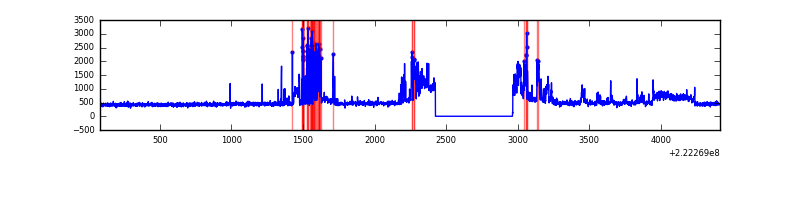 |
| D | 4334 | 3795 | 53 | 53 | 1.22% | 1.40% | 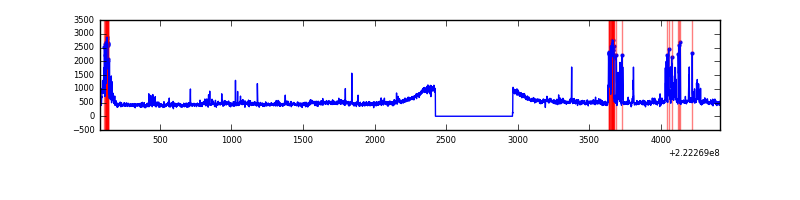 |
Top three noisy pixels from each quadrant. If the there are fewer than three noisy pixels in the level2.evt file, extra rows are filled as -1
| Pixel properties | Quadrant properties | ||||||
|---|---|---|---|---|---|---|---|
| Quadrant | DetID | PixID | Counts | Sigma | Mean | Median | Sigma |
| A | 0 | 226 | 4500 | 41.19 | 468 | 455 | 98.2 |
| A | 12 | 194 | 4177 | 37.9 | 468 | 455 | 98.2 |
| A | 8 | 15 | 1986 | 15.59 | 468 | 455 | 98.2 |
| B | 0 | 214 | 63416 | 674.93 | 473 | 461 | 93.3 |
| B | 10 | 246 | 24197 | 254.47 | 473 | 461 | 93.3 |
| B | 12 | 111 | 9377 | 95.59 | 473 | 461 | 93.3 |
| C | 9 | 68 | 560581 | 5211.04 | 450 | 453 | 107.5 |
| C | 13 | 61 | 3499 | 28.34 | 450 | 453 | 107.5 |
| C | 8 | 222 | 2455 | 18.63 | 450 | 453 | 107.5 |
| D | 12 | 233 | 257972 | 2273.7 | 456 | 441 | 113.3 |
| D | 8 | 195 | 150860 | 1328.02 | 456 | 441 | 113.3 |
| D | 2 | 14 | 20139 | 173.91 | 456 | 441 | 113.3 |
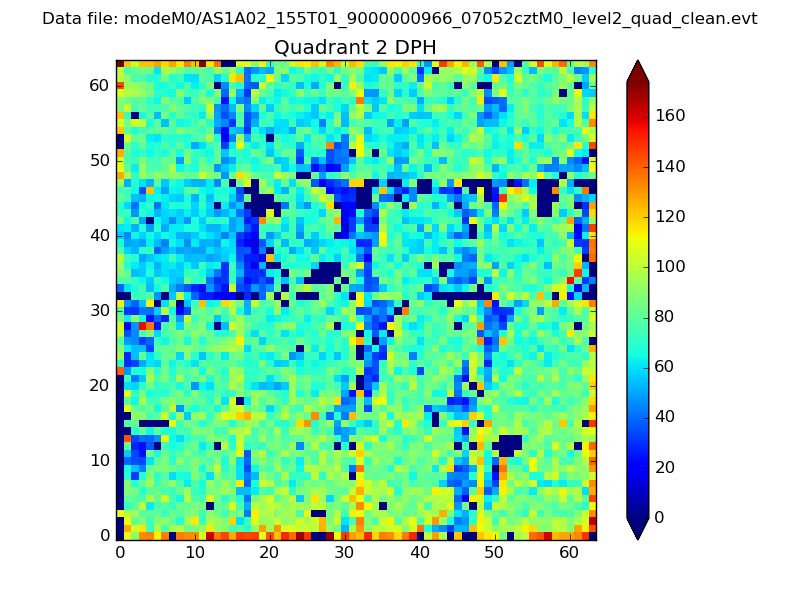
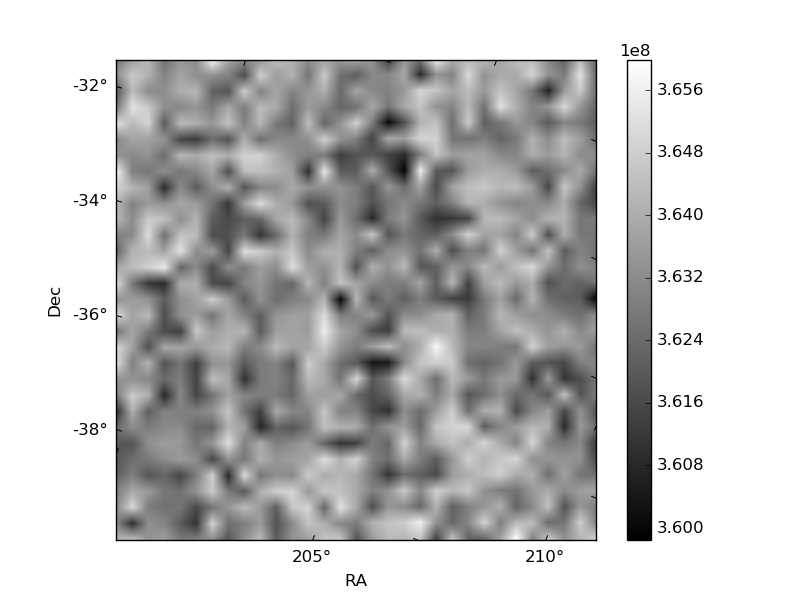
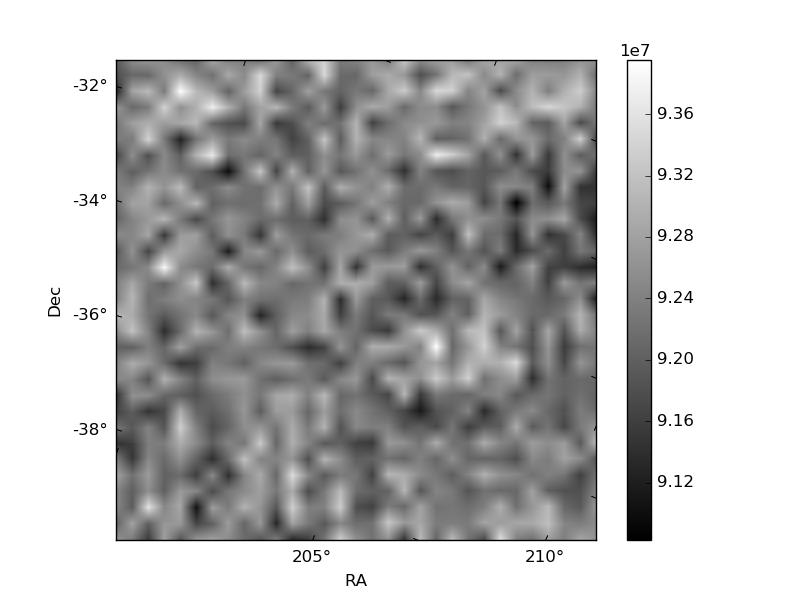
Histogram calculated using DETX and DETY for each event in the final _common_clean file
| Quadrant A | 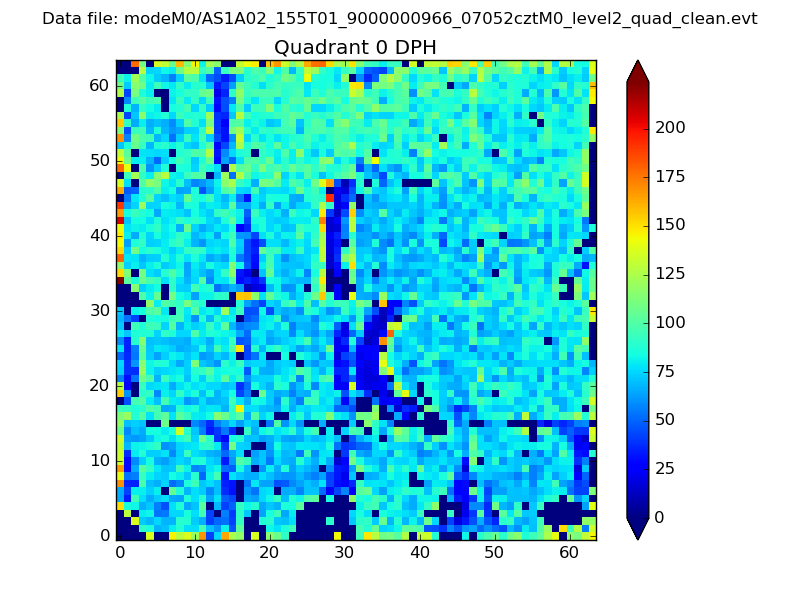 |
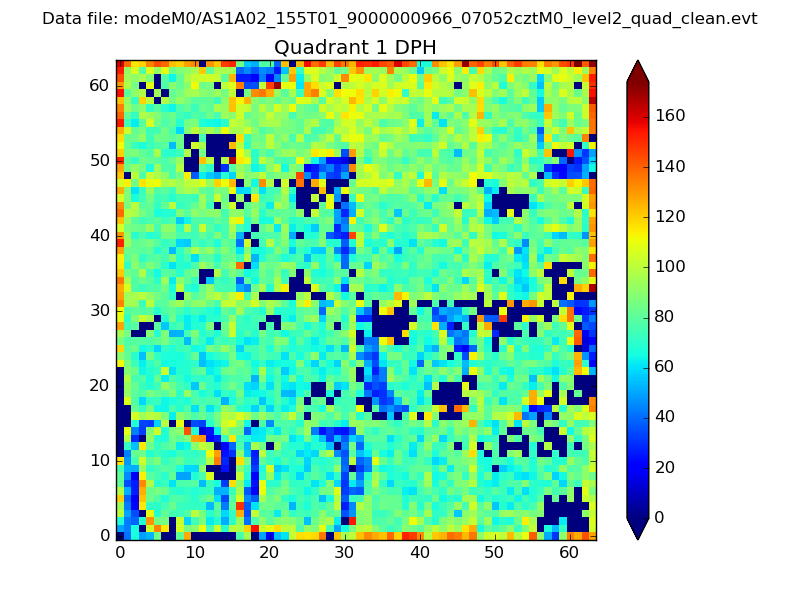 |
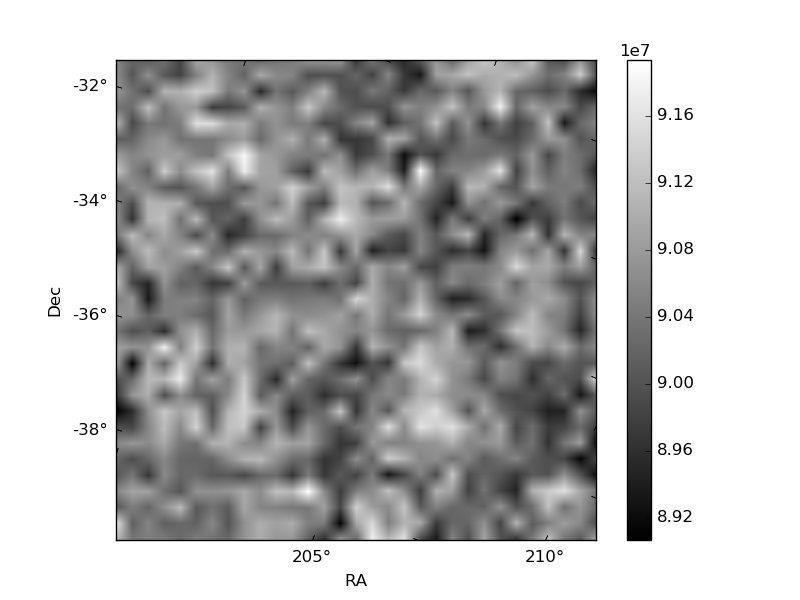
Quadrant B |
|---|---|---|---|
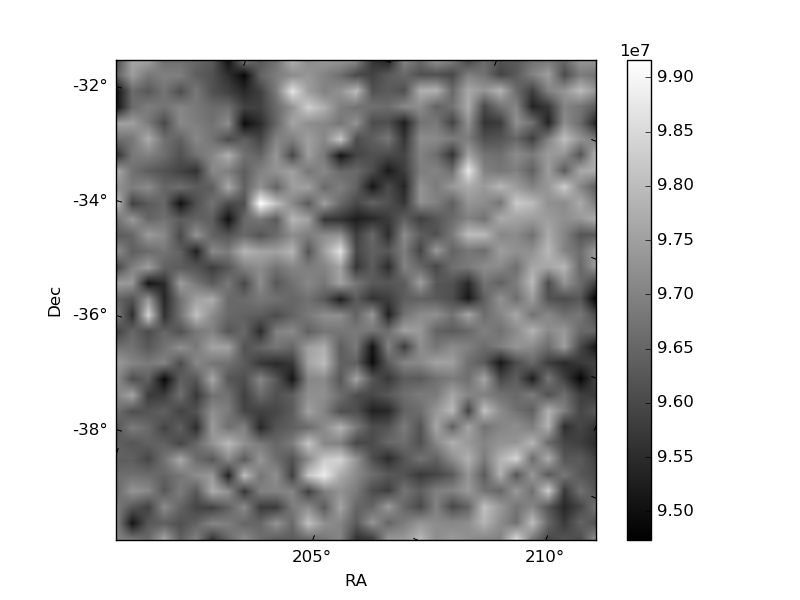
| Quadrant D | 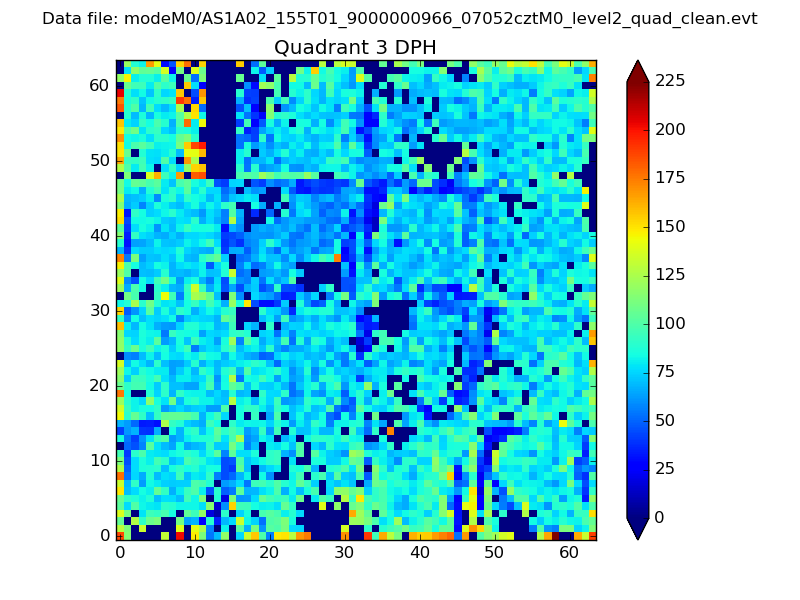 |
 |
Quadrant C |
| Plot type | Count rate plots | Images |
|---|---|---|
| Comparison with Poisson distribution Blue bars denote a histogram of data divided into 1 sec bins. Red curve is a Poisson curve with rate = median count rate of data. |
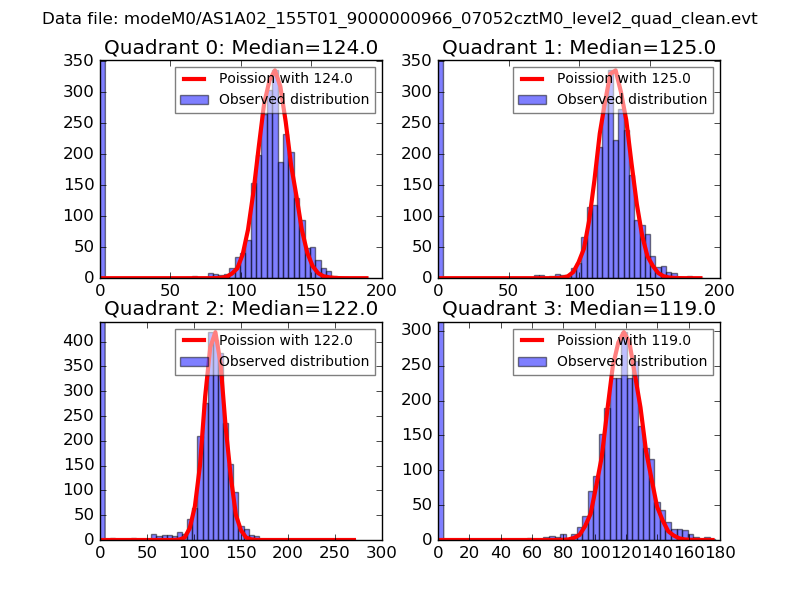 |
 |
| Quadrant-wise count rates Data is divided into 100 sec bins |
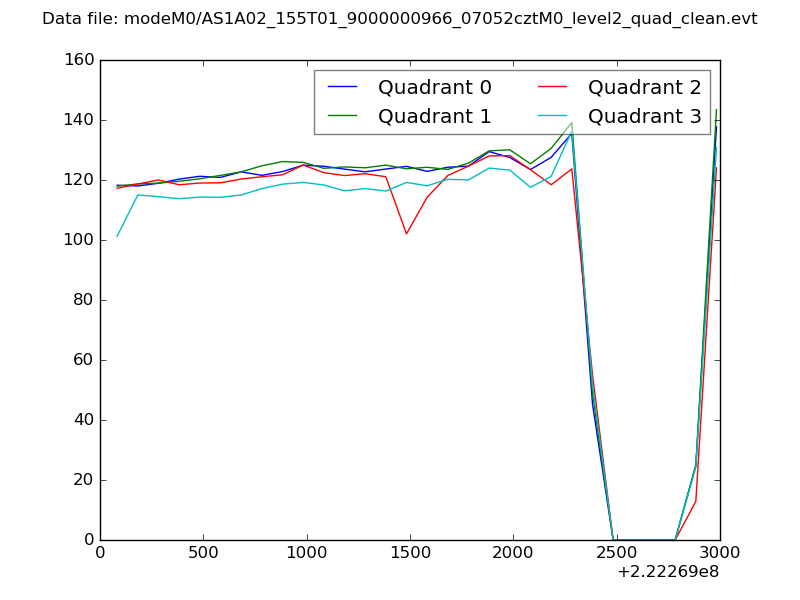 |
|
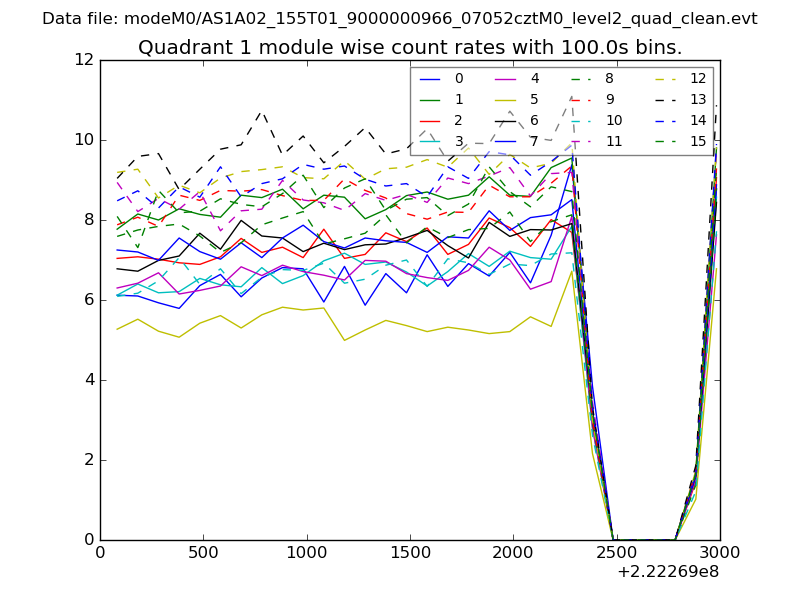
| Module-wise count rates for Quadrant A Data is divided into 100 sec bins |
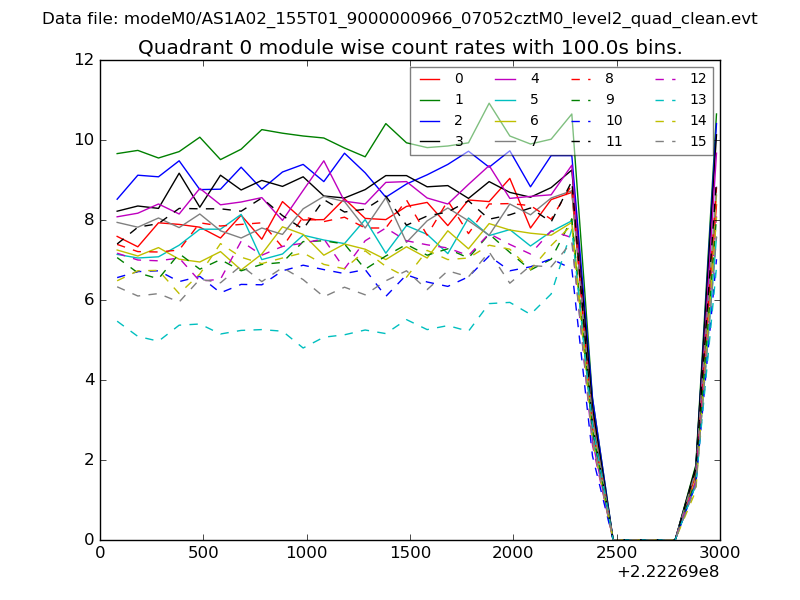 |
 |
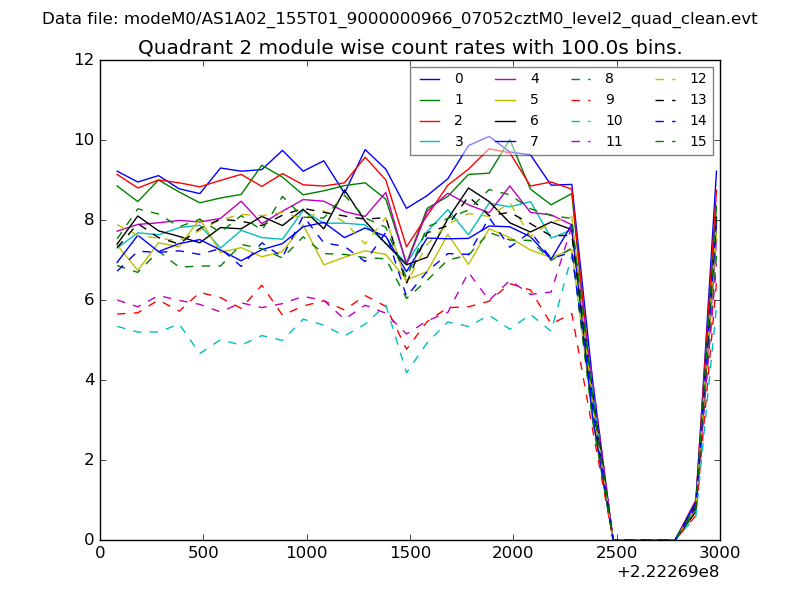
| Module-wise count rates for Quadrant B Data is divided into 100 sec bins |
 |
 |
| Module-wise count rates for Quadrant C Data is divided into 100 sec bins |
 |
 |
| Module-wise count rates for Quadrant D Data is divided into 100 sec bins |
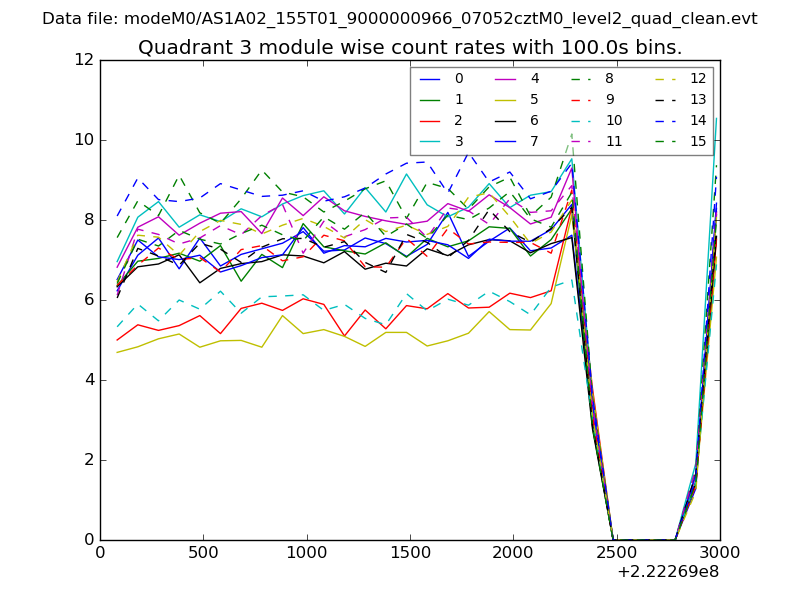 |
 |
| Parameter | Plot |
|---|---|
| CZT HV Monitor | 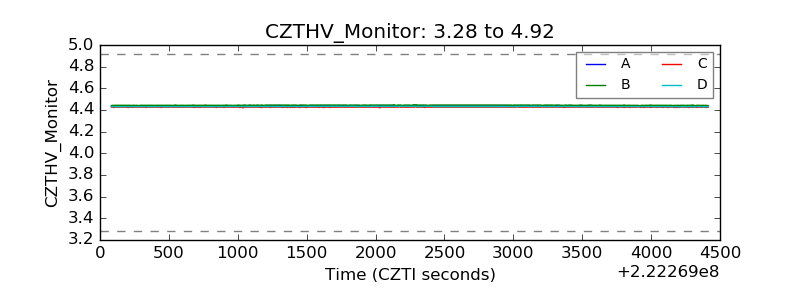 |
| D_VDD | 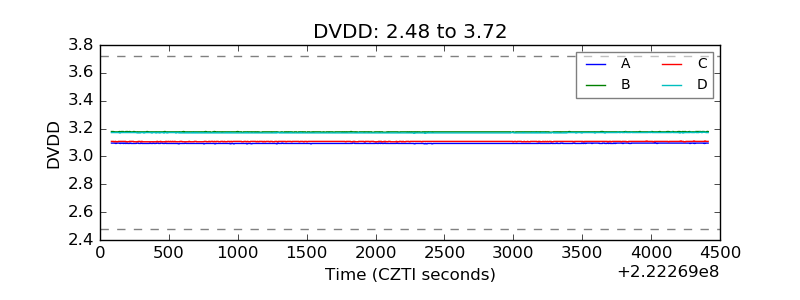 |
| Temperature 1 |  |
| Veto HV Monitor | 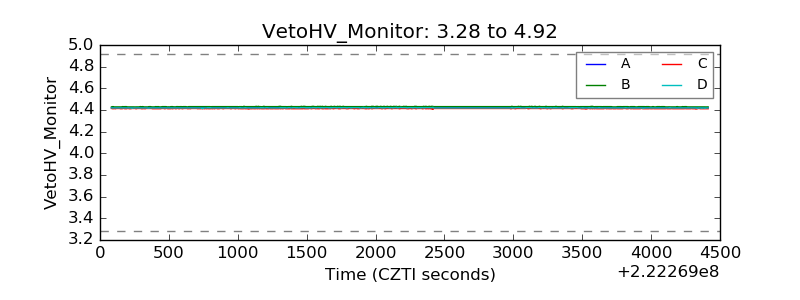 |
| Veto LLD | 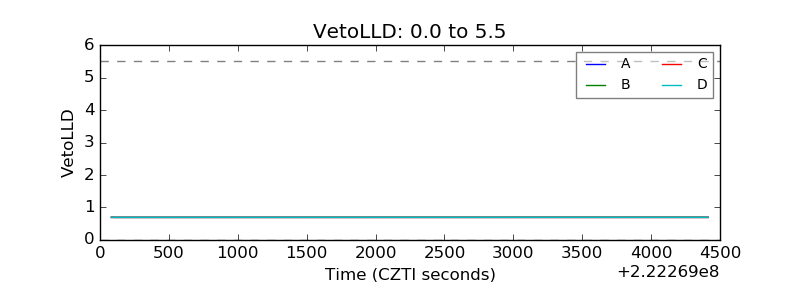 |
| Alpha Counter |  |
| _CPM_Rate | 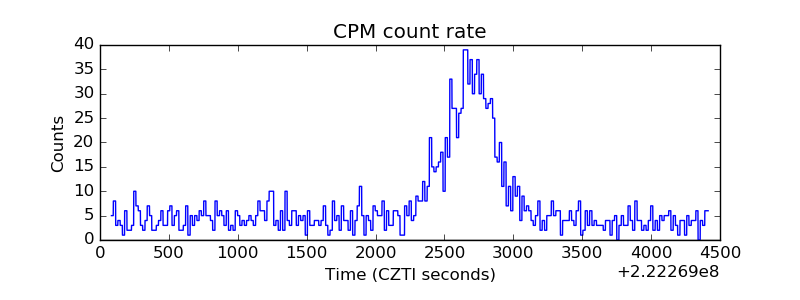 |
| CZT Counter |  |
| +2.5 Volts monitor |  |
| +5 Volts monitor |  |
| _ROLL_ROT | 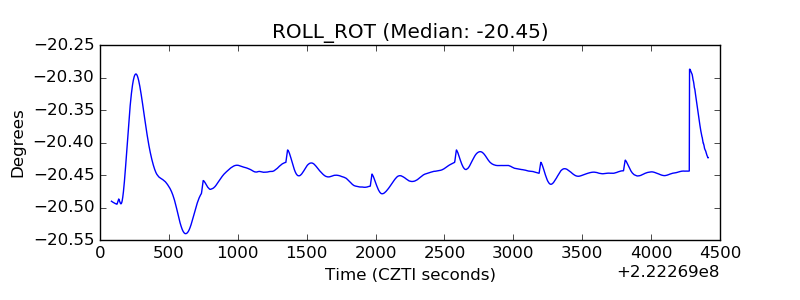 |
| _Roll_DEC | 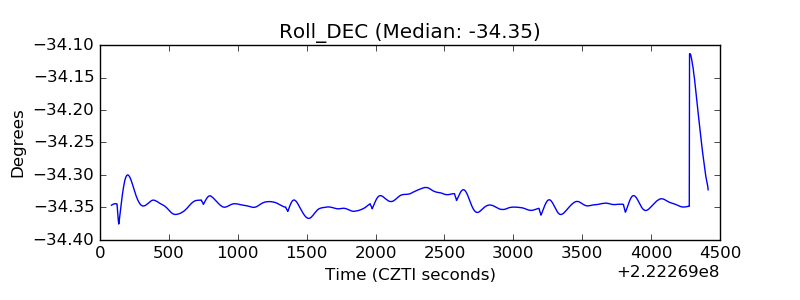 |
| _Roll_RA | 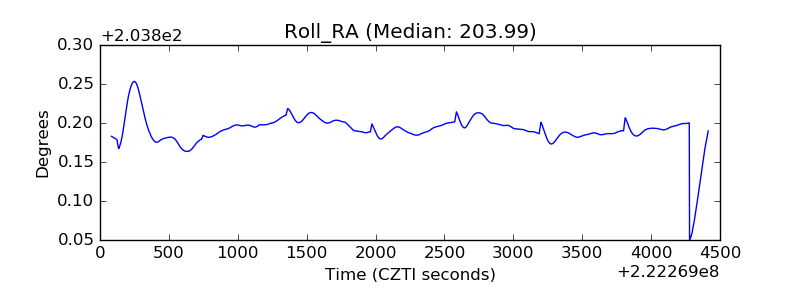 |
| Veto Counter | 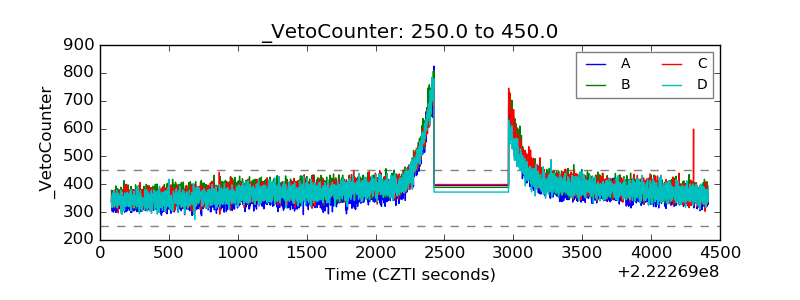 |