| Param | Original file | Final file |
|---|---|---|
| Filename | modeM0/AS1A02_155T01_9000000966_07053cztM0_level2.evt | modeM0/AS1A02_155T01_9000000966_07053cztM0_level2_quad_clean.evt |
| Size (bytes) | 547,303,680 | 78,255,360 |
| Size | 521.9 MB | 74.6 MB |
| Events in quadrant A | 3,665,378 | 459,309 |
| Events in quadrant B | 4,109,878 | 465,932 |
| Events in quadrant C | 3,923,975 | 457,102 |
| Events in quadrant D | 4,343,229 | 441,589 |
| Mode M0 | |||
|---|---|---|---|
| Quadrant | BADHDUFLAG | Total packets | Discarded packets |
| A | 0 | 16314 | 3 |
| B | 0 | 17386 | 2 |
| C | 0 | 17097 | 2 |
| D | 0 | 17759 | 2 |
| Mode M9 | |||
|---|---|---|---|
| Quadrant | BADHDUFLAG | Total packets | Discarded packets |
| A | 0 | 7 | 0 |
| B | 0 | 7 | 0 |
| C | 0 | 7 | 0 |
| D | 0 | 7 | 0 |
| Mode SS | |||
|---|---|---|---|
| Quadrant | BADHDUFLAG | Total packets | Discarded packets |
| A | 0 | 164 | 0 |
| B | 0 | 164 | 0 |
| C | 0 | 164 | 0 |
| D | 0 | 164 | 0 |
| Quadrant | Total seconds | Saturated seconds | Saturation percentage |
|---|---|---|---|
| A | 7833 | 203 | 2.591600% |
| B | 7833 | 220 | 2.808630% |
| C | 7833 | 201 | 2.566067% |
| D | 7833 | 232 | 2.961828% |
Noise dominated data is calculated using 1-second bins in cleaned event files. If a bin has >2000 counts, and if more than 50% of those come from <1% of pixels, then it is considered to be noise-dominated and hence unusable.
| Quadrant | # 1 sec bins | Bins with >0 counts | Bins with >2000 counts | High rate bins dominated by noise | Noise dominated (total time) | Noise dominated (detector-on time) | Marked lightcurve |
|---|---|---|---|---|---|---|---|
| A | 8658 | 7835 | 0 | 0 | 0.00% | 0.00% | 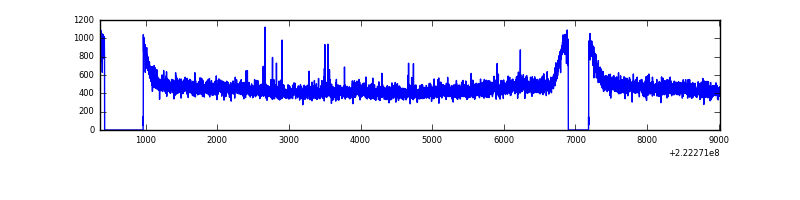 |
| B | 8658 | 7835 | 3 | 3 | 0.03% | 0.04% | 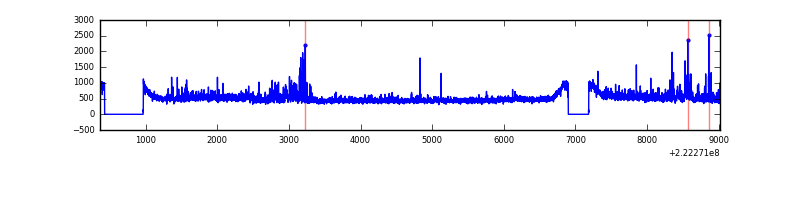 |
| C | 8658 | 7835 | 7 | 7 | 0.08% | 0.09% | 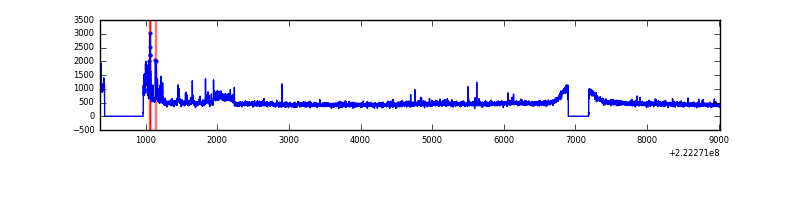 |
| D | 8658 | 7835 | 79 | 79 | 0.91% | 1.01% | 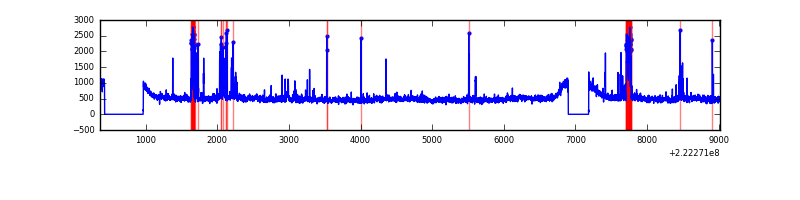 |
Top three noisy pixels from each quadrant. If the there are fewer than three noisy pixels in the level2.evt file, extra rows are filled as -1
| Pixel properties | Quadrant properties | ||||||
|---|---|---|---|---|---|---|---|
| Quadrant | DetID | PixID | Counts | Sigma | Mean | Median | Sigma |
| A | 0 | 226 | 9027 | 41.43 | 947 | 926 | 195.5 |
| A | 12 | 194 | 8548 | 38.98 | 947 | 926 | 195.5 |
| A | 8 | 15 | 5873 | 25.3 | 947 | 926 | 195.5 |
| B | 4 | 239 | 193722 | 1039.6 | 952 | 927 | 185.5 |
| B | 0 | 214 | 167869 | 900.2 | 952 | 927 | 185.5 |
| B | 10 | 246 | 29212 | 152.52 | 952 | 927 | 185.5 |
| C | 9 | 68 | 328989 | 1525.88 | 919 | 924 | 215.0 |
| C | 13 | 61 | 7248 | 29.41 | 919 | 924 | 215.0 |
| C | 8 | 222 | 5070 | 19.28 | 919 | 924 | 215.0 |
| D | 8 | 195 | 450074 | 1974.75 | 921 | 891 | 227.5 |
| D | 12 | 233 | 206207 | 902.63 | 921 | 891 | 227.5 |
| D | 1 | 18 | 112353 | 490.02 | 921 | 891 | 227.5 |
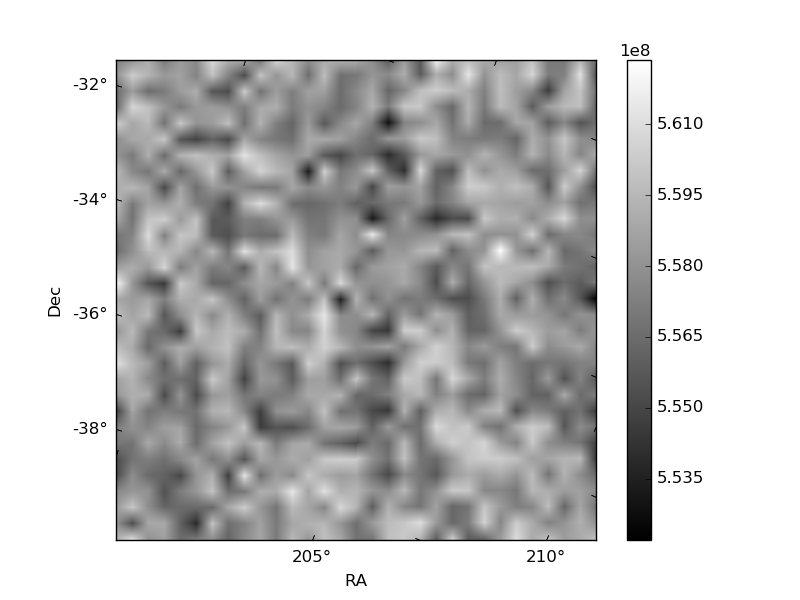
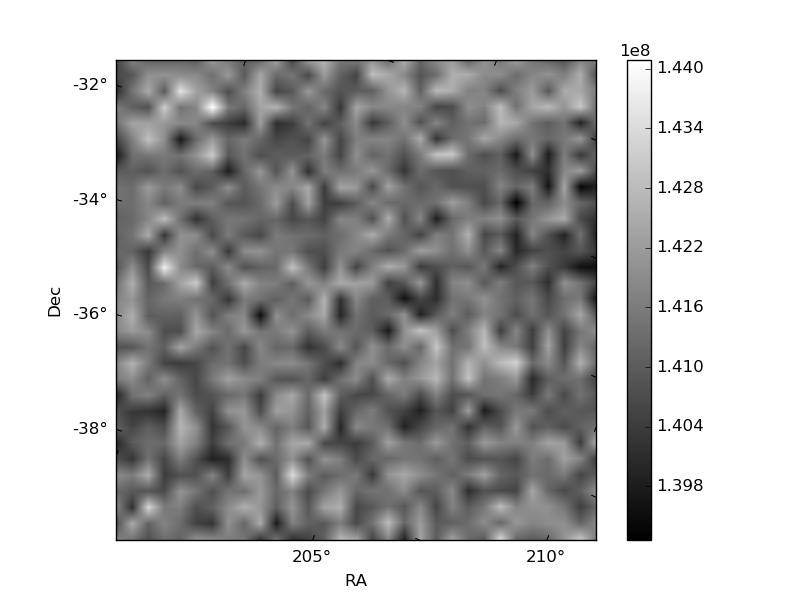
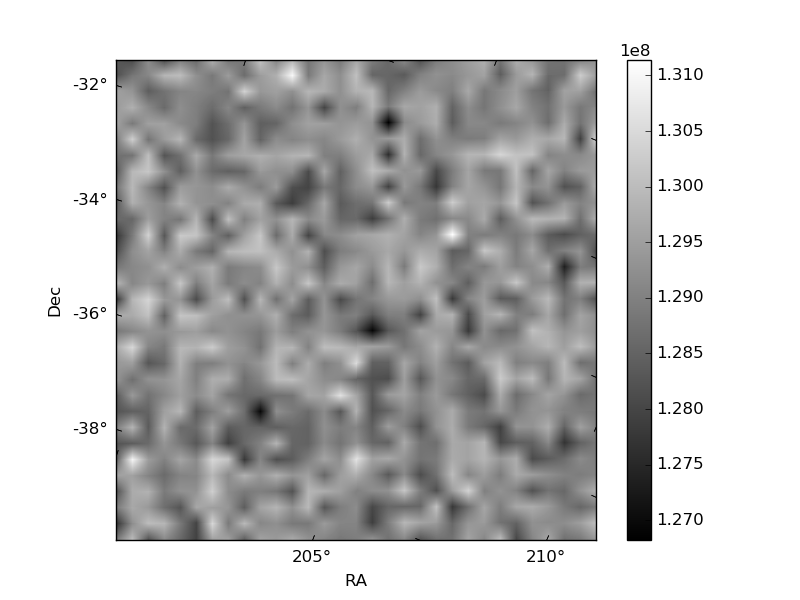
Histogram calculated using DETX and DETY for each event in the final _common_clean file
| Quadrant A | 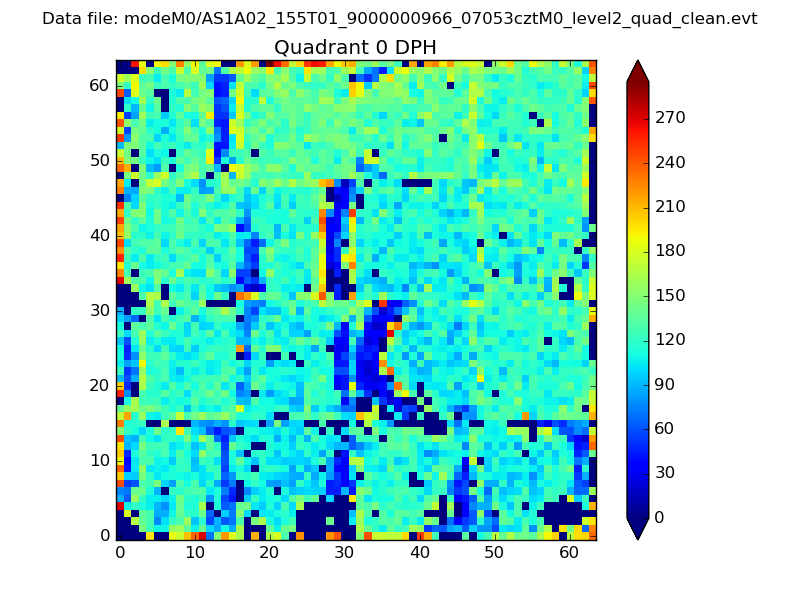 |
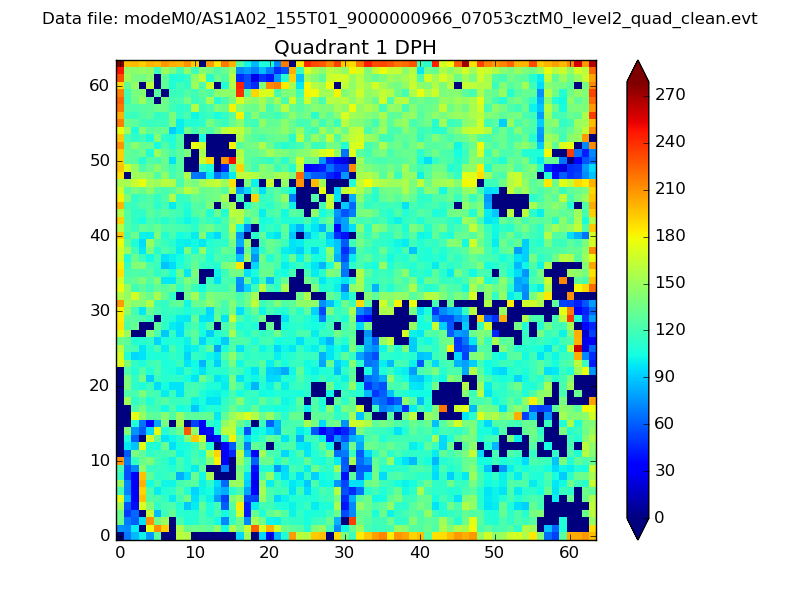 |
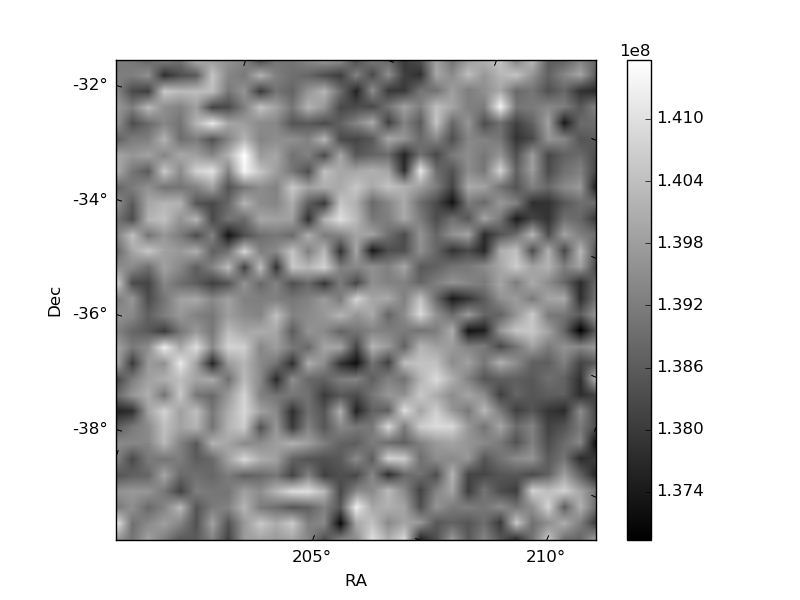
Quadrant B |
|---|---|---|---|
| Quadrant D | 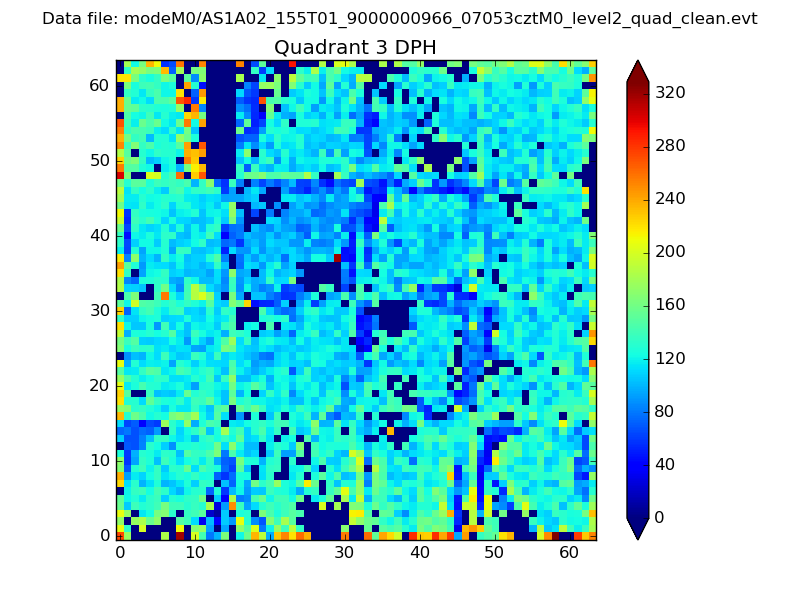 |
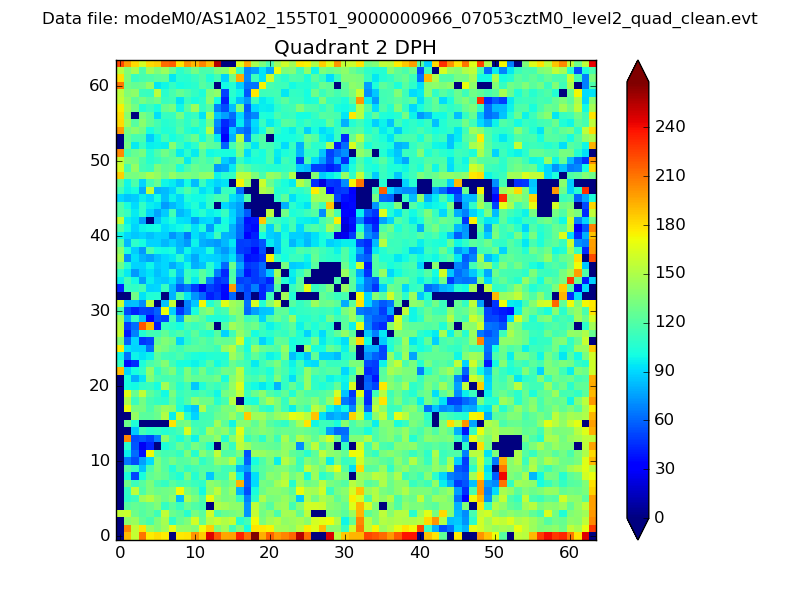 |
Quadrant C |
| Plot type | Count rate plots | Images |
|---|---|---|
| Comparison with Poisson distribution Blue bars denote a histogram of data divided into 1 sec bins. Red curve is a Poisson curve with rate = median count rate of data. |
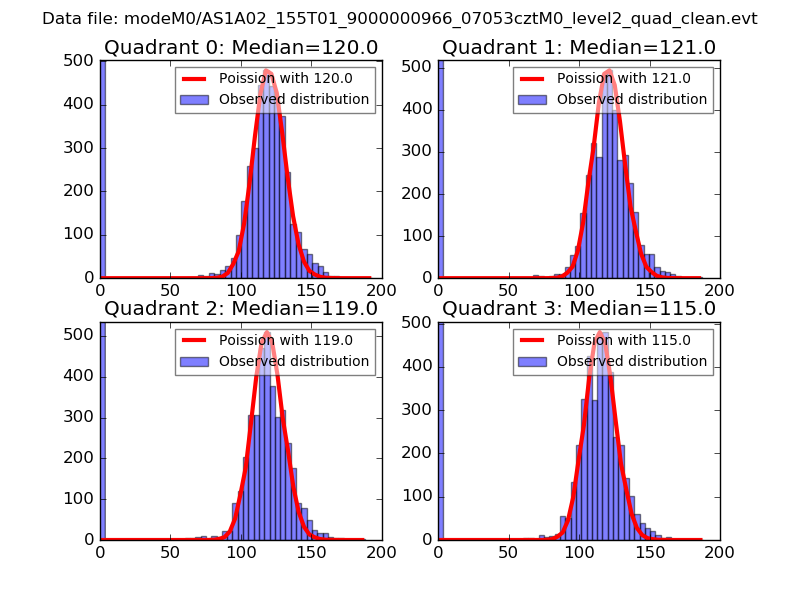 |
 |
| Quadrant-wise count rates Data is divided into 100 sec bins |
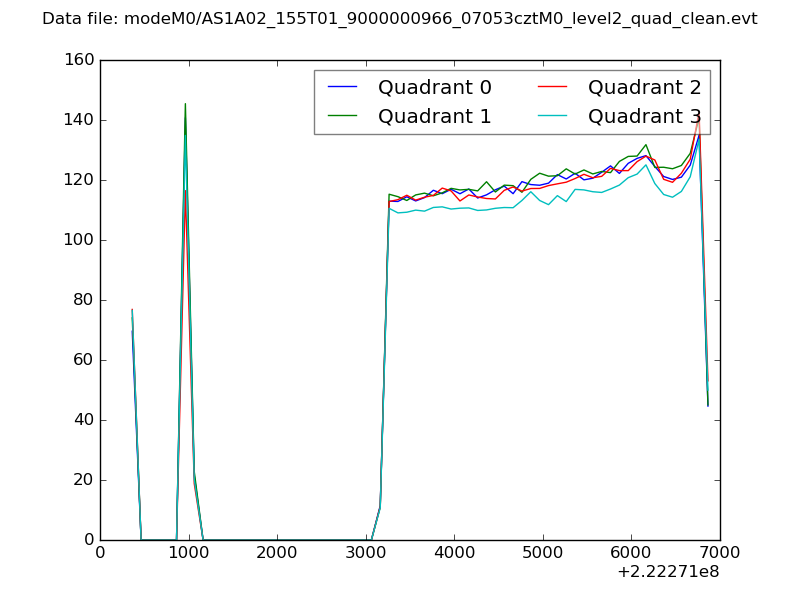 |
|
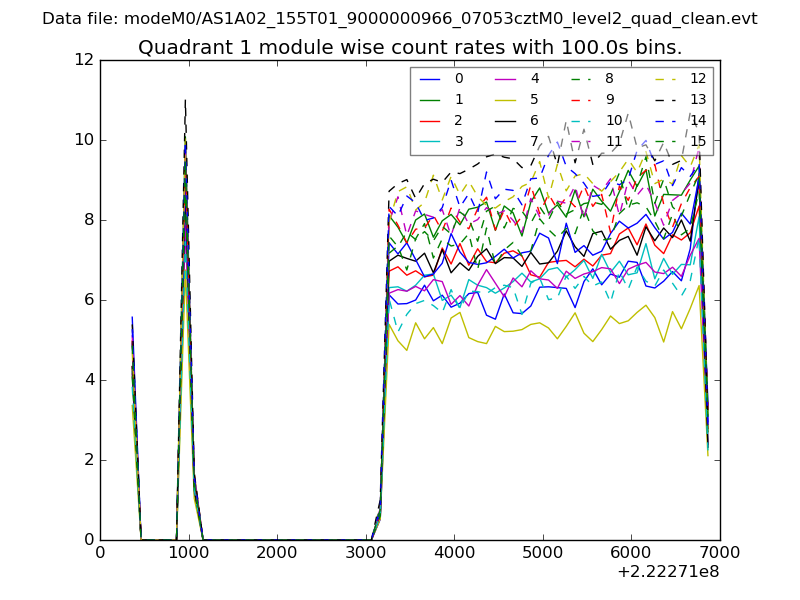
| Module-wise count rates for Quadrant A Data is divided into 100 sec bins |
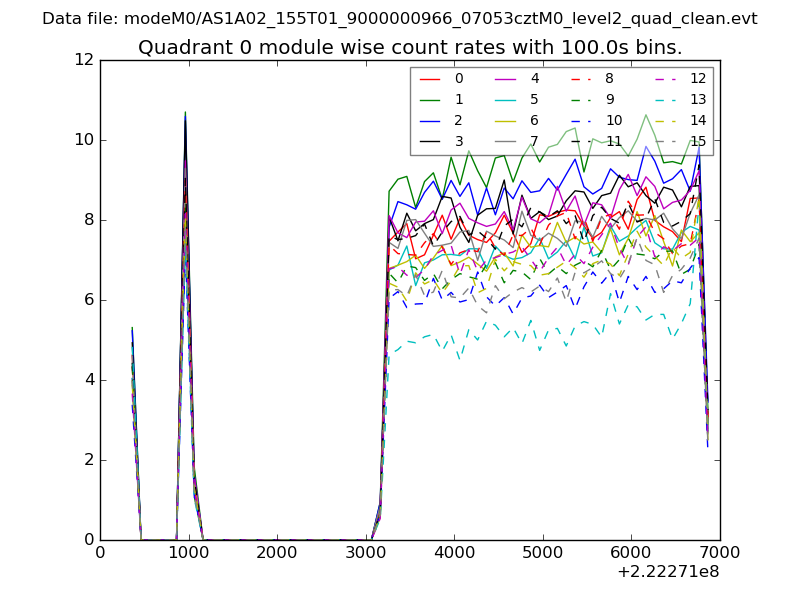 |
 |
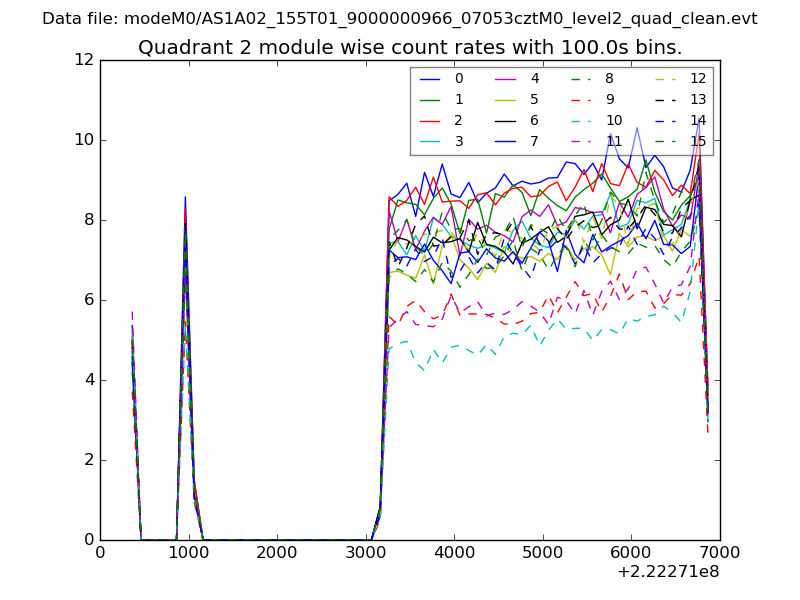
| Module-wise count rates for Quadrant B Data is divided into 100 sec bins |
 |
 |
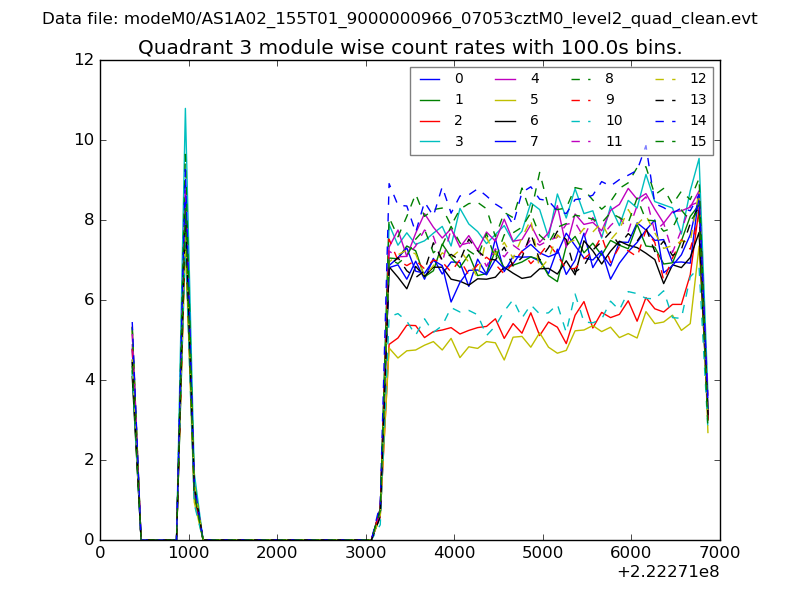
| Module-wise count rates for Quadrant C Data is divided into 100 sec bins |
 |
 |
| Module-wise count rates for Quadrant D Data is divided into 100 sec bins |
 |
 |
| Parameter | Plot |
|---|---|
| CZT HV Monitor | 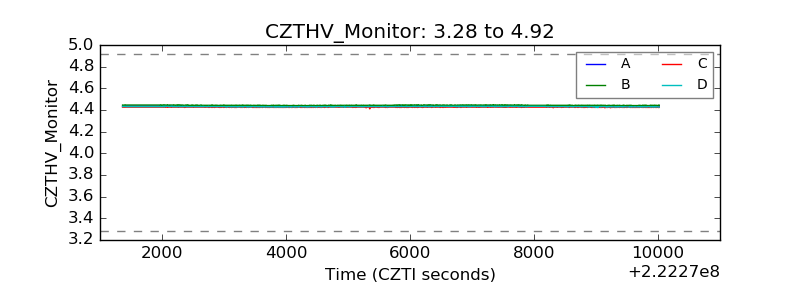 |
| D_VDD | 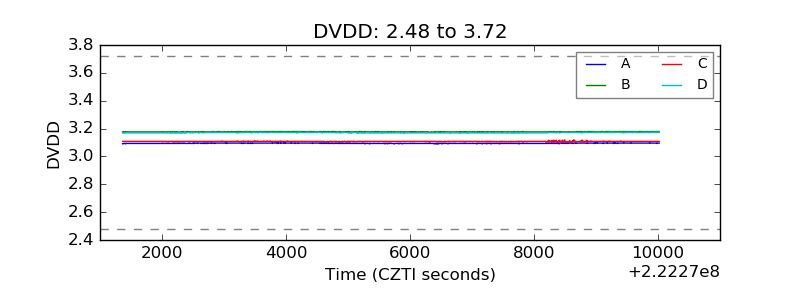 |
| Temperature 1 | 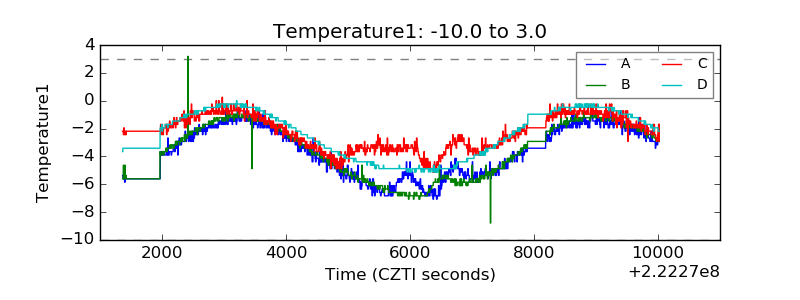 |
| Veto HV Monitor |  |
| Veto LLD | 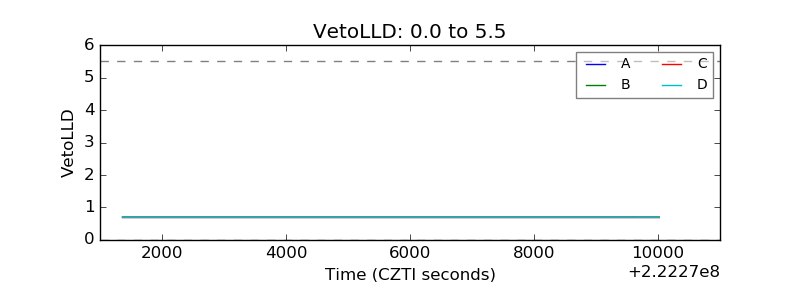 |
| Alpha Counter | 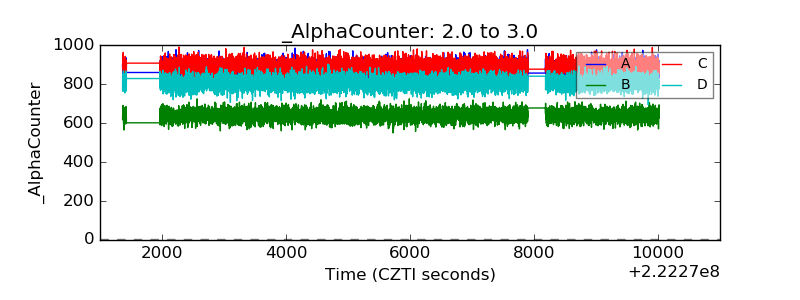 |
| _CPM_Rate | 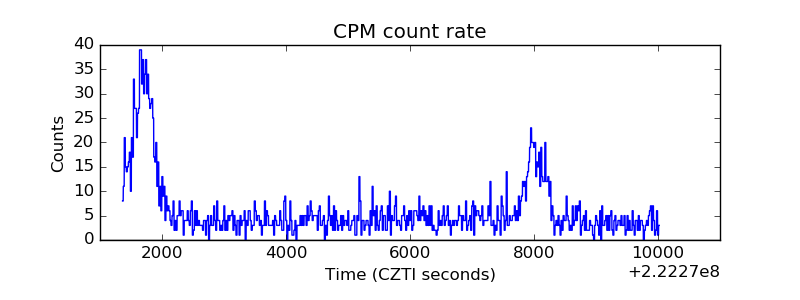 |
| CZT Counter | 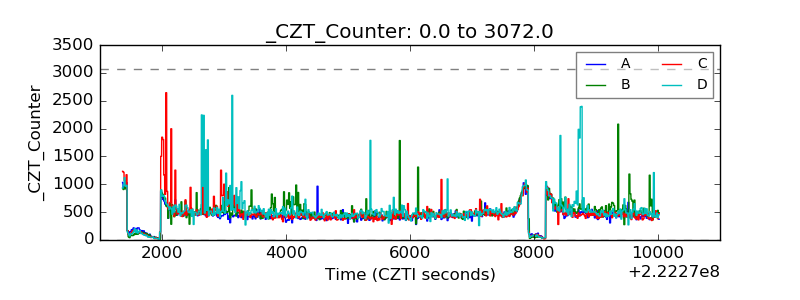 |
| +2.5 Volts monitor |  |
| +5 Volts monitor |  |
| _ROLL_ROT | 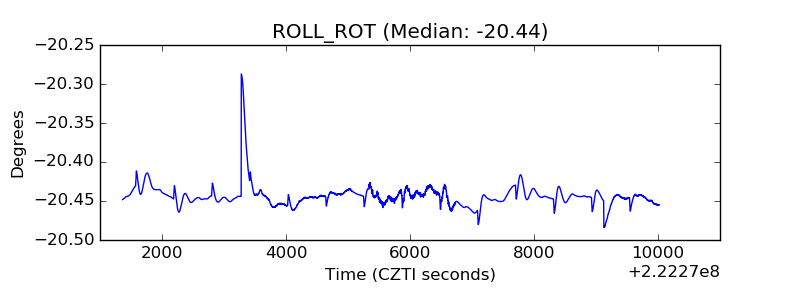 |
| _Roll_DEC | 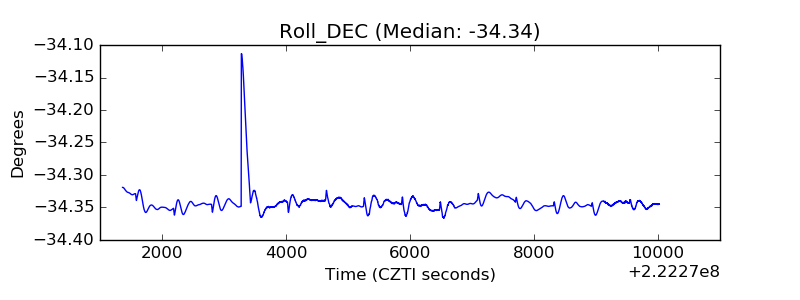 |
| _Roll_RA | 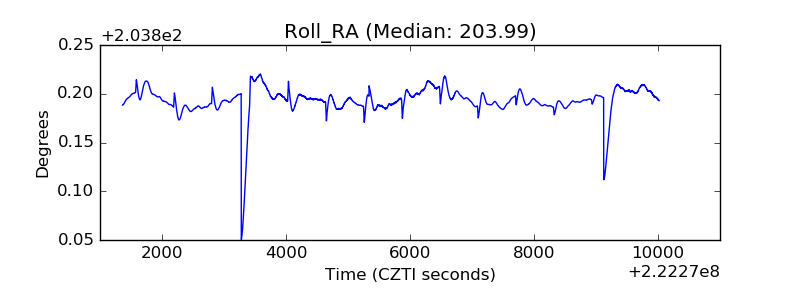 |
| Veto Counter | 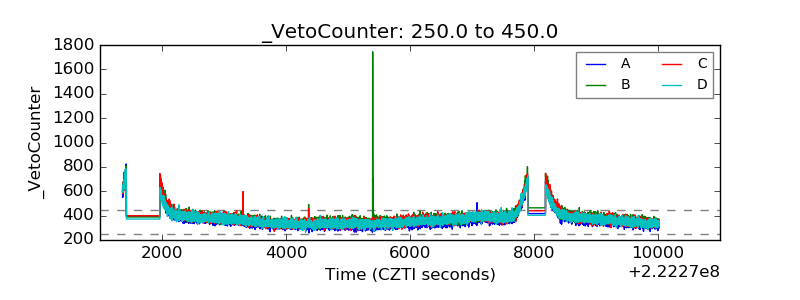 |