| Param | Original file | Final file |
|---|---|---|
| Filename | modeM0/AS1A02_155T01_9000000966_07060cztM0_level2.evt | modeM0/AS1A02_155T01_9000000966_07060cztM0_level2_quad_clean.evt |
| Size (bytes) | 1,392,177,600 | 269,665,920 |
| Size | 1.3 GB | 257.2 MB |
| Events in quadrant A | 9,819,767 | 1,683,265 |
| Events in quadrant B | 10,228,829 | 1,711,347 |
| Events in quadrant C | 9,707,040 | 1,680,406 |
| Events in quadrant D | 10,956,220 | 1,616,598 |
| Mode M0 | |||
|---|---|---|---|
| Quadrant | BADHDUFLAG | Total packets | Discarded packets |
| A | 0 | 44257 | 4 |
| B | 0 | 45081 | 3 |
| C | 0 | 44194 | 3 |
| D | 0 | 47352 | 3 |
| Mode M9 | |||
|---|---|---|---|
| Quadrant | BADHDUFLAG | Total packets | Discarded packets |
| A | 0 | 19 | 0 |
| B | 0 | 19 | 0 |
| C | 0 | 19 | 0 |
| D | 0 | 19 | 0 |
| Mode SS | |||
|---|---|---|---|
| Quadrant | BADHDUFLAG | Total packets | Discarded packets |
| A | 0 | 438 | 0 |
| B | 0 | 438 | 0 |
| C | 0 | 438 | 0 |
| D | 0 | 438 | 0 |
| Quadrant | Total seconds | Saturated seconds | Saturation percentage |
|---|---|---|---|
| A | 21430 | 93 | 0.433971% |
| B | 21430 | 166 | 0.774615% |
| C | 21430 | 100 | 0.466636% |
| D | 21430 | 220 | 1.026598% |
Noise dominated data is calculated using 1-second bins in cleaned event files. If a bin has >2000 counts, and if more than 50% of those come from <1% of pixels, then it is considered to be noise-dominated and hence unusable.
| Quadrant | # 1 sec bins | Bins with >0 counts | Bins with >2000 counts | High rate bins dominated by noise | Noise dominated (total time) | Noise dominated (detector-on time) | Marked lightcurve |
|---|---|---|---|---|---|---|---|
| A | 23470 | 21433 | 1 | 1 | 0.00% | 0.00% | 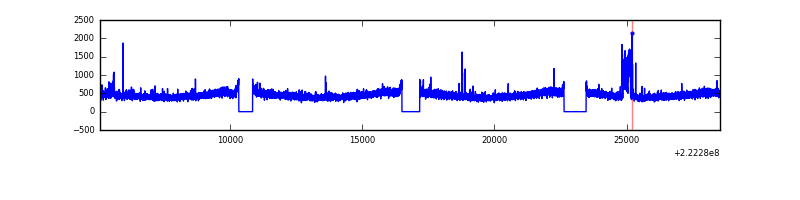 |
| B | 23470 | 21433 | 45 | 45 | 0.19% | 0.21% | 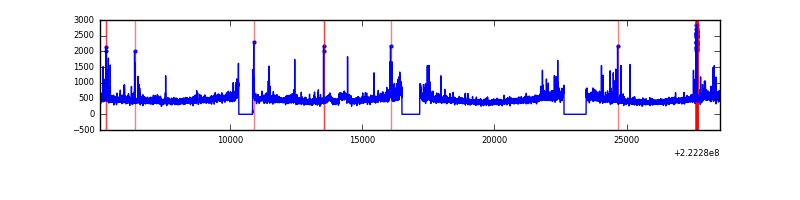 |
| C | 23470 | 21433 | 47 | 47 | 0.20% | 0.22% | 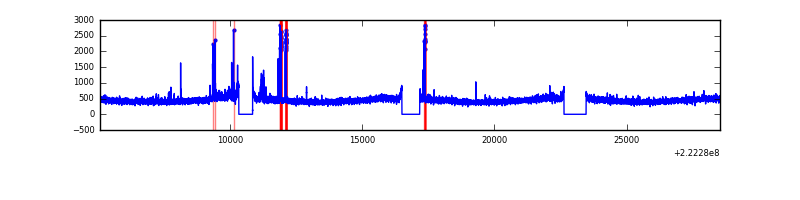 |
| D | 23470 | 21433 | 155 | 155 | 0.66% | 0.72% | 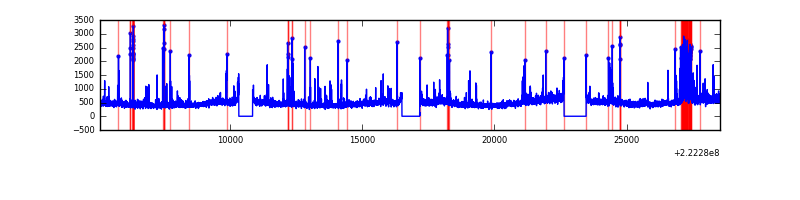 |
Top three noisy pixels from each quadrant. If the there are fewer than three noisy pixels in the level2.evt file, extra rows are filled as -1
| Pixel properties | Quadrant properties | ||||||
|---|---|---|---|---|---|---|---|
| Quadrant | DetID | PixID | Counts | Sigma | Mean | Median | Sigma |
| A | 15 | 234 | 282912 | 562.24 | 2448 | 2394 | 498.9 |
| A | 8 | 15 | 46643 | 88.69 | 2448 | 2394 | 498.9 |
| A | 13 | 14 | 32743 | 60.83 | 2448 | 2394 | 498.9 |
| B | 0 | 214 | 225184 | 474.23 | 2467 | 2405 | 469.8 |
| B | 0 | 228 | 149980 | 314.14 | 2467 | 2405 | 469.8 |
| B | 5 | 174 | 102384 | 212.82 | 2467 | 2405 | 469.8 |
| C | 9 | 68 | 333447 | 601.9 | 2386 | 2398 | 550.0 |
| C | 1 | 3 | 38851 | 66.28 | 2386 | 2398 | 550.0 |
| C | 13 | 61 | 18765 | 29.76 | 2386 | 2398 | 550.0 |
| D | 8 | 195 | 925098 | 1598.92 | 2374 | 2302 | 577.1 |
| D | 14 | 34 | 520812 | 898.42 | 2374 | 2302 | 577.1 |
| D | 12 | 233 | 174405 | 298.2 | 2374 | 2302 | 577.1 |
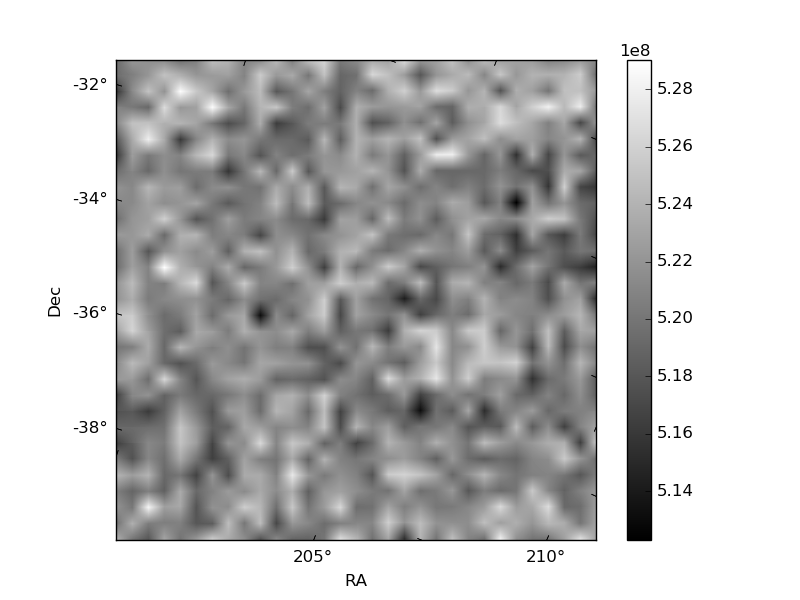
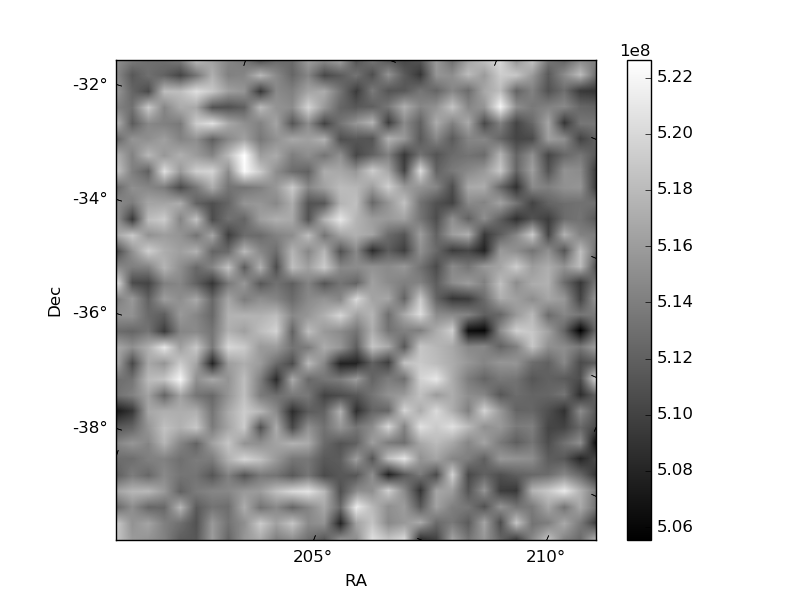
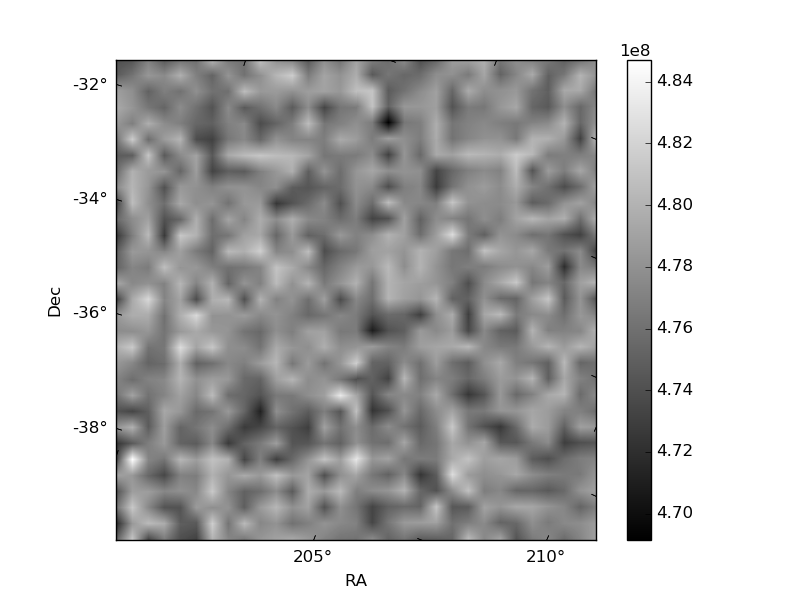
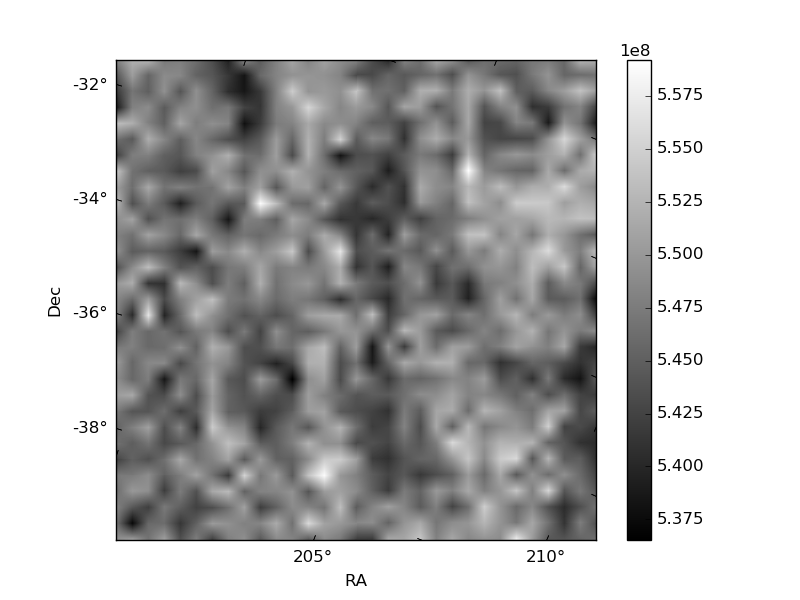
Histogram calculated using DETX and DETY for each event in the final _common_clean file
| Quadrant A | 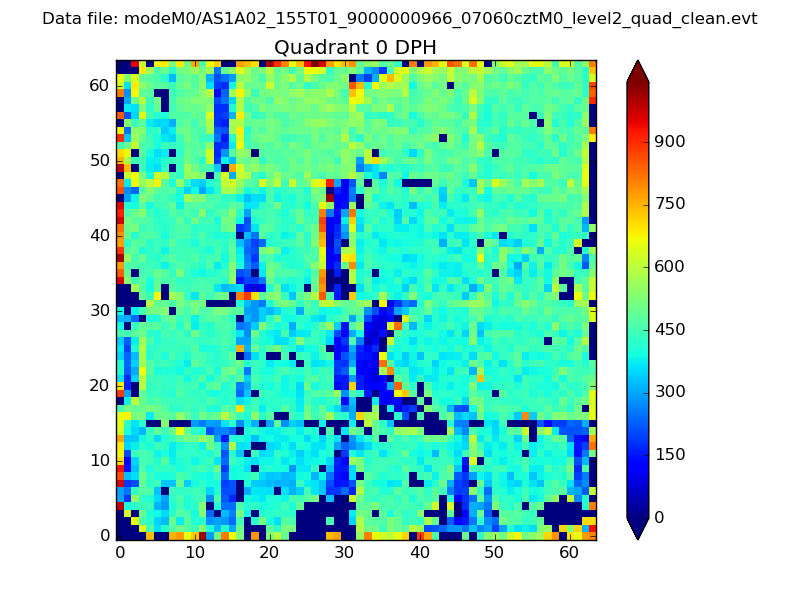 |
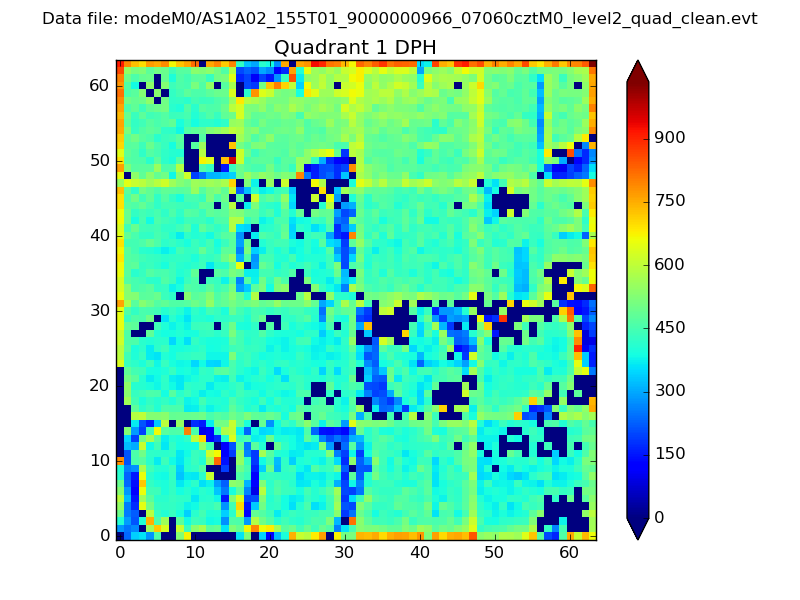 |
Quadrant B |
|---|---|---|---|
| Quadrant D | 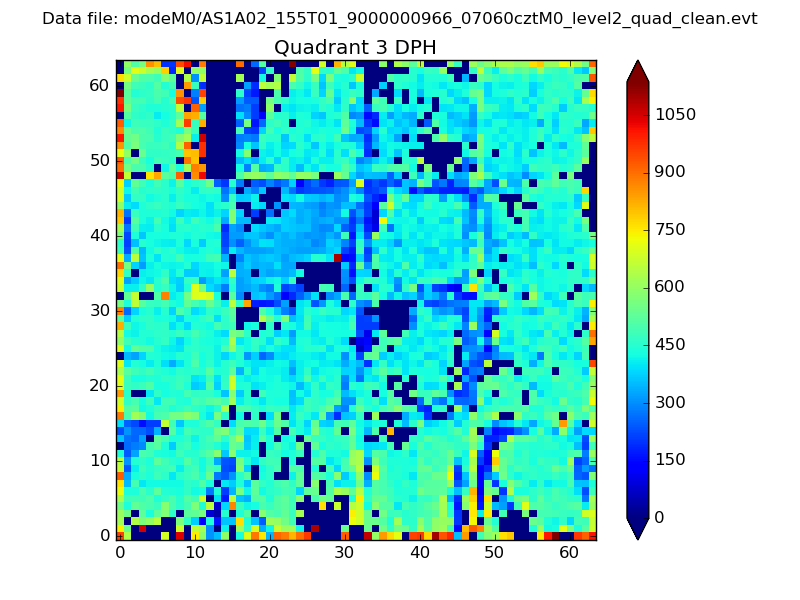 |
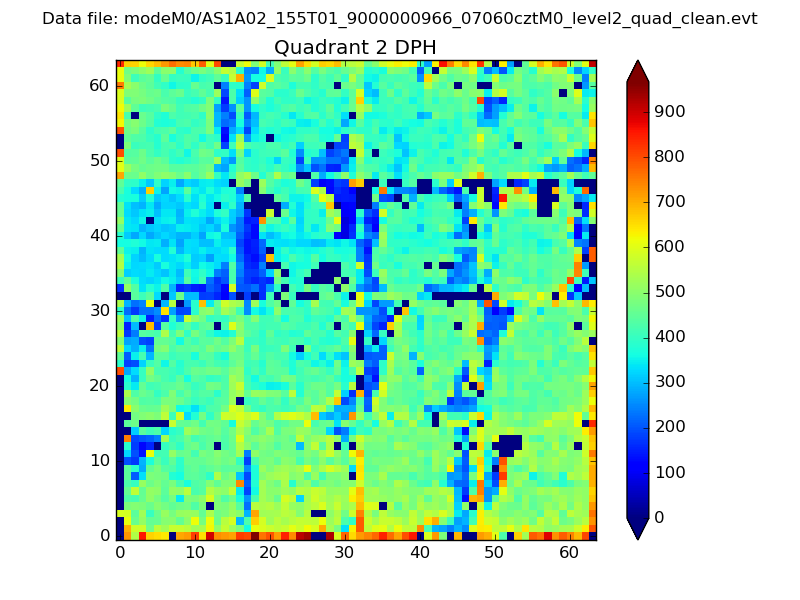 |
Quadrant C |
| Plot type | Count rate plots | Images |
|---|---|---|
| Comparison with Poisson distribution Blue bars denote a histogram of data divided into 1 sec bins. Red curve is a Poisson curve with rate = median count rate of data. |
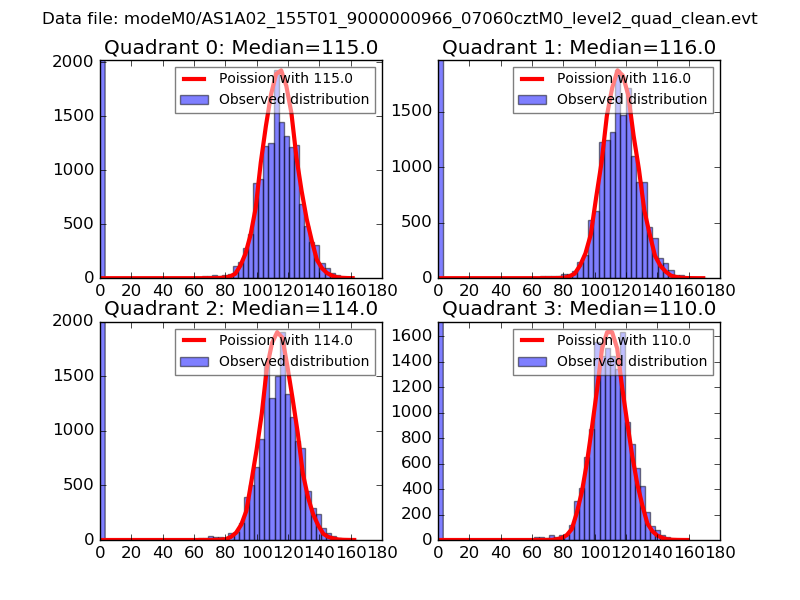 |
 |
| Quadrant-wise count rates Data is divided into 100 sec bins |
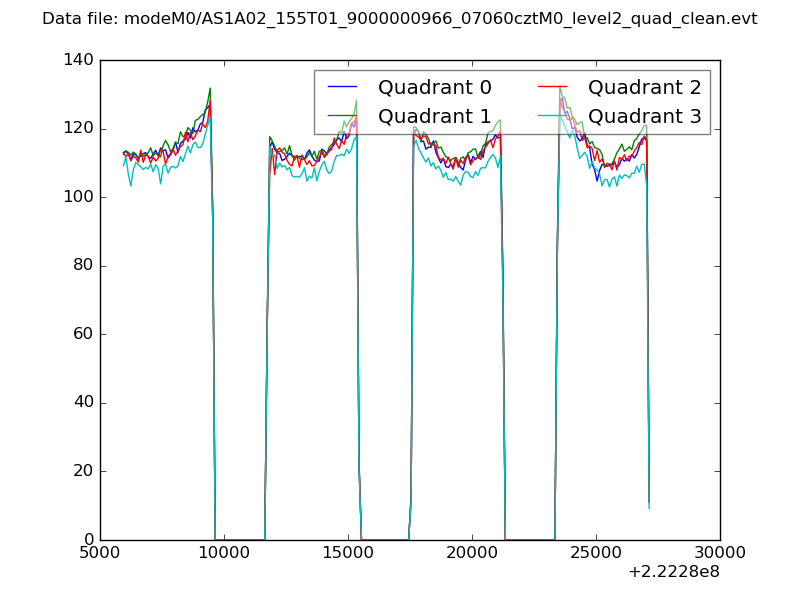 |
|
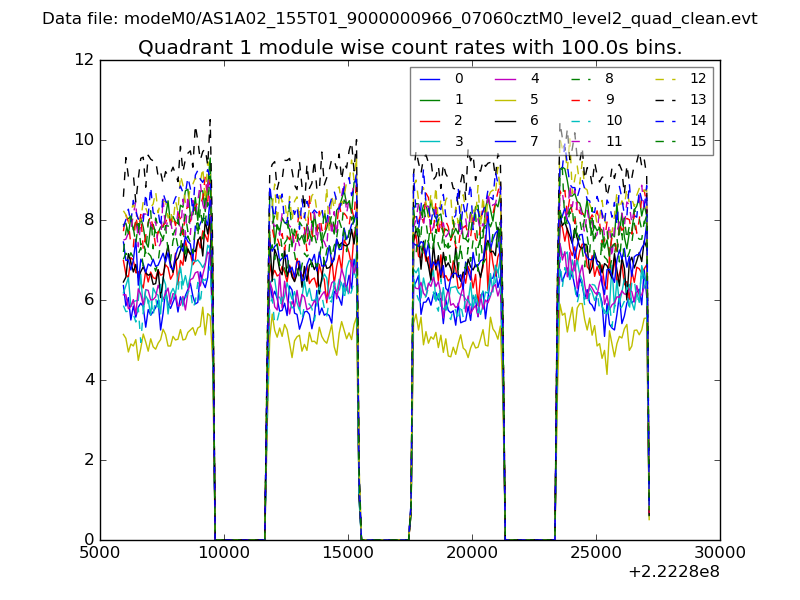
| Module-wise count rates for Quadrant A Data is divided into 100 sec bins |
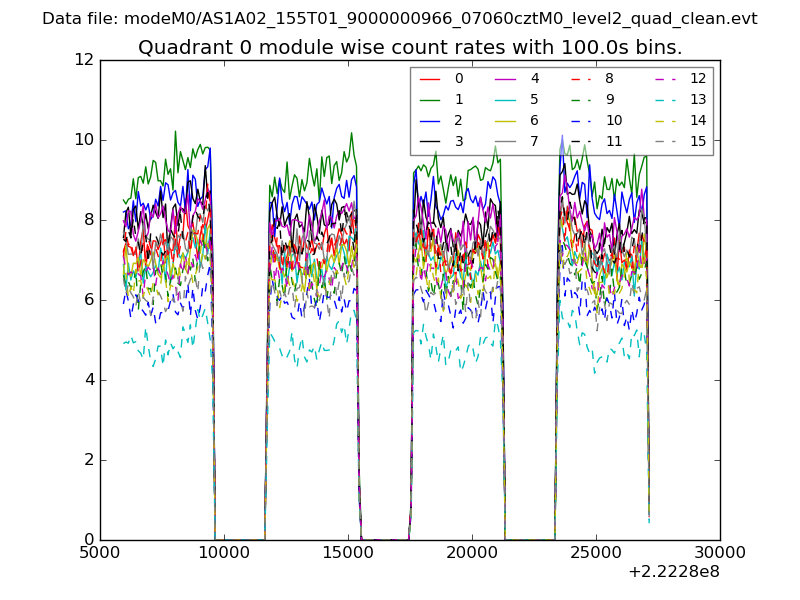 |
 |
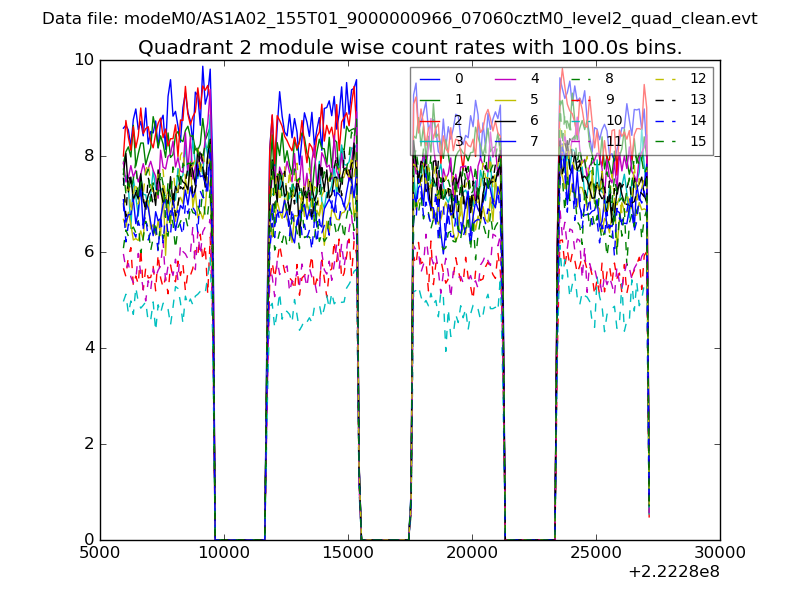
| Module-wise count rates for Quadrant B Data is divided into 100 sec bins |
 |
 |
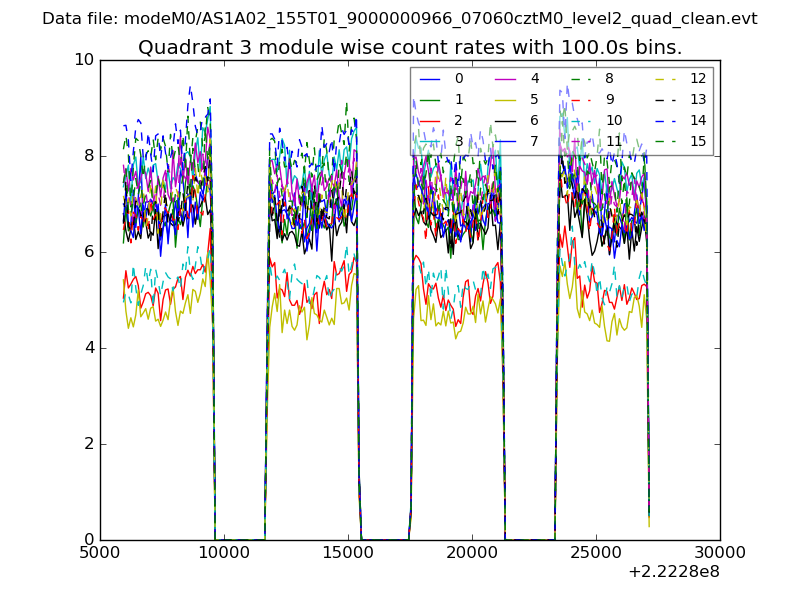
| Module-wise count rates for Quadrant C Data is divided into 100 sec bins |
 |
 |
| Module-wise count rates for Quadrant D Data is divided into 100 sec bins |
 |
 |
| Parameter | Plot |
|---|---|
| CZT HV Monitor | 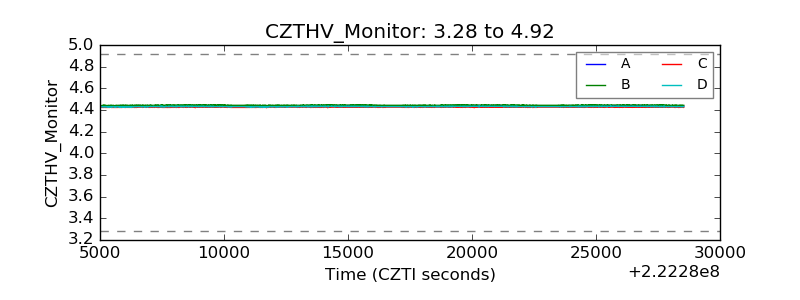 |
| D_VDD | 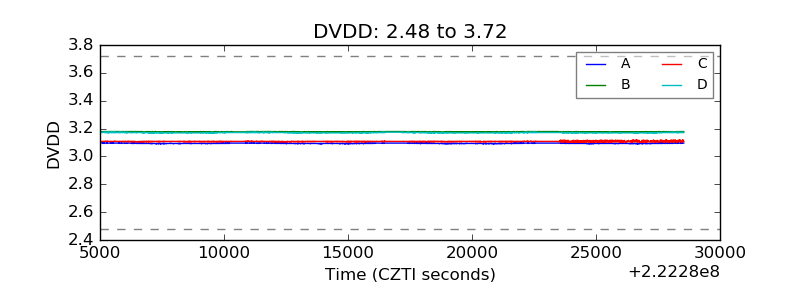 |
| Temperature 1 | 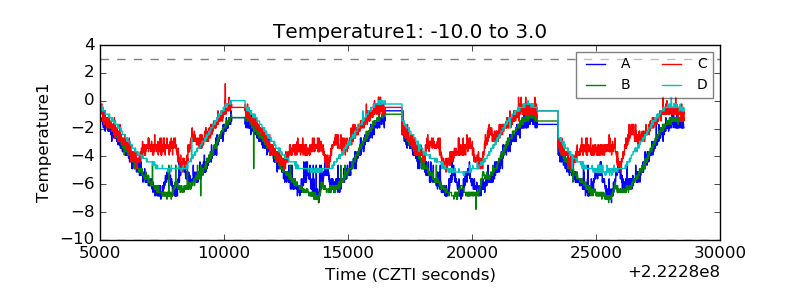 |
| Veto HV Monitor | 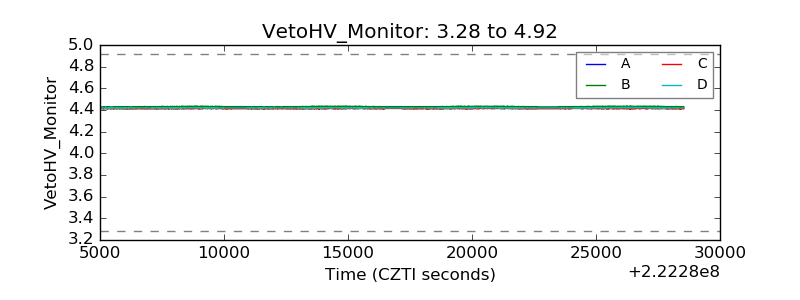 |
| Veto LLD | 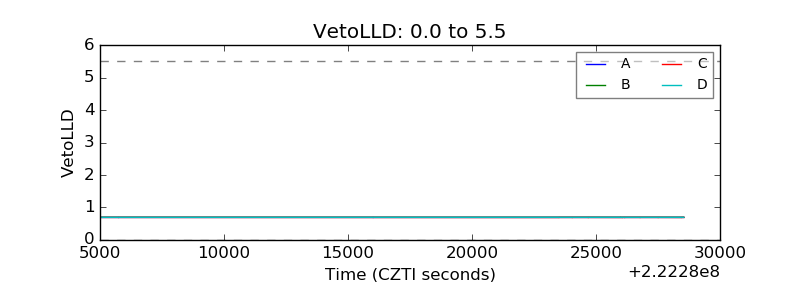 |
| Alpha Counter |  |
| _CPM_Rate | 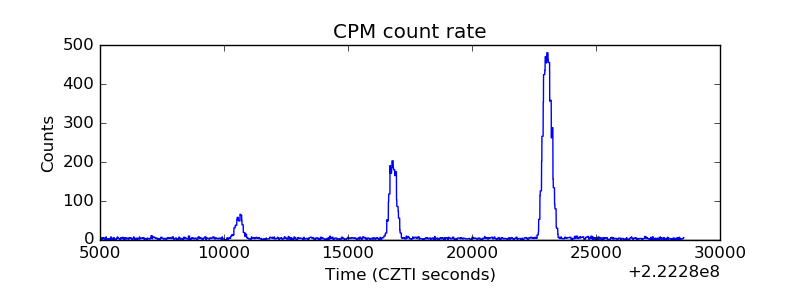 |
| CZT Counter |  |
| +2.5 Volts monitor |  |
| +5 Volts monitor |  |
| _ROLL_ROT | 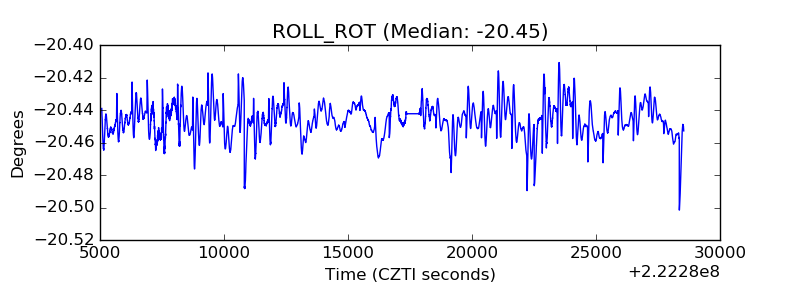 |
| _Roll_DEC | 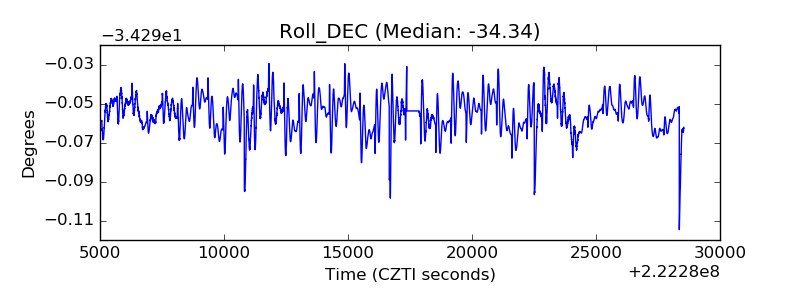 |
| _Roll_RA | 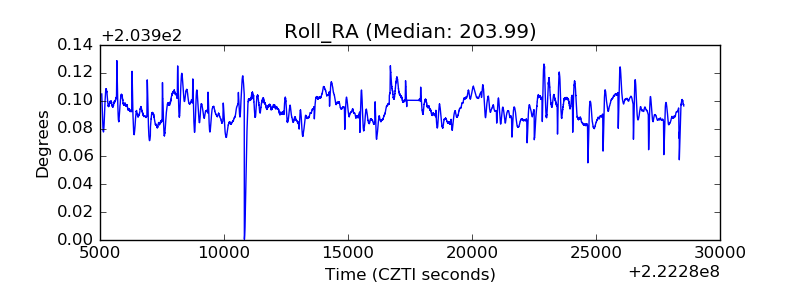 |
| Veto Counter | 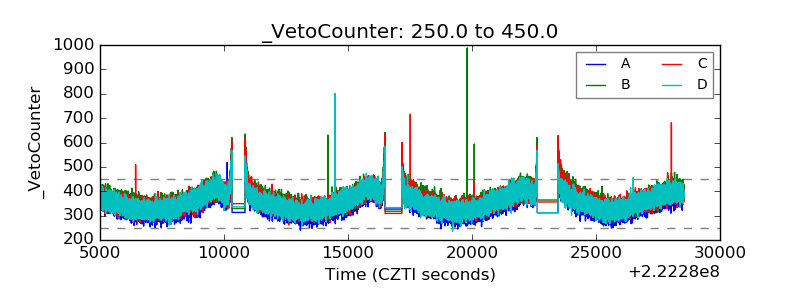 |