| Param | Original file | Final file |
|---|---|---|
| Filename | modeM0/AS1A02_155T01_9000000966_07061cztM0_level2.evt | modeM0/AS1A02_155T01_9000000966_07061cztM0_level2_quad_clean.evt |
| Size (bytes) | 835,827,840 | 157,360,320 |
| Size | 797.1 MB | 150.1 MB |
| Events in quadrant A | 6,097,411 | 970,976 |
| Events in quadrant B | 5,893,040 | 1,014,823 |
| Events in quadrant C | 5,793,962 | 995,803 |
| Events in quadrant D | 6,704,957 | 943,403 |
| Mode M0 | |||
|---|---|---|---|
| Quadrant | BADHDUFLAG | Total packets | Discarded packets |
| A | 0 | 26352 | 4 |
| B | 0 | 25562 | 3 |
| C | 0 | 25404 | 3 |
| D | 0 | 27505 | 3 |
| Mode M9 | |||
|---|---|---|---|
| Quadrant | BADHDUFLAG | Total packets | Discarded packets |
| A | 0 | 33 | 0 |
| B | 0 | 33 | 0 |
| C | 0 | 33 | 0 |
| D | 0 | 33 | 0 |
| Mode SS | |||
|---|---|---|---|
| Quadrant | BADHDUFLAG | Total packets | Discarded packets |
| A | 0 | 250 | 0 |
| B | 0 | 250 | 0 |
| C | 0 | 250 | 0 |
| D | 0 | 250 | 0 |
| Quadrant | Total seconds | Saturated seconds | Saturation percentage |
|---|---|---|---|
| A | 12159 | 239 | 1.965622% |
| B | 12159 | 60 | 0.493462% |
| C | 12159 | 103 | 0.847109% |
| D | 12159 | 109 | 0.896455% |
Noise dominated data is calculated using 1-second bins in cleaned event files. If a bin has >2000 counts, and if more than 50% of those come from <1% of pixels, then it is considered to be noise-dominated and hence unusable.
| Quadrant | # 1 sec bins | Bins with >0 counts | Bins with >2000 counts | High rate bins dominated by noise | Noise dominated (total time) | Noise dominated (detector-on time) | Marked lightcurve |
|---|---|---|---|---|---|---|---|
| A | 15429 | 12162 | 170 | 170 | 1.10% | 1.40% | 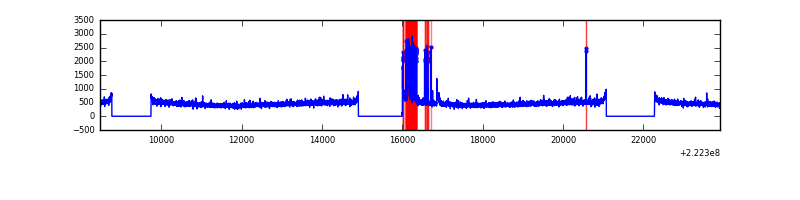 |
| B | 15429 | 12162 | 2 | 2 | 0.01% | 0.02% | 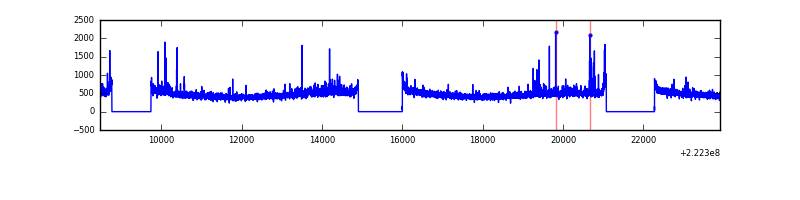 |
| C | 15429 | 12162 | 51 | 51 | 0.33% | 0.42% | 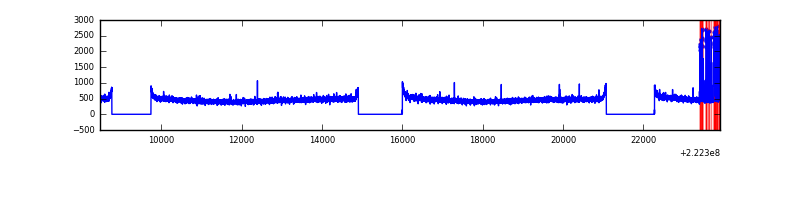 |
| D | 15429 | 12162 | 78 | 78 | 0.51% | 0.64% |  |
Top three noisy pixels from each quadrant. If the there are fewer than three noisy pixels in the level2.evt file, extra rows are filled as -1
| Pixel properties | Quadrant properties | ||||||
|---|---|---|---|---|---|---|---|
| Quadrant | DetID | PixID | Counts | Sigma | Mean | Median | Sigma |
| A | 15 | 234 | 490844 | 1680.07 | 1435 | 1405 | 291.3 |
| A | 8 | 15 | 45680 | 151.98 | 1435 | 1405 | 291.3 |
| A | 0 | 23 | 25186 | 81.63 | 1435 | 1405 | 291.3 |
| B | 0 | 214 | 139140 | 498.46 | 1466 | 1431 | 276.3 |
| B | 0 | 228 | 39188 | 136.67 | 1466 | 1431 | 276.3 |
| B | 12 | 111 | 26882 | 92.12 | 1466 | 1431 | 276.3 |
| C | 4 | 254 | 222306 | 672.04 | 1423 | 1434 | 328.7 |
| C | 13 | 61 | 10943 | 28.93 | 1423 | 1434 | 328.7 |
| C | 1 | 16 | 9513 | 24.58 | 1423 | 1434 | 328.7 |
| D | 8 | 195 | 748415 | 2188.7 | 1409 | 1369 | 341.3 |
| D | 12 | 233 | 355399 | 1037.24 | 1409 | 1369 | 341.3 |
| D | 5 | 239 | 111432 | 322.46 | 1409 | 1369 | 341.3 |
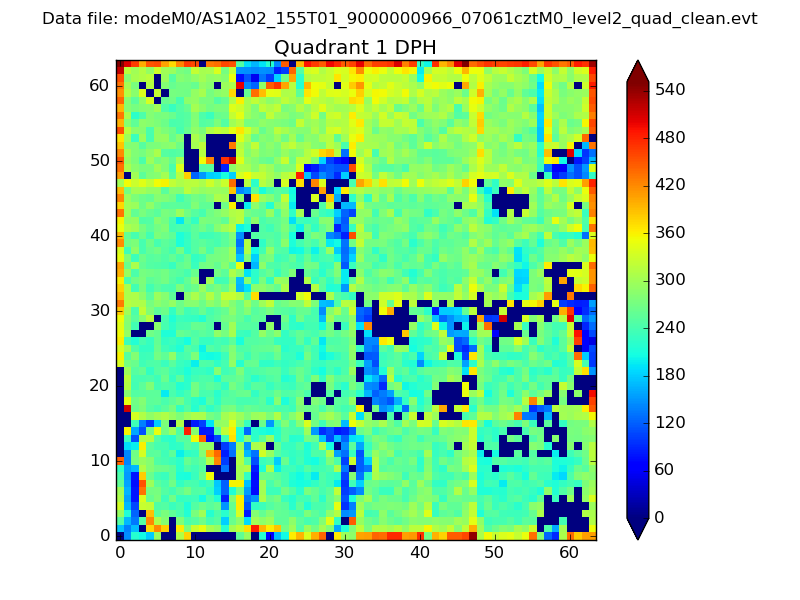
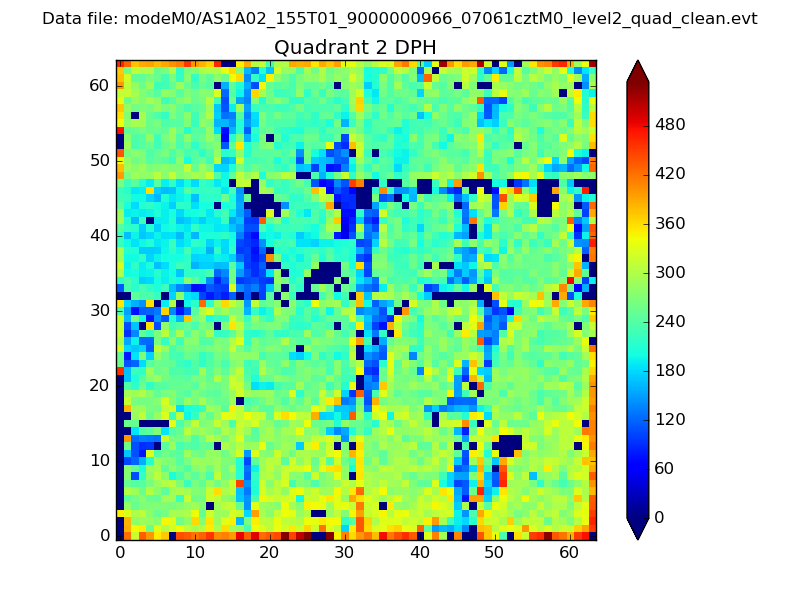
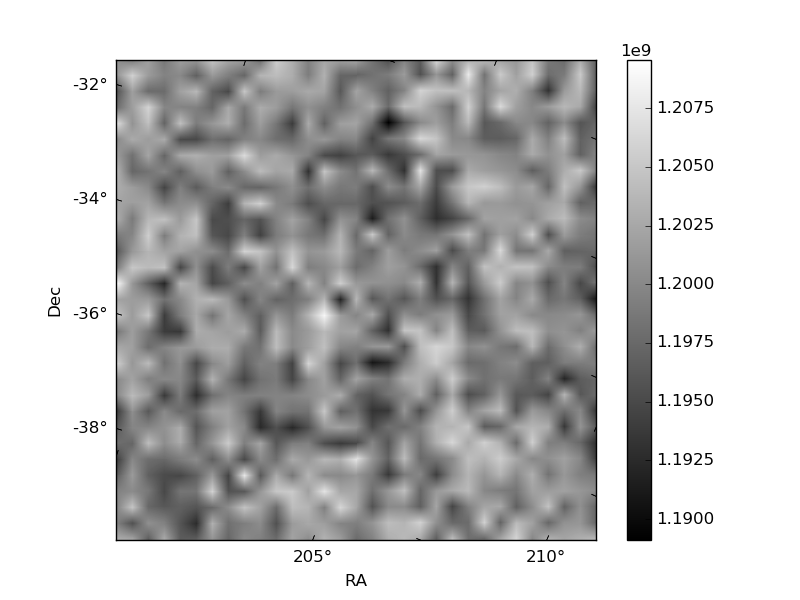
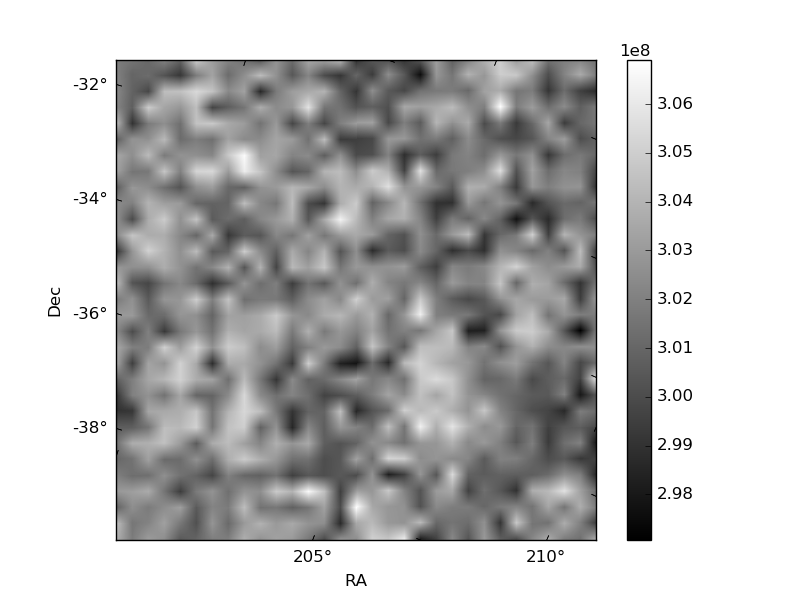
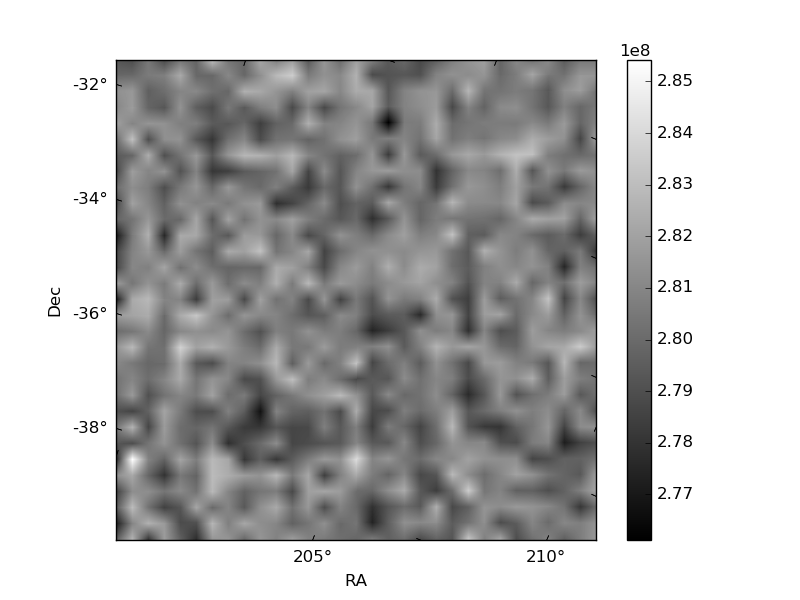
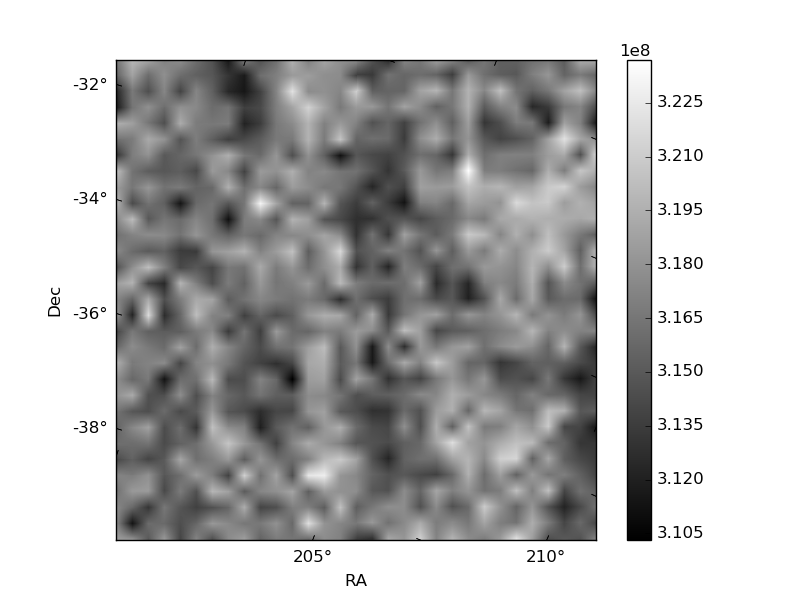
Histogram calculated using DETX and DETY for each event in the final _common_clean file
| Quadrant A | 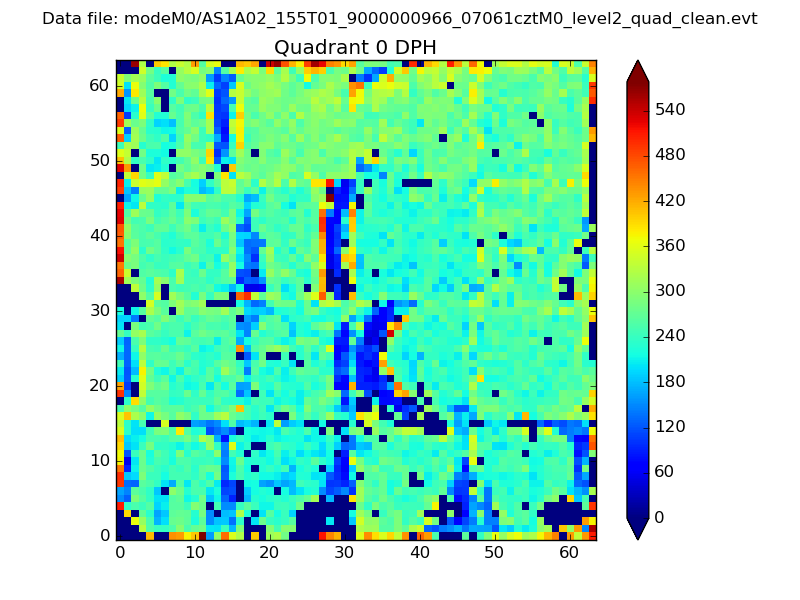 |
 |
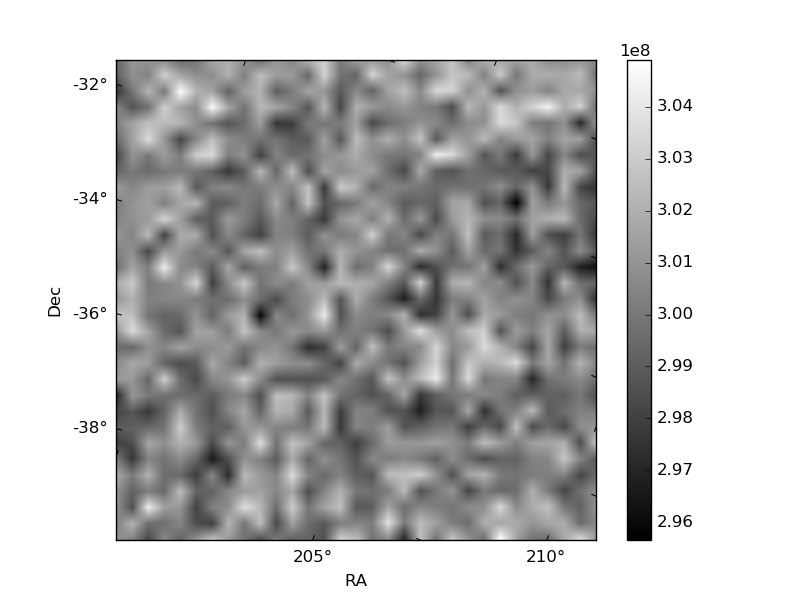
Quadrant B |
|---|---|---|---|
| Quadrant D | 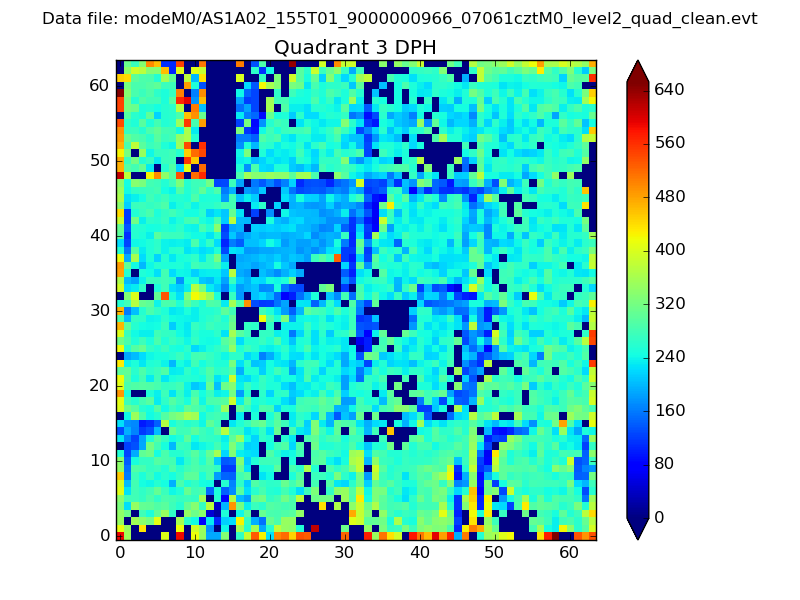 |
 |
Quadrant C |
| Plot type | Count rate plots | Images |
|---|---|---|
| Comparison with Poisson distribution Blue bars denote a histogram of data divided into 1 sec bins. Red curve is a Poisson curve with rate = median count rate of data. |
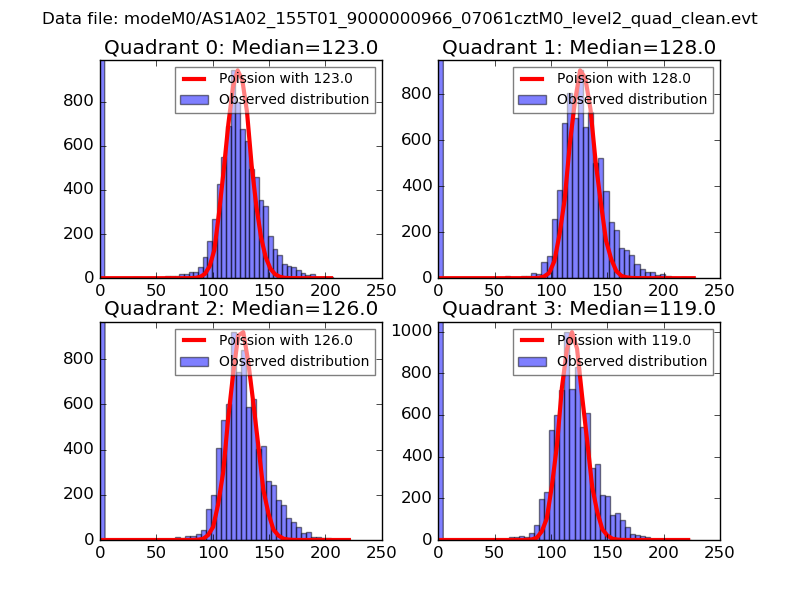 |
 |
| Quadrant-wise count rates Data is divided into 100 sec bins |
 |
|
| Module-wise count rates for Quadrant A Data is divided into 100 sec bins |
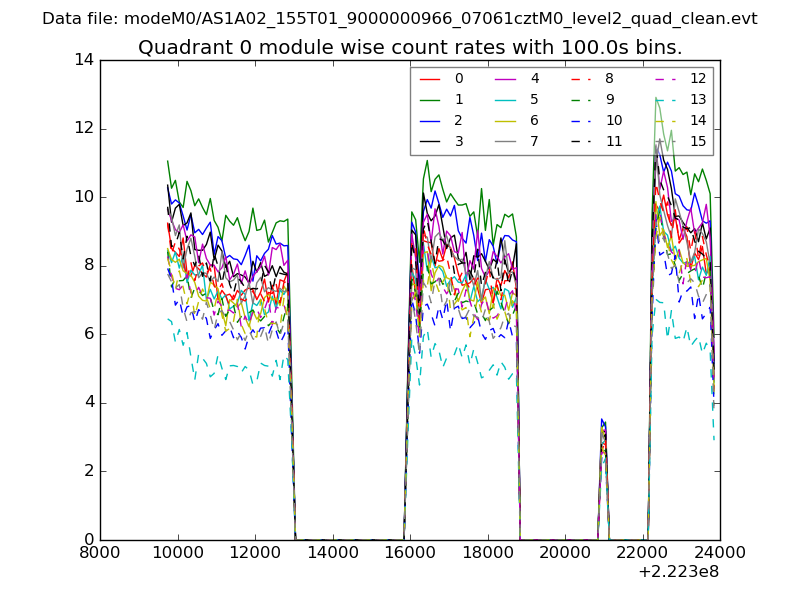 |
 |
| Module-wise count rates for Quadrant B Data is divided into 100 sec bins |
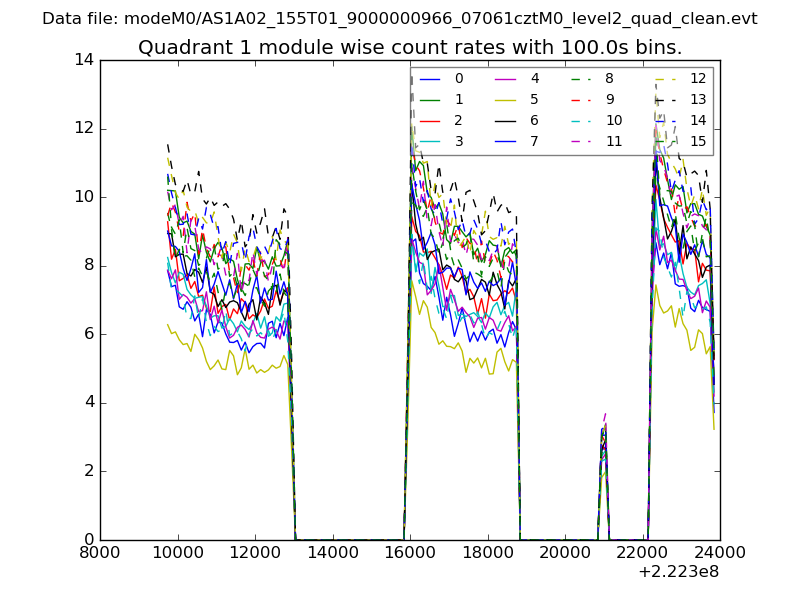 |
 |
| Module-wise count rates for Quadrant C Data is divided into 100 sec bins |
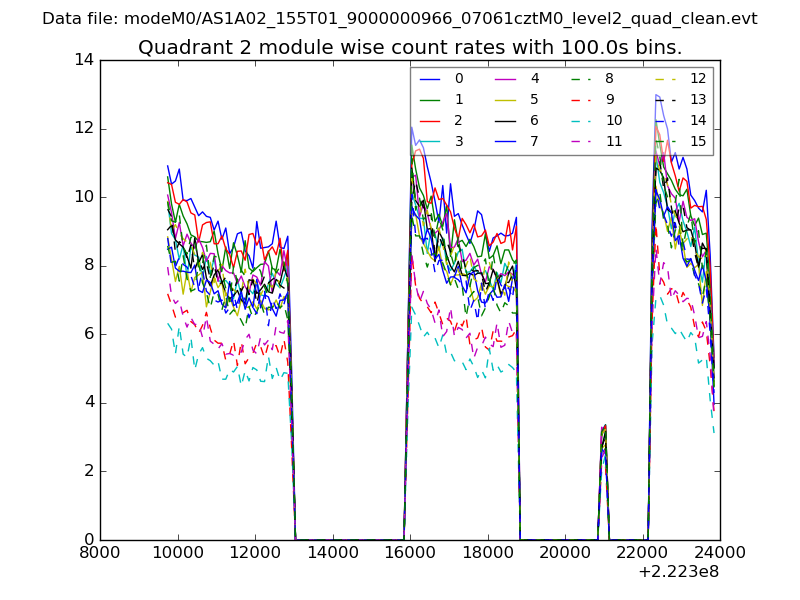 |
 |
| Module-wise count rates for Quadrant D Data is divided into 100 sec bins |
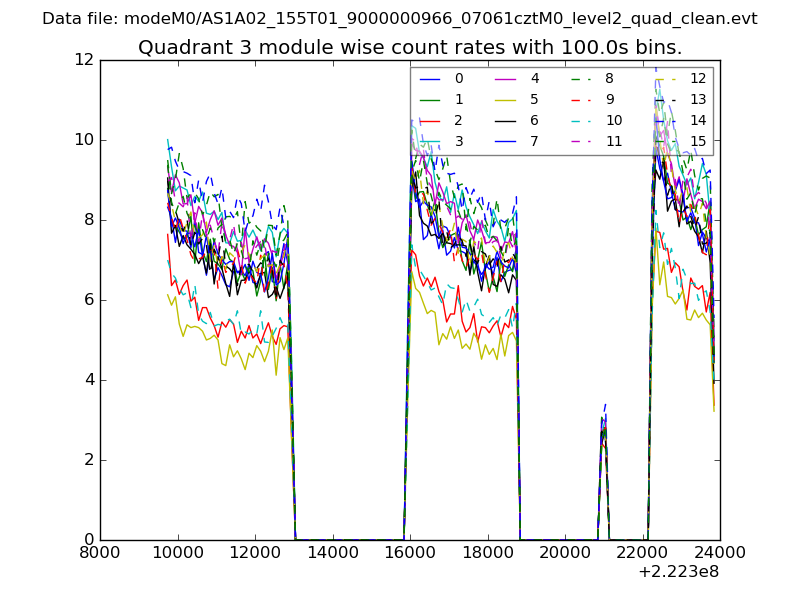 |
 |
| Parameter | Plot |
|---|---|
| CZT HV Monitor | 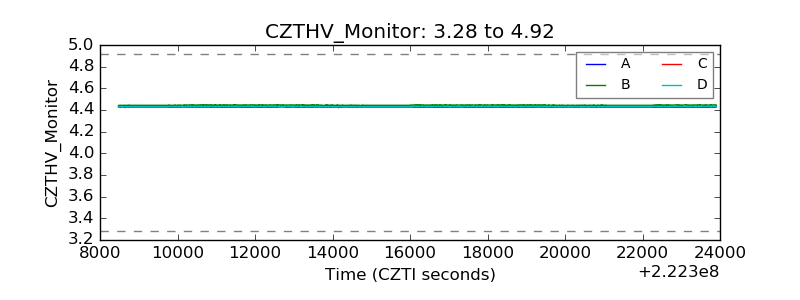 |
| D_VDD | 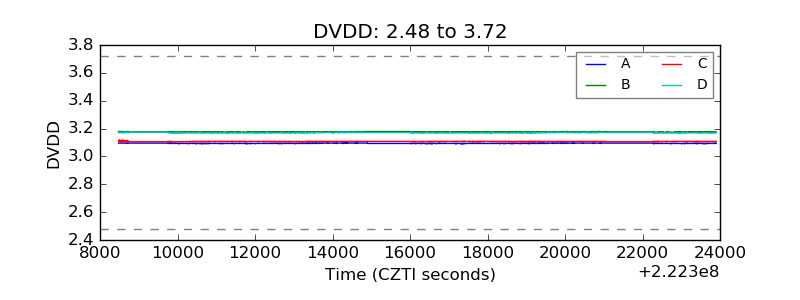 |
| Temperature 1 | 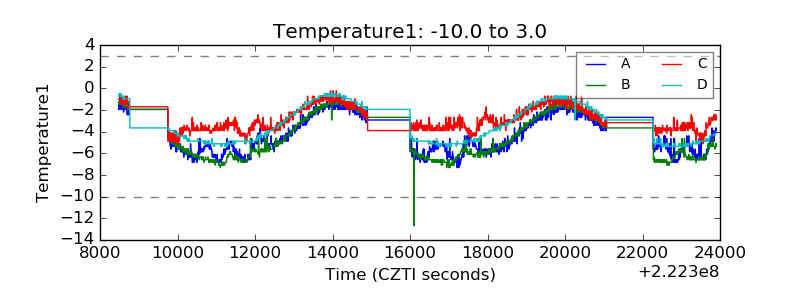 |
| Veto HV Monitor | 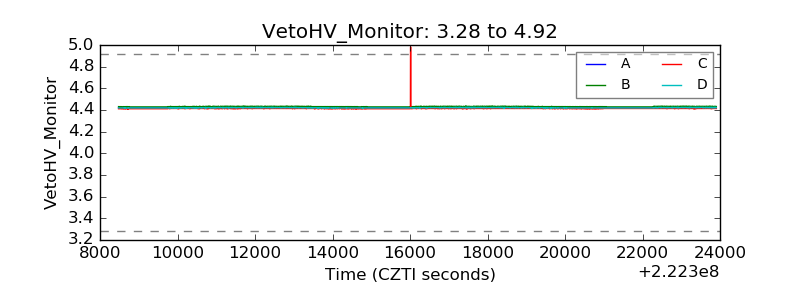 |
| Veto LLD | 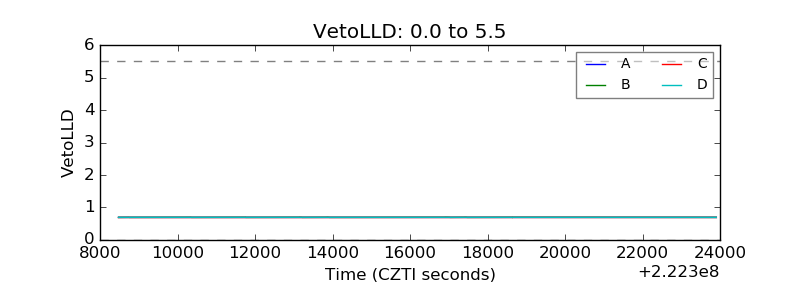 |
| Alpha Counter | 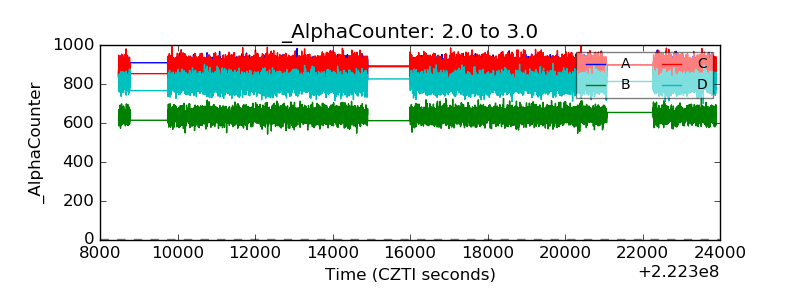 |
| _CPM_Rate | 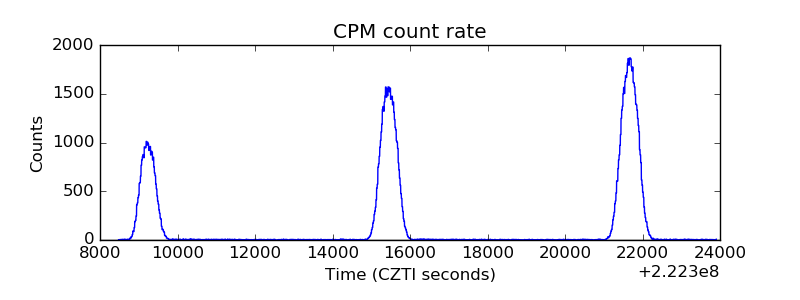 |
| CZT Counter | 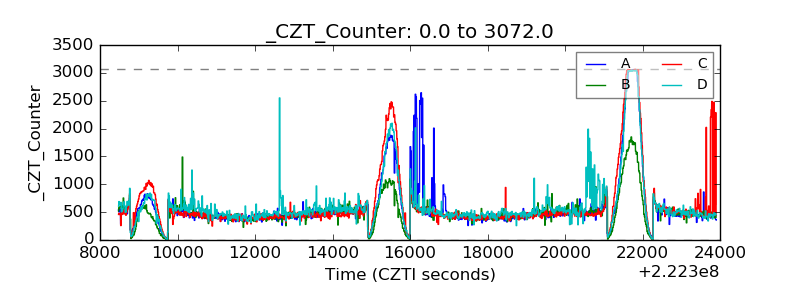 |
| +2.5 Volts monitor |  |
| +5 Volts monitor | 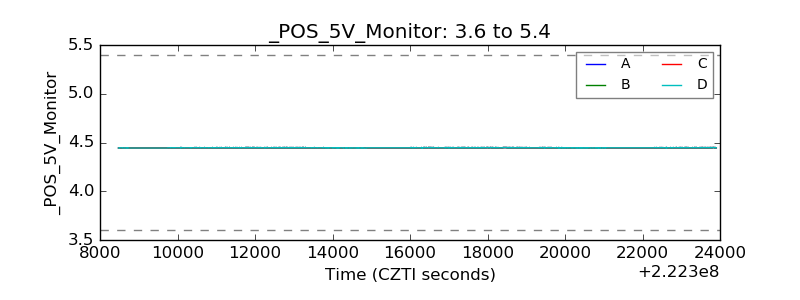 |
| _ROLL_ROT | 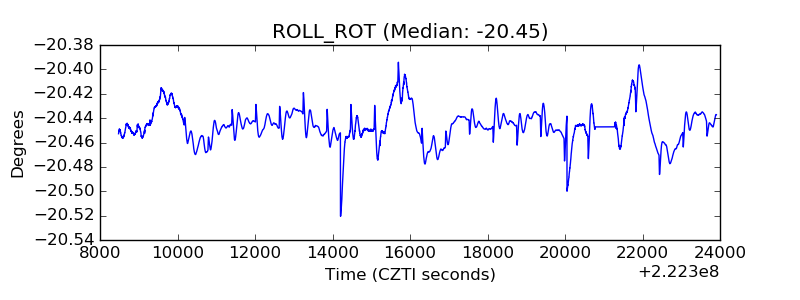 |
| _Roll_DEC | 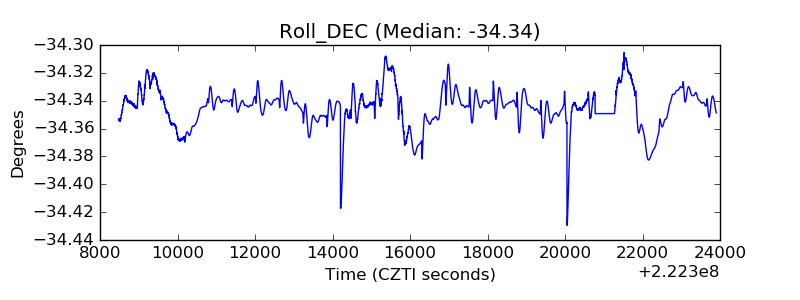 |
| _Roll_RA | 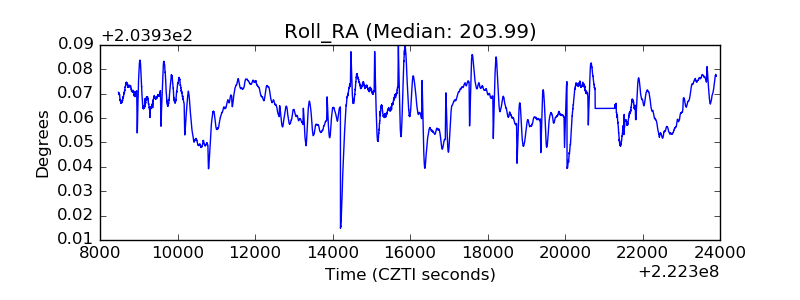 |
| Veto Counter | 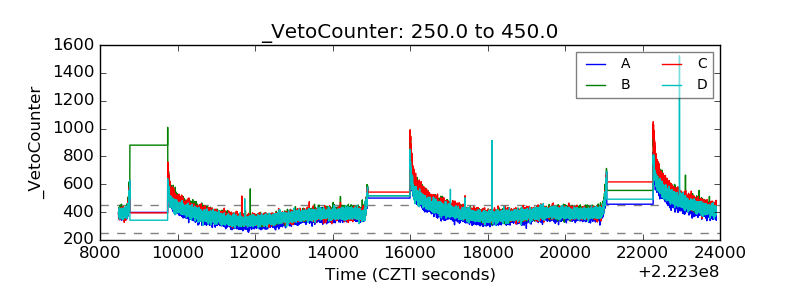 |