| Param | Original file | Final file |
|---|---|---|
| Filename | modeM0/AS1A02_155T01_9000000966_07062cztM0_level2.evt | modeM0/AS1A02_155T01_9000000966_07062cztM0_level2_quad_clean.evt |
| Size (bytes) | 427,786,560 | 80,403,840 |
| Size | 408.0 MB | 76.7 MB |
| Events in quadrant A | 2,829,360 | 508,121 |
| Events in quadrant B | 2,876,417 | 523,841 |
| Events in quadrant C | 3,654,335 | 502,642 |
| Events in quadrant D | 3,194,963 | 488,224 |
| Mode M0 | |||
|---|---|---|---|
| Quadrant | BADHDUFLAG | Total packets | Discarded packets |
| A | 0 | 12088 | 2 |
| B | 0 | 12161 | 1 |
| C | 0 | 14652 | 1 |
| D | 0 | 13073 | 1 |
| Mode M9 | |||
|---|---|---|---|
| Quadrant | BADHDUFLAG | Total packets | Discarded packets |
| A | 0 | 13 | 0 |
| B | 0 | 13 | 0 |
| C | 0 | 13 | 0 |
| D | 0 | 13 | 0 |
| Mode SS | |||
|---|---|---|---|
| Quadrant | BADHDUFLAG | Total packets | Discarded packets |
| A | 0 | 120 | 0 |
| B | 0 | 120 | 0 |
| C | 0 | 120 | 0 |
| D | 0 | 120 | 0 |
| Quadrant | Total seconds | Saturated seconds | Saturation percentage |
|---|---|---|---|
| A | 5893 | 16 | 0.271509% |
| B | 5893 | 22 | 0.373324% |
| C | 5893 | 229 | 3.885966% |
| D | 5893 | 29 | 0.492109% |
Noise dominated data is calculated using 1-second bins in cleaned event files. If a bin has >2000 counts, and if more than 50% of those come from <1% of pixels, then it is considered to be noise-dominated and hence unusable.
| Quadrant | # 1 sec bins | Bins with >0 counts | Bins with >2000 counts | High rate bins dominated by noise | Noise dominated (total time) | Noise dominated (detector-on time) | Marked lightcurve |
|---|---|---|---|---|---|---|---|
| A | 7153 | 5894 | 0 | 0 | 0.00% | 0.00% | 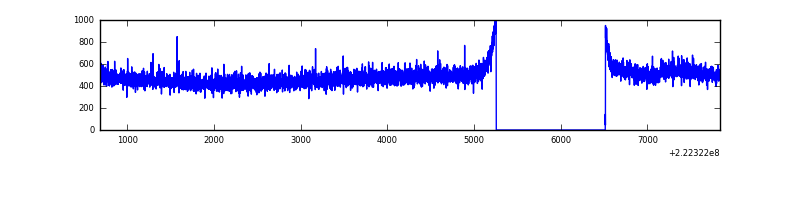 |
| B | 7153 | 5894 | 0 | 0 | 0.00% | 0.00% | 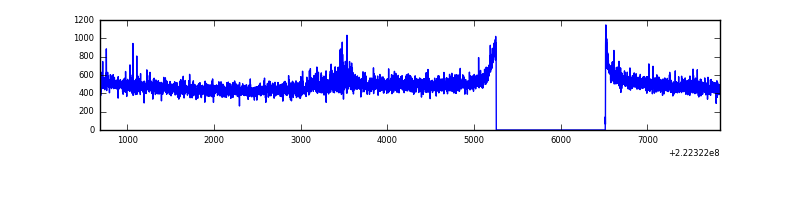 |
| C | 7153 | 5894 | 186 | 186 | 2.60% | 3.16% |  |
| D | 7153 | 5894 | 15 | 15 | 0.21% | 0.25% | 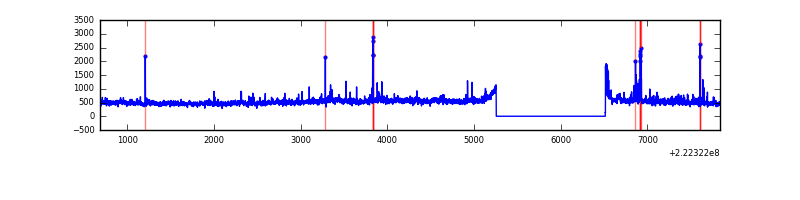 |
Top three noisy pixels from each quadrant. If the there are fewer than three noisy pixels in the level2.evt file, extra rows are filled as -1
| Pixel properties | Quadrant properties | ||||||
|---|---|---|---|---|---|---|---|
| Quadrant | DetID | PixID | Counts | Sigma | Mean | Median | Sigma |
| A | 14 | 111 | 40139 | 271.7 | 720 | 706 | 145.1 |
| A | 8 | 15 | 11032 | 71.15 | 720 | 706 | 145.1 |
| A | 13 | 14 | 7236 | 44.99 | 720 | 706 | 145.1 |
| B | 0 | 214 | 32632 | 233.14 | 728 | 711 | 136.9 |
| B | 0 | 187 | 14228 | 98.72 | 728 | 711 | 136.9 |
| B | 12 | 111 | 12783 | 88.17 | 728 | 711 | 136.9 |
| C | 4 | 254 | 895932 | 5458.29 | 706 | 709 | 164.0 |
| C | 13 | 61 | 5489 | 29.14 | 706 | 709 | 164.0 |
| C | 4 | 238 | 4311 | 21.96 | 706 | 709 | 164.0 |
| D | 8 | 195 | 330438 | 1915.11 | 709 | 688 | 172.2 |
| D | 12 | 233 | 110218 | 636.12 | 709 | 688 | 172.2 |
| D | 7 | 55 | 21468 | 120.69 | 709 | 688 | 172.2 |
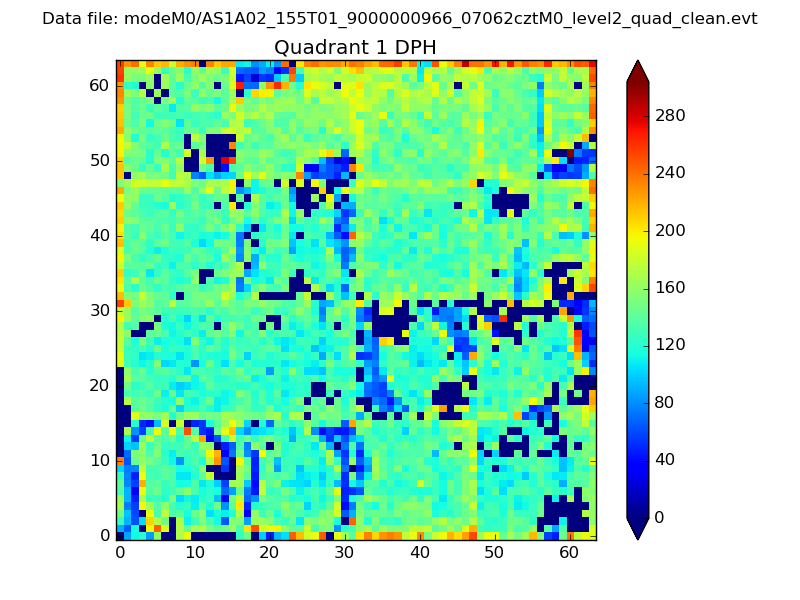
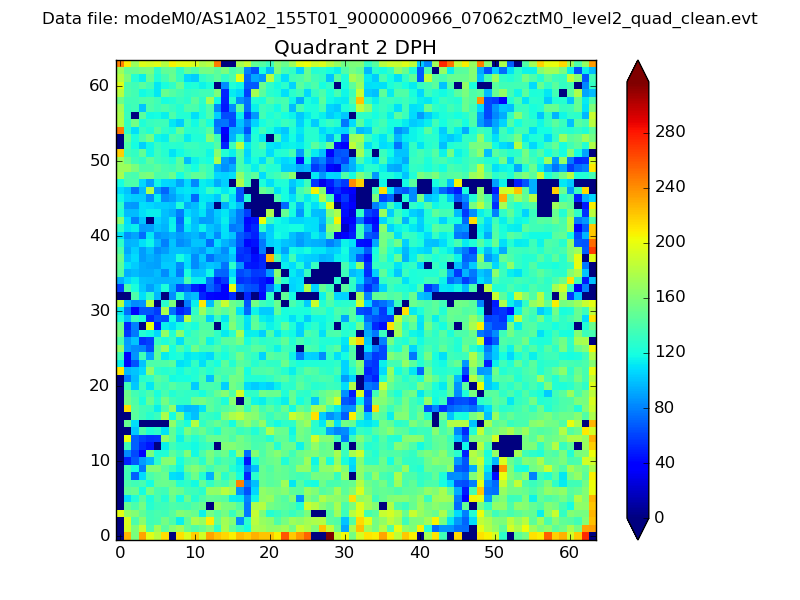
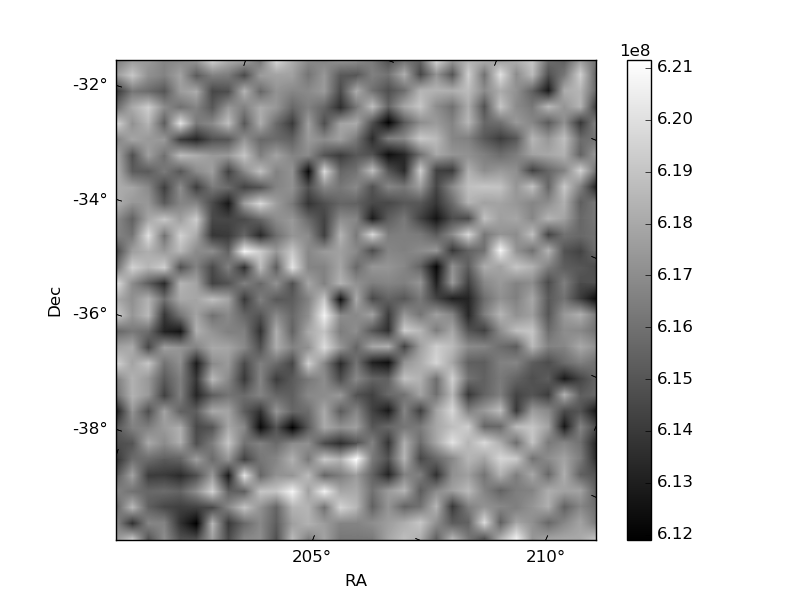
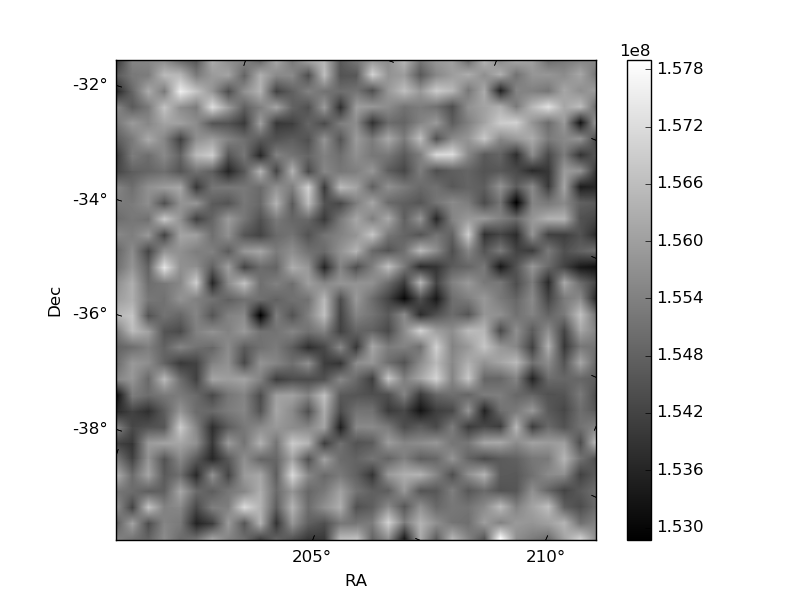
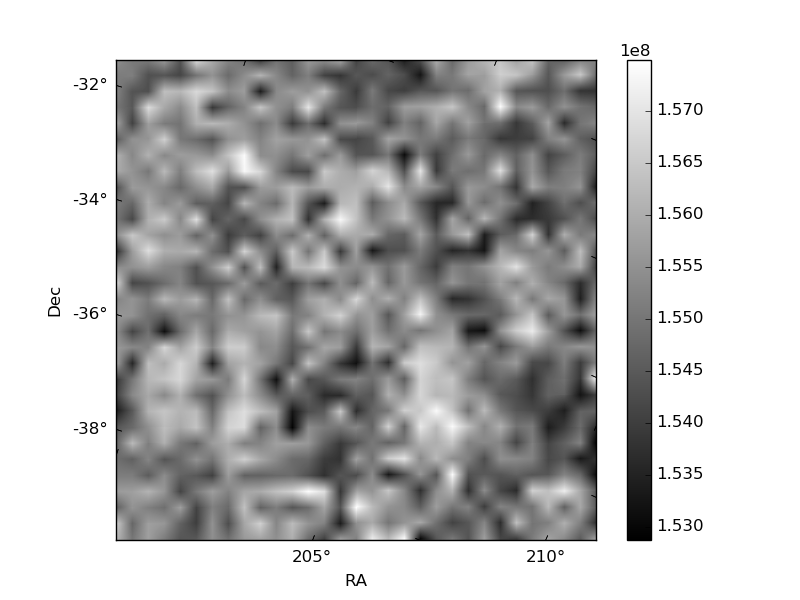
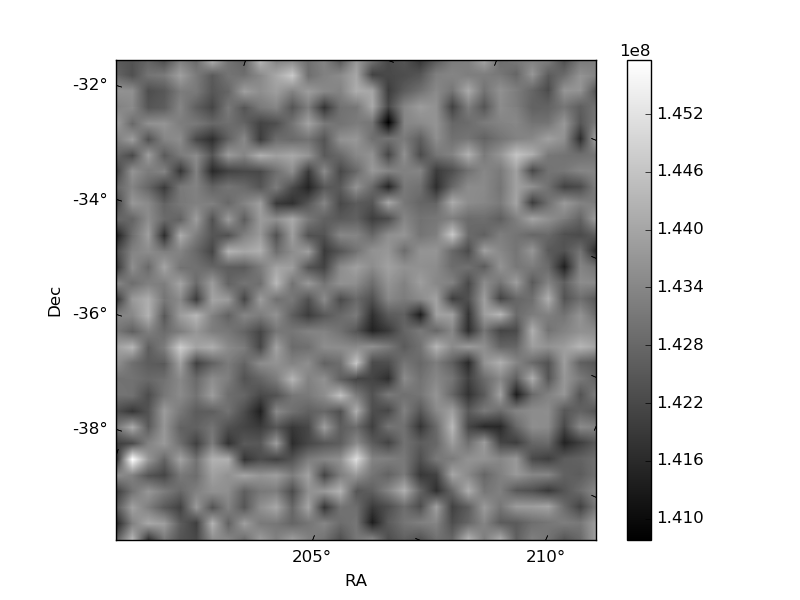
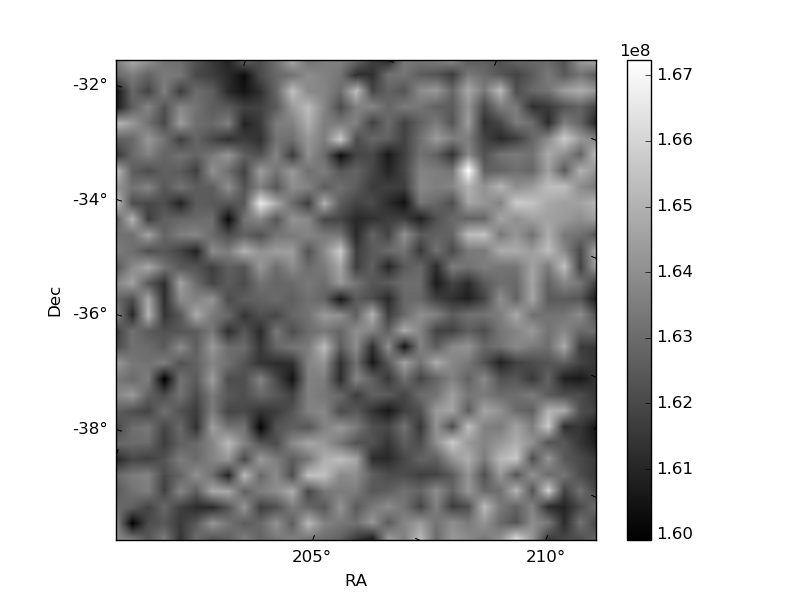
Histogram calculated using DETX and DETY for each event in the final _common_clean file
| Quadrant A | 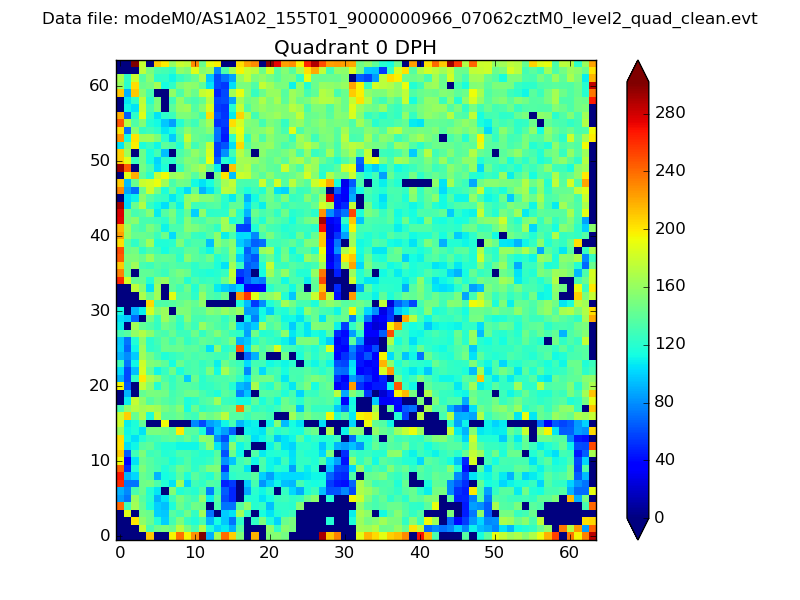 |
 |
Quadrant B |
|---|---|---|---|
| Quadrant D | 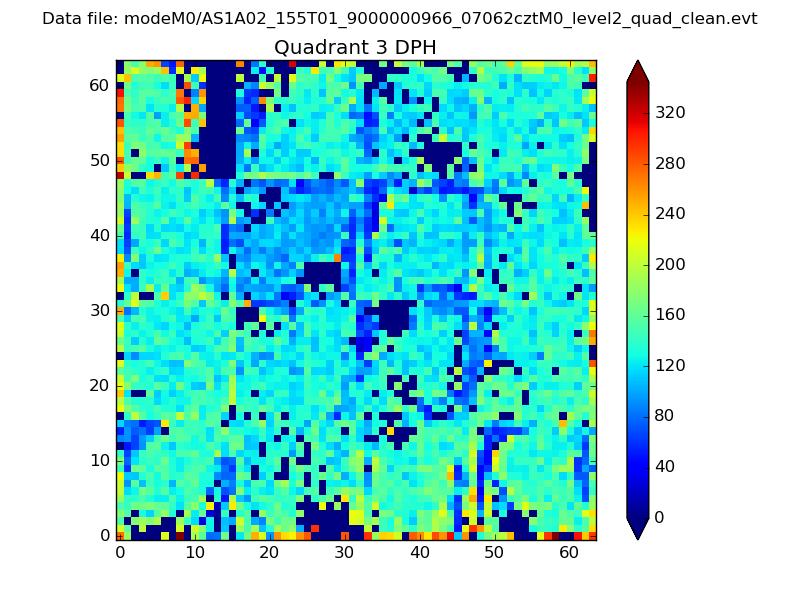 |
 |
Quadrant C |
| Plot type | Count rate plots | Images |
|---|---|---|
| Comparison with Poisson distribution Blue bars denote a histogram of data divided into 1 sec bins. Red curve is a Poisson curve with rate = median count rate of data. |
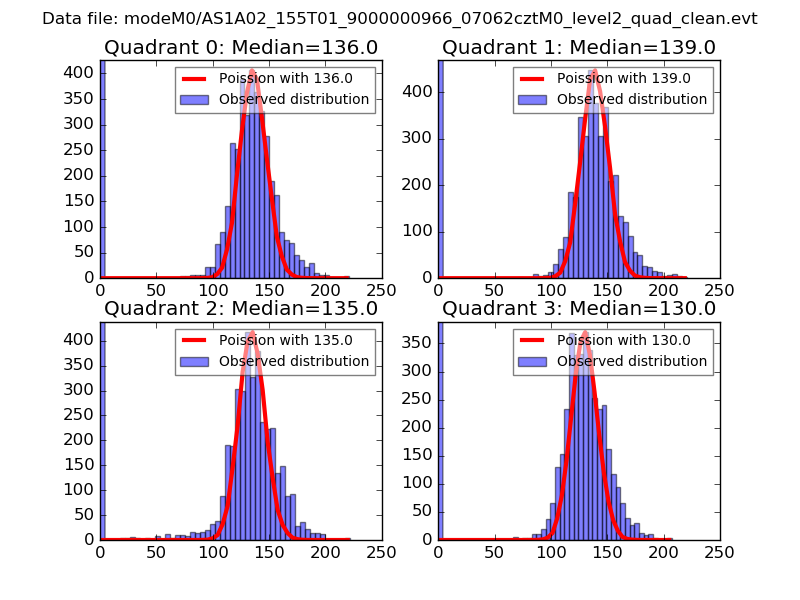 |
 |
| Quadrant-wise count rates Data is divided into 100 sec bins |
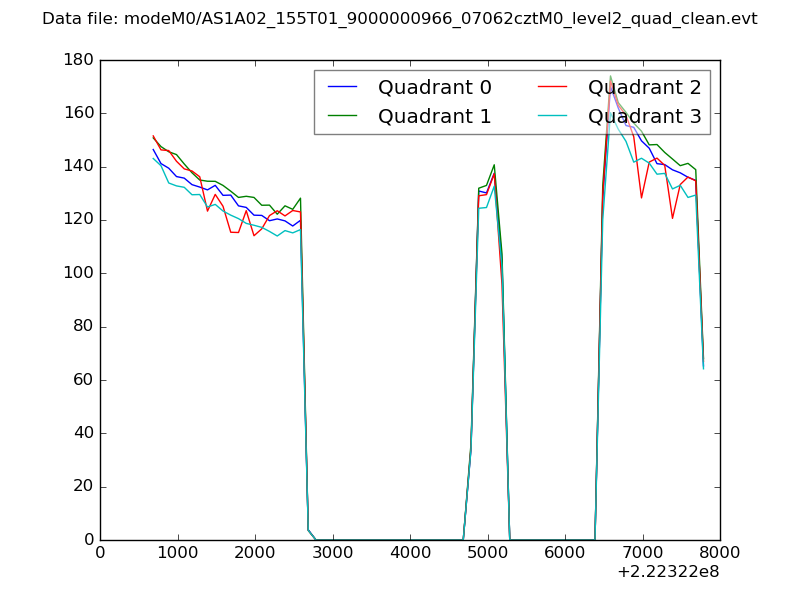 |
|
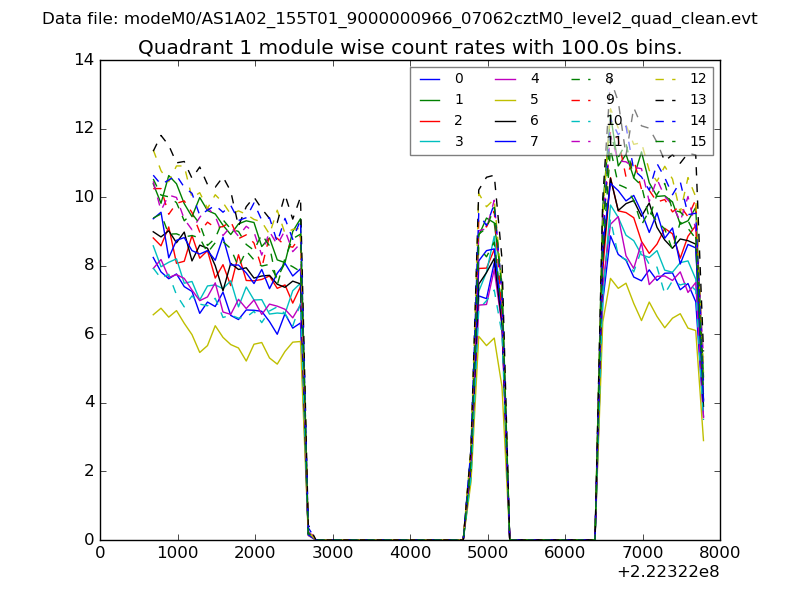
| Module-wise count rates for Quadrant A Data is divided into 100 sec bins |
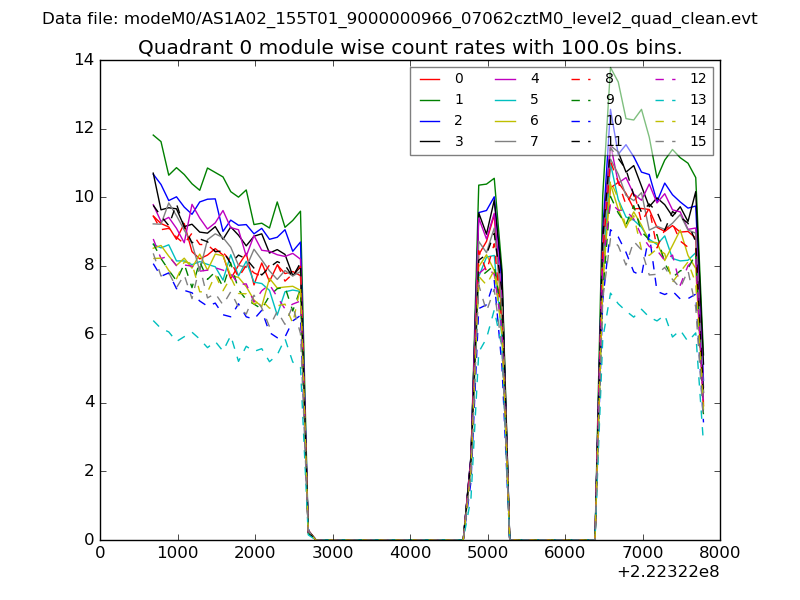 |
 |
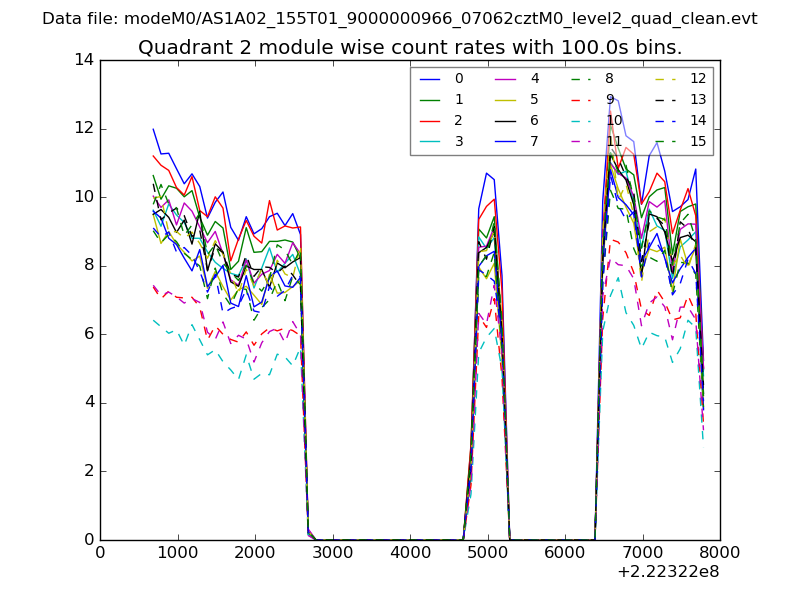
| Module-wise count rates for Quadrant B Data is divided into 100 sec bins |
 |
 |
| Module-wise count rates for Quadrant C Data is divided into 100 sec bins |
 |
 |
| Module-wise count rates for Quadrant D Data is divided into 100 sec bins |
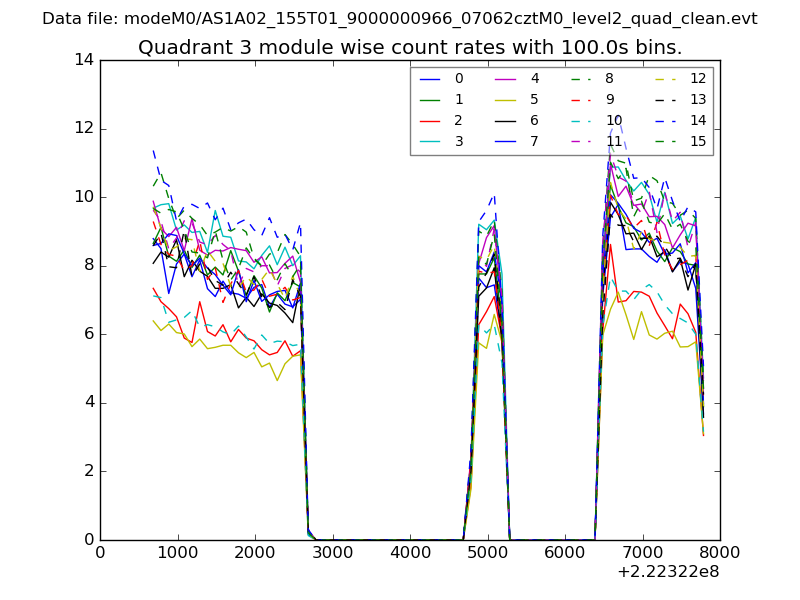 |
 |
| Parameter | Plot |
|---|---|
| CZT HV Monitor | 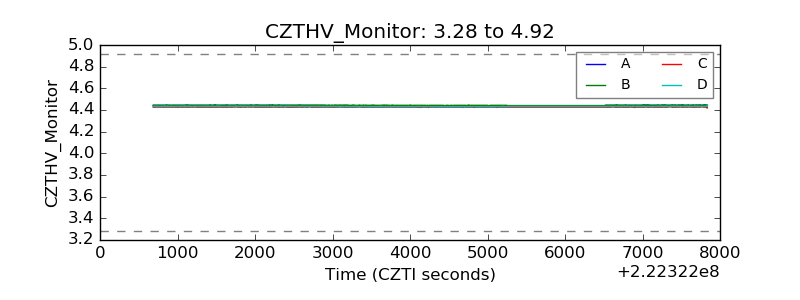 |
| D_VDD | 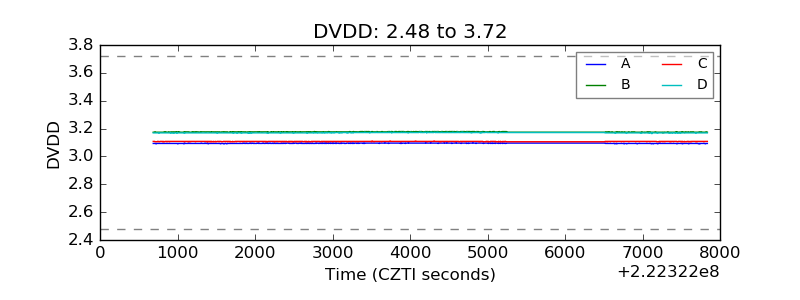 |
| Temperature 1 | 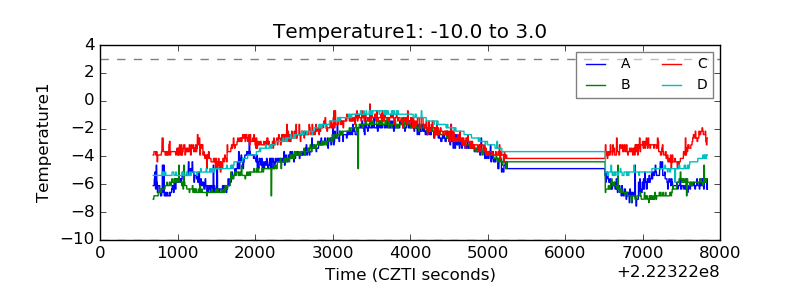 |
| Veto HV Monitor |  |
| Veto LLD |  |
| Alpha Counter | 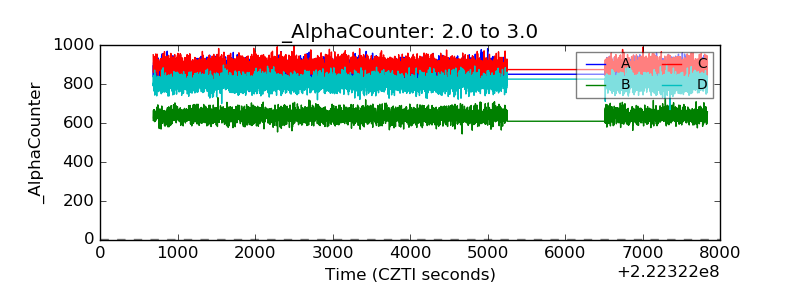 |
| _CPM_Rate | 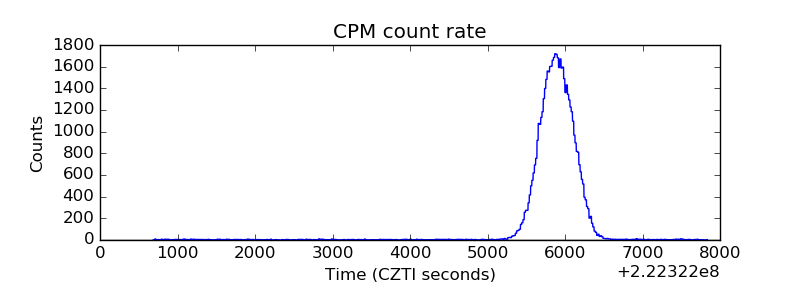 |
| CZT Counter | 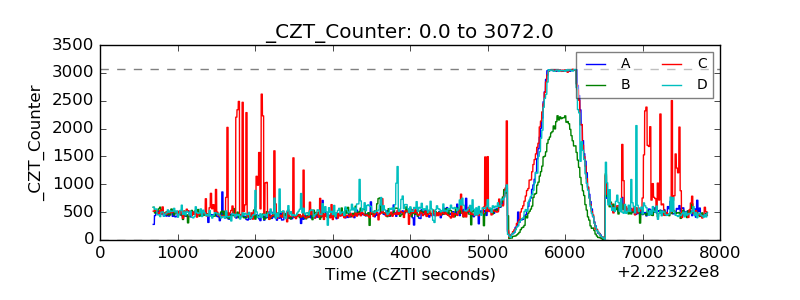 |
| +2.5 Volts monitor |  |
| +5 Volts monitor |  |
| _ROLL_ROT | 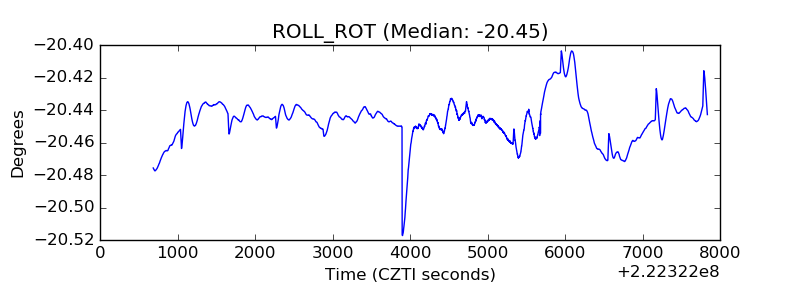 |
| _Roll_DEC | 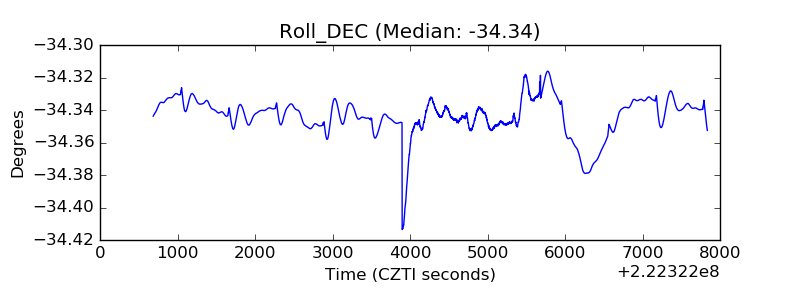 |
| _Roll_RA | 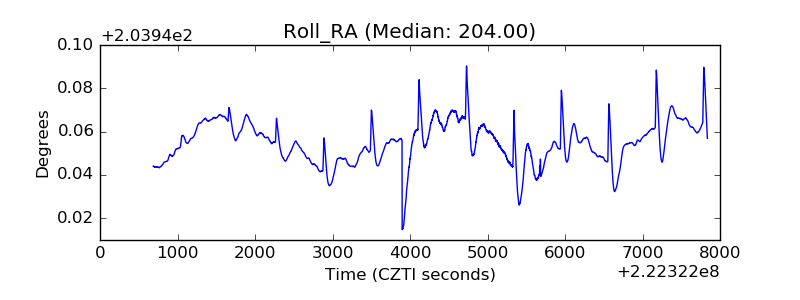 |
| Veto Counter | 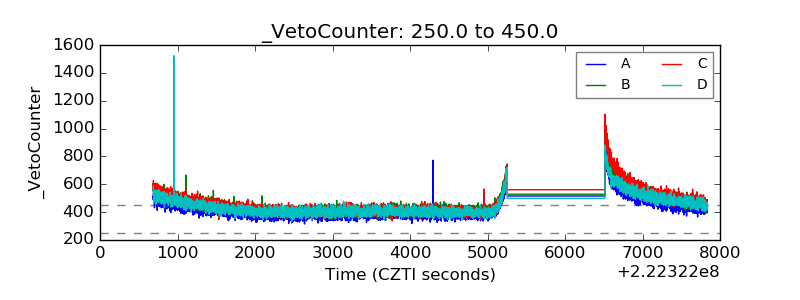 |