| Param | Original file | Final file |
|---|---|---|
| Filename | modeM0/AS1A02_155T01_9000000966_07064cztM0_level2.evt | modeM0/AS1A02_155T01_9000000966_07064cztM0_level2_quad_clean.evt |
| Size (bytes) | 424,258,560 | 83,401,920 |
| Size | 404.6 MB | 79.5 MB |
| Events in quadrant A | 2,930,362 | 526,504 |
| Events in quadrant B | 3,076,320 | 538,788 |
| Events in quadrant C | 3,213,535 | 530,495 |
| Events in quadrant D | 3,213,057 | 503,253 |
| Mode M0 | |||
|---|---|---|---|
| Quadrant | BADHDUFLAG | Total packets | Discarded packets |
| A | 0 | 12531 | 2 |
| B | 0 | 12833 | 1 |
| C | 0 | 13436 | 1 |
| D | 0 | 13229 | 1 |
| Mode M9 | |||
|---|---|---|---|
| Quadrant | BADHDUFLAG | Total packets | Discarded packets |
| A | 0 | 12 | 0 |
| B | 0 | 12 | 0 |
| C | 0 | 12 | 0 |
| D | 0 | 12 | 0 |
| Mode SS | |||
|---|---|---|---|
| Quadrant | BADHDUFLAG | Total packets | Discarded packets |
| A | 0 | 124 | 0 |
| B | 0 | 124 | 0 |
| C | 0 | 124 | 0 |
| D | 0 | 124 | 0 |
| Quadrant | Total seconds | Saturated seconds | Saturation percentage |
|---|---|---|---|
| A | 6110 | 67 | 1.096563% |
| B | 6110 | 67 | 1.096563% |
| C | 6110 | 94 | 1.538462% |
| D | 6110 | 96 | 1.571195% |
Noise dominated data is calculated using 1-second bins in cleaned event files. If a bin has >2000 counts, and if more than 50% of those come from <1% of pixels, then it is considered to be noise-dominated and hence unusable.
| Quadrant | # 1 sec bins | Bins with >0 counts | Bins with >2000 counts | High rate bins dominated by noise | Noise dominated (total time) | Noise dominated (detector-on time) | Marked lightcurve |
|---|---|---|---|---|---|---|---|
| A | 7325 | 6111 | 1 | 1 | 0.01% | 0.02% | 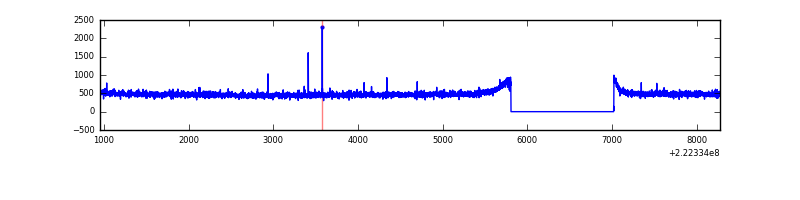 |
| B | 7325 | 6111 | 0 | 0 | 0.00% | 0.00% | 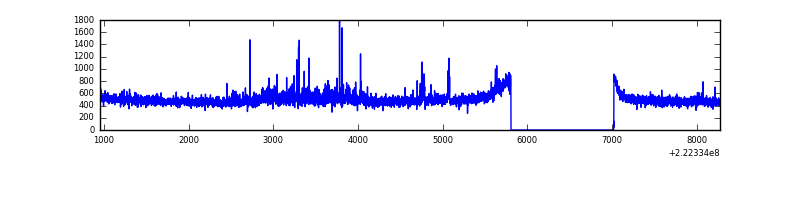 |
| C | 7325 | 6111 | 37 | 37 | 0.51% | 0.61% | 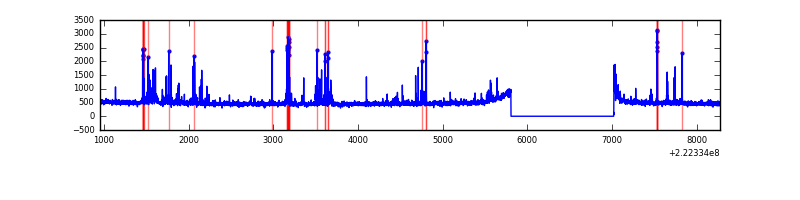 |
| D | 7325 | 6111 | 45 | 45 | 0.61% | 0.74% | 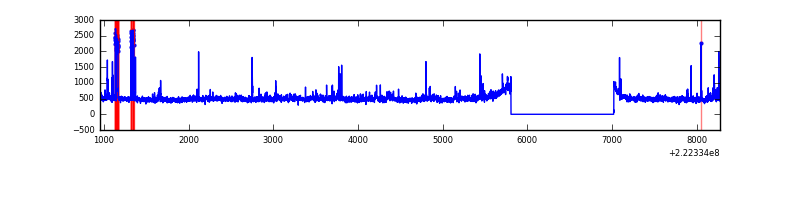 |
Top three noisy pixels from each quadrant. If the there are fewer than three noisy pixels in the level2.evt file, extra rows are filled as -1
| Pixel properties | Quadrant properties | ||||||
|---|---|---|---|---|---|---|---|
| Quadrant | DetID | PixID | Counts | Sigma | Mean | Median | Sigma |
| A | 13 | 14 | 9990 | 60.33 | 757 | 740 | 153.3 |
| A | 8 | 15 | 7817 | 46.15 | 757 | 740 | 153.3 |
| A | 0 | 226 | 7535 | 44.31 | 757 | 740 | 153.3 |
| B | 0 | 214 | 110030 | 759.3 | 758 | 741 | 143.9 |
| B | 12 | 111 | 13697 | 90.01 | 758 | 741 | 143.9 |
| B | 11 | 111 | 10904 | 70.61 | 758 | 741 | 143.9 |
| C | 4 | 254 | 315071 | 1837.62 | 741 | 746 | 171.0 |
| C | 13 | 61 | 5863 | 29.92 | 741 | 746 | 171.0 |
| C | 1 | 3 | 4851 | 24.0 | 741 | 746 | 171.0 |
| D | 8 | 195 | 183521 | 994.78 | 744 | 722 | 183.8 |
| D | 9 | 68 | 114714 | 620.33 | 744 | 722 | 183.8 |
| D | 12 | 233 | 25955 | 137.31 | 744 | 722 | 183.8 |
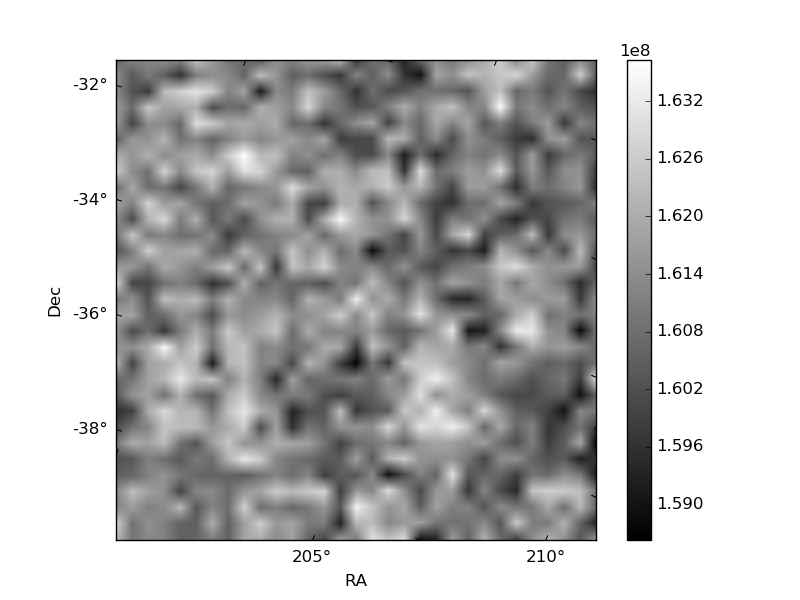
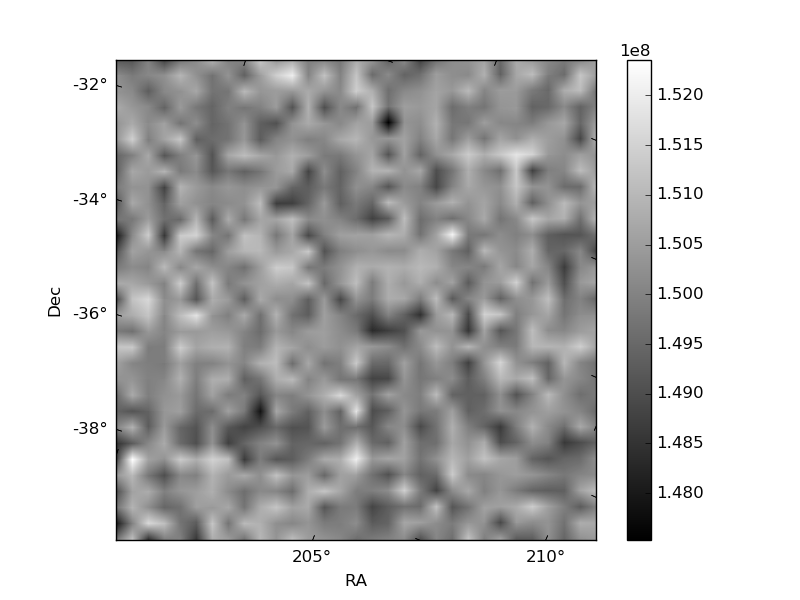
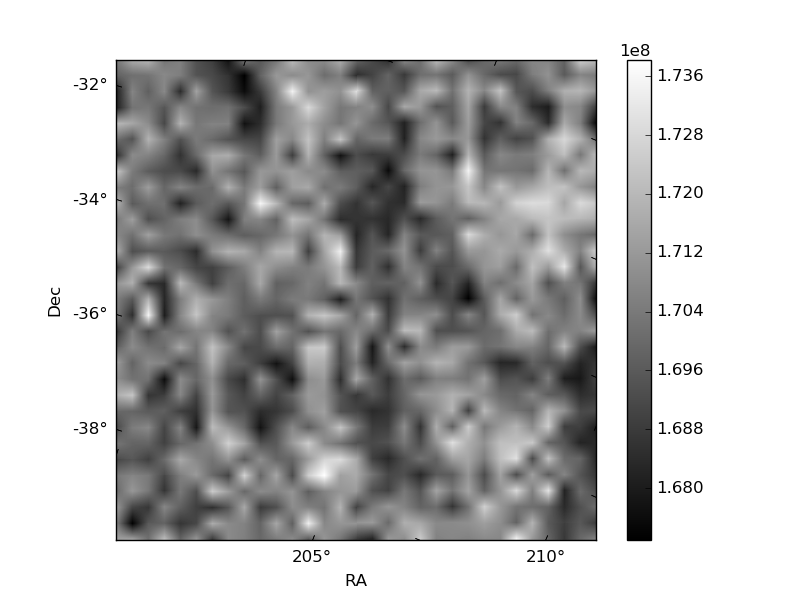
Histogram calculated using DETX and DETY for each event in the final _common_clean file
| Quadrant A | 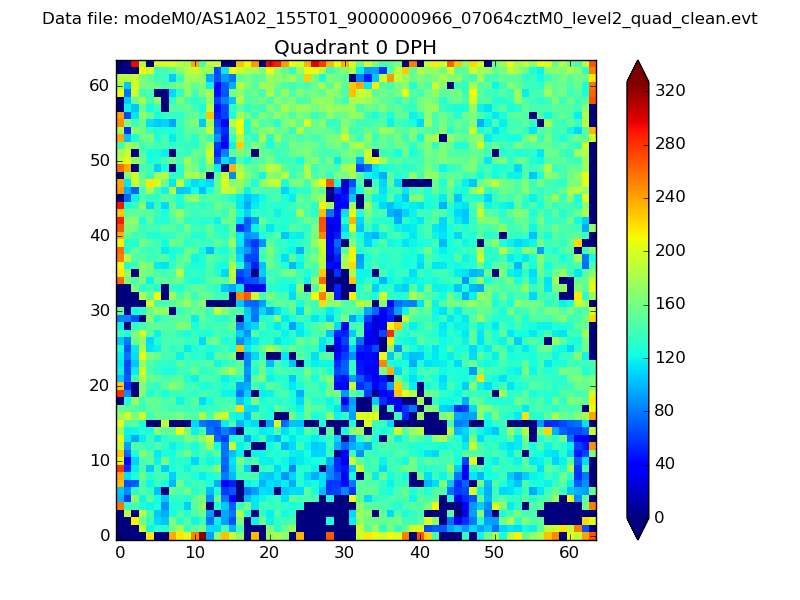 |
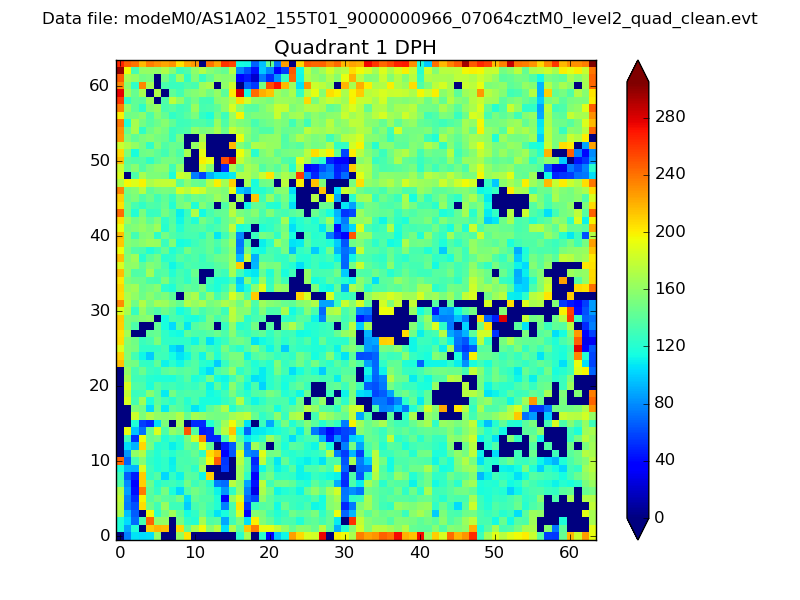 |
Quadrant B |
|---|---|---|---|
| Quadrant D | 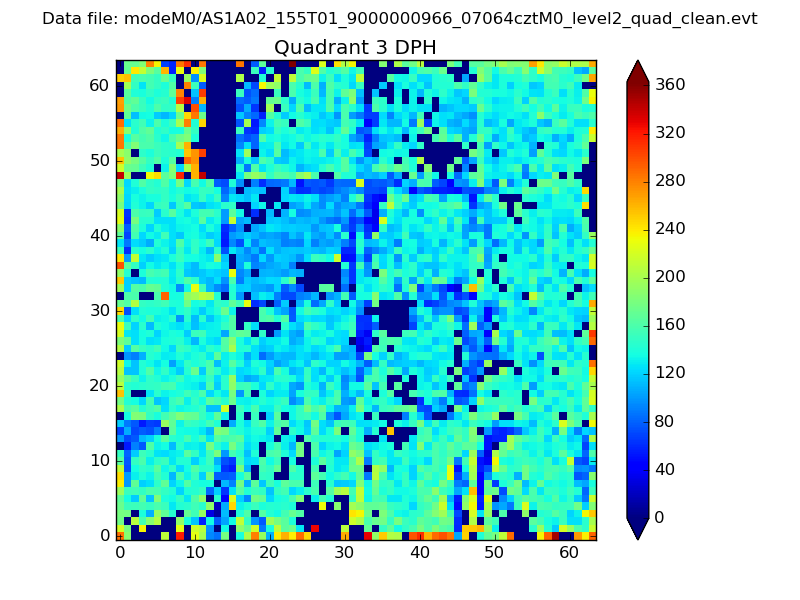 |
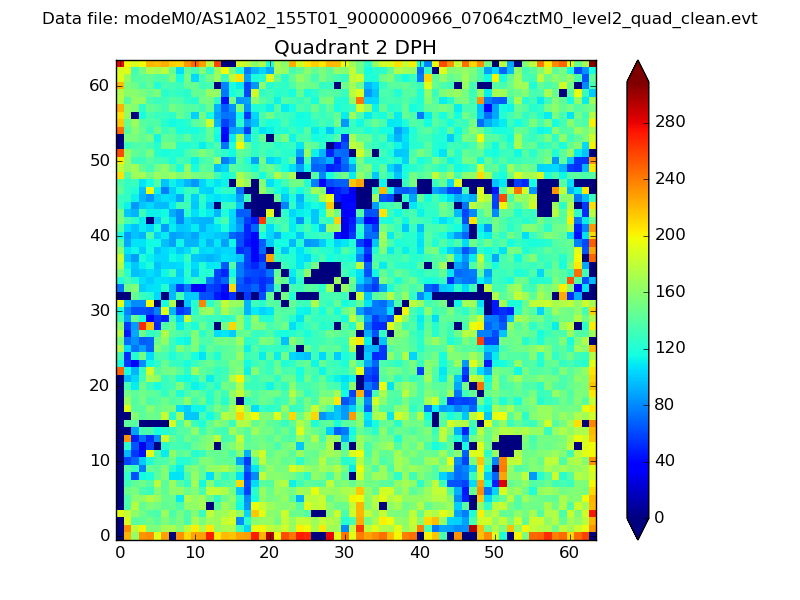 |
Quadrant C |
| Plot type | Count rate plots | Images |
|---|---|---|
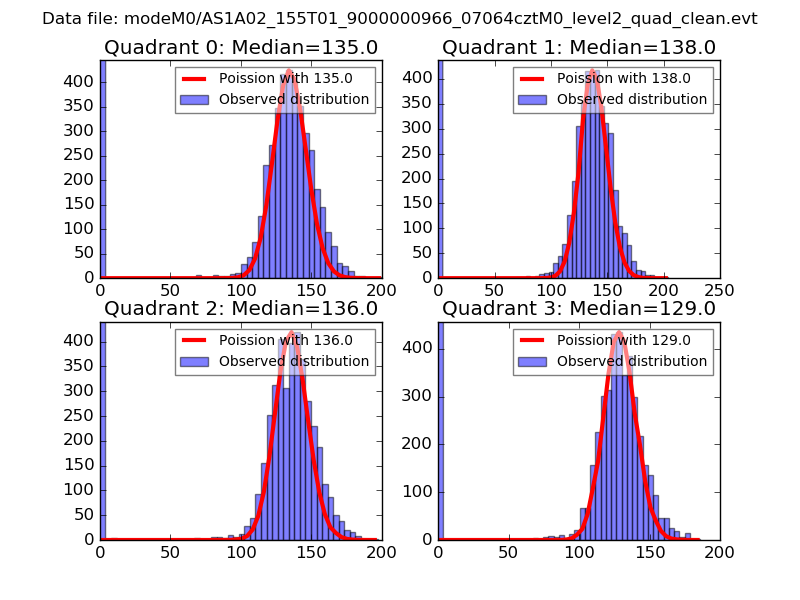
| Comparison with Poisson distribution Blue bars denote a histogram of data divided into 1 sec bins. Red curve is a Poisson curve with rate = median count rate of data. |
 |
 |
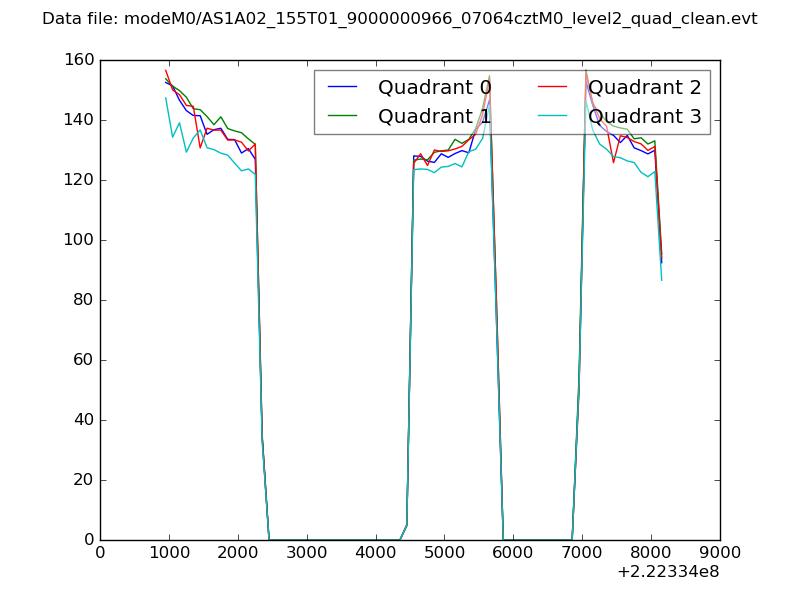
| Quadrant-wise count rates Data is divided into 100 sec bins |
 |
|
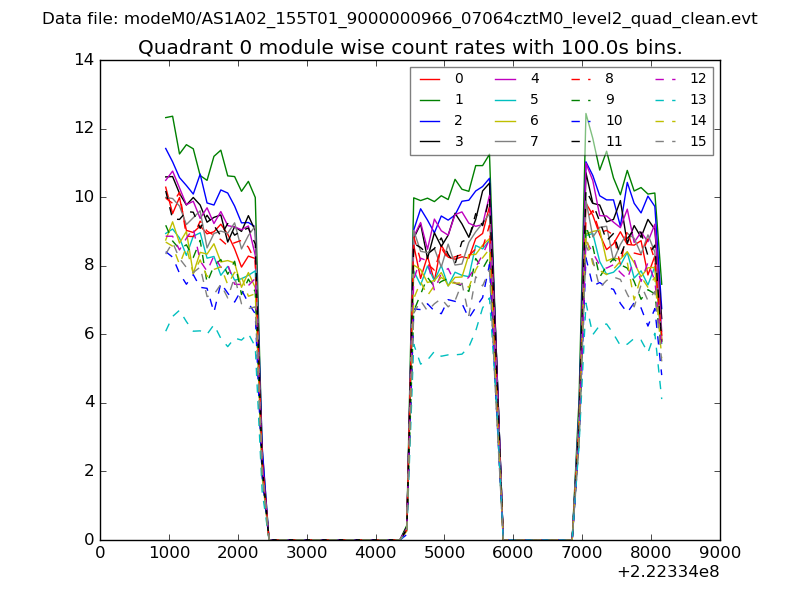
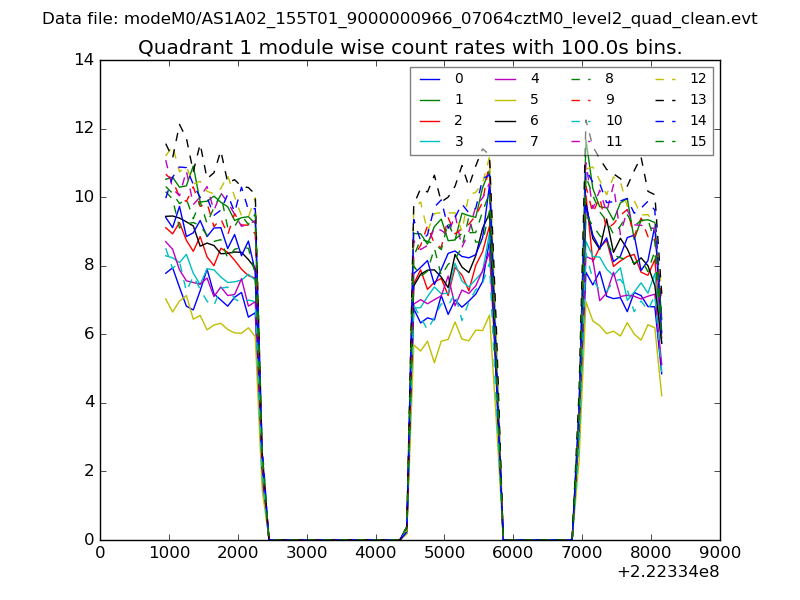
| Module-wise count rates for Quadrant A Data is divided into 100 sec bins |
 |
 |
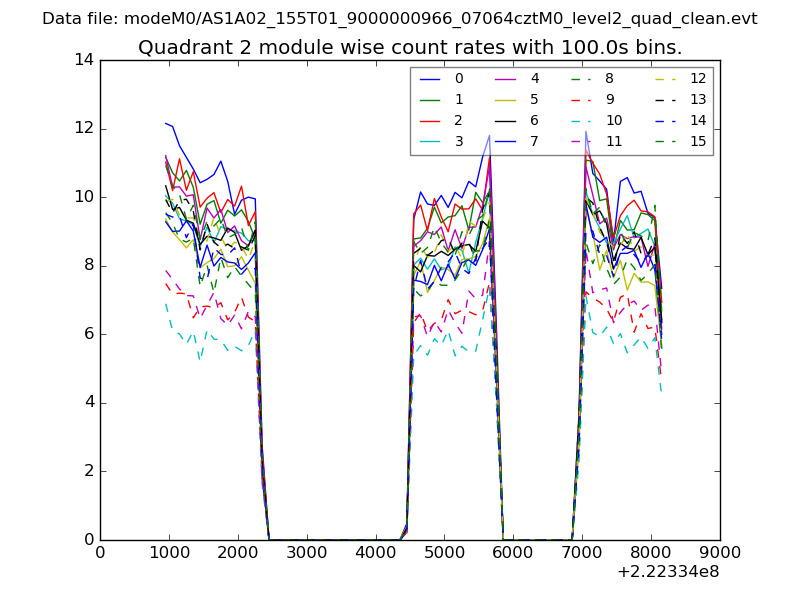
| Module-wise count rates for Quadrant B Data is divided into 100 sec bins |
 |
 |
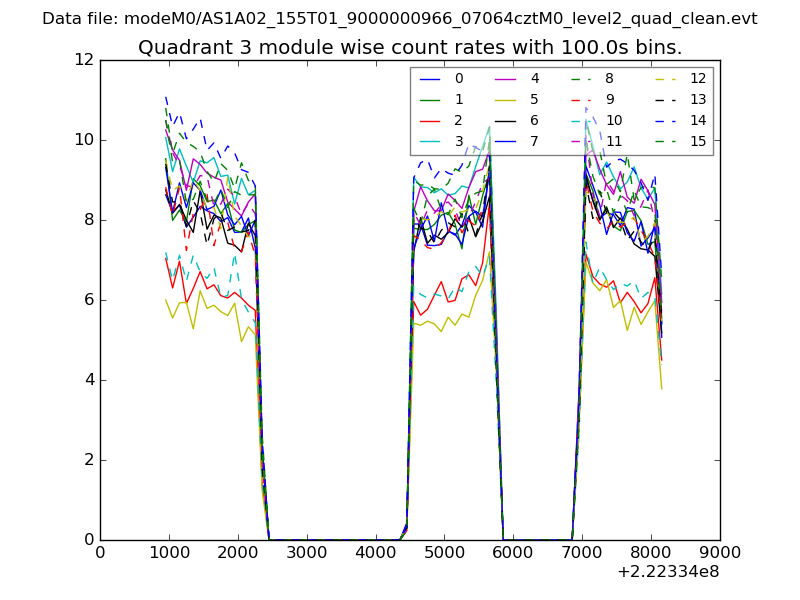
| Module-wise count rates for Quadrant C Data is divided into 100 sec bins |
 |
 |
| Module-wise count rates for Quadrant D Data is divided into 100 sec bins |
 |
 |
| Parameter | Plot |
|---|---|
| CZT HV Monitor | 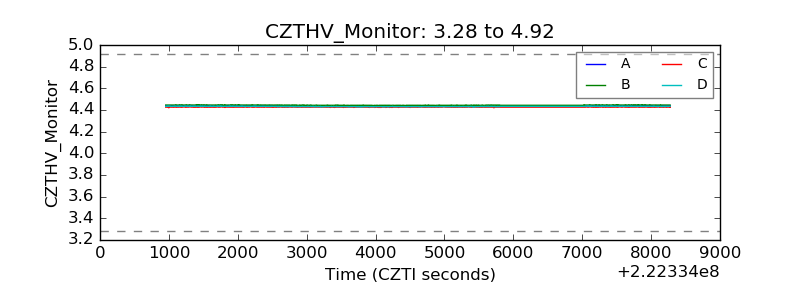 |
| D_VDD | 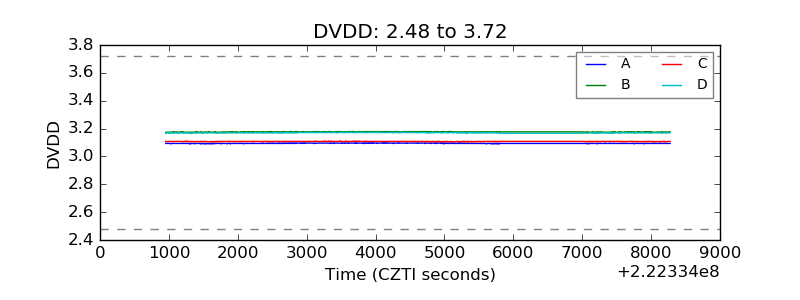 |
| Temperature 1 | 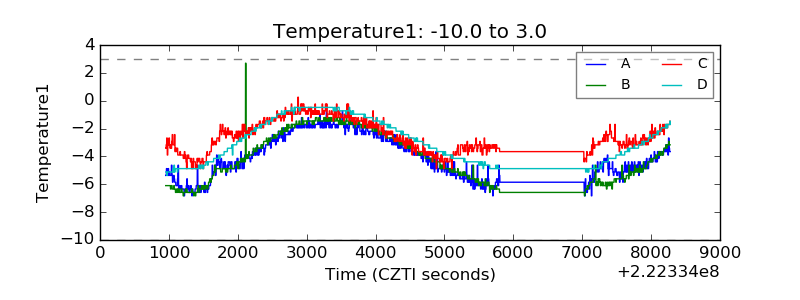 |
| Veto HV Monitor |  |
| Veto LLD | 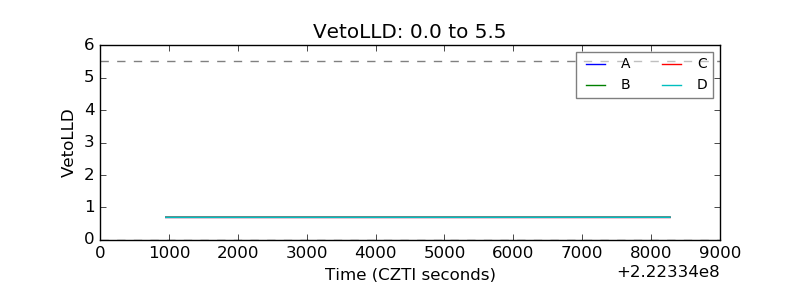 |
| Alpha Counter | 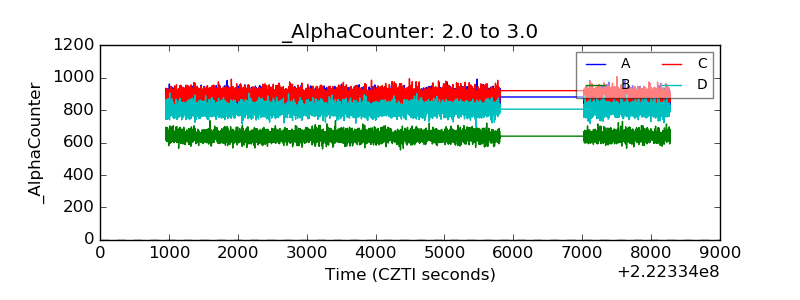 |
| _CPM_Rate | 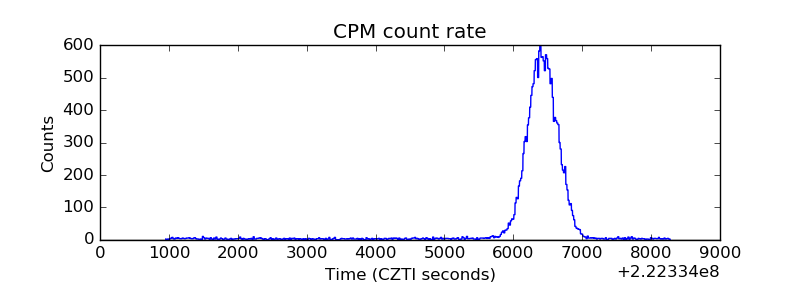 |
| CZT Counter | 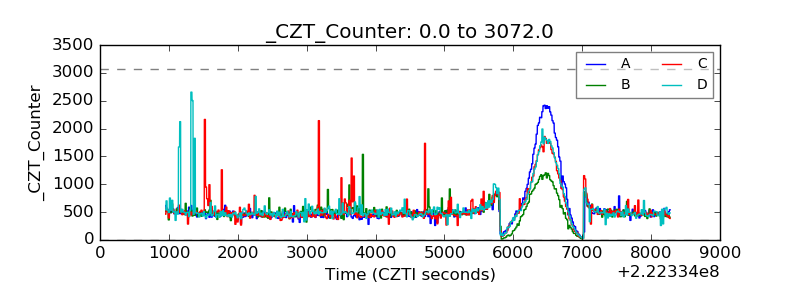 |
| +2.5 Volts monitor |  |
| +5 Volts monitor |  |
| _ROLL_ROT | 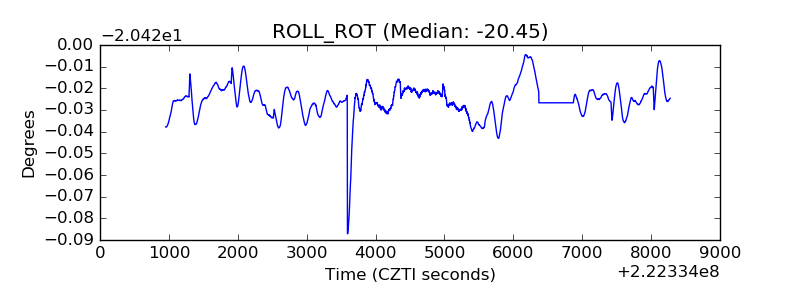 |
| _Roll_DEC | 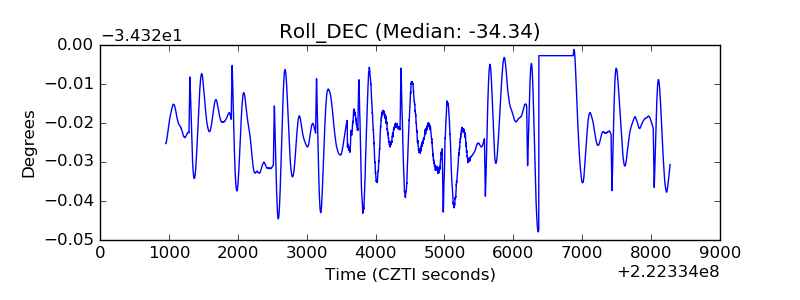 |
| _Roll_RA | 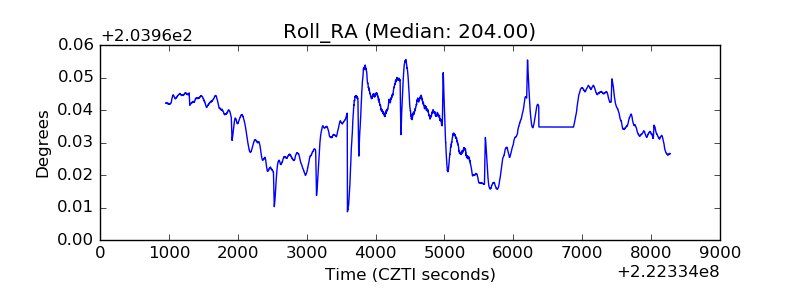 |
| Veto Counter | 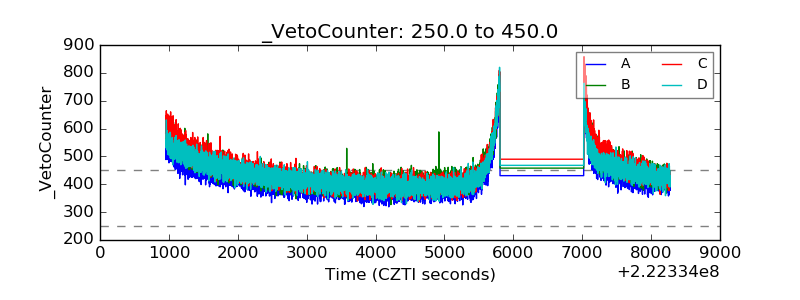 |