| Param | Original file | Final file |
|---|---|---|
| Filename | modeM0/AS1A02_155T01_9000000966_07065cztM0_level2.evt | modeM0/AS1A02_155T01_9000000966_07065cztM0_level2_quad_clean.evt |
| Size (bytes) | 453,438,720 | 81,054,720 |
| Size | 432.4 MB | 77.3 MB |
| Events in quadrant A | 3,169,886 | 502,796 |
| Events in quadrant B | 3,261,806 | 511,656 |
| Events in quadrant C | 3,401,330 | 500,796 |
| Events in quadrant D | 3,453,024 | 481,060 |
| Mode M0 | |||
|---|---|---|---|
| Quadrant | BADHDUFLAG | Total packets | Discarded packets |
| A | 0 | 13575 | 3 |
| B | 0 | 13835 | 2 |
| C | 0 | 14453 | 2 |
| D | 0 | 14140 | 2 |
| Mode M9 | |||
|---|---|---|---|
| Quadrant | BADHDUFLAG | Total packets | Discarded packets |
| A | 0 | 11 | 0 |
| B | 0 | 11 | 0 |
| C | 0 | 11 | 0 |
| D | 0 | 12 | 0 |
| Mode SS | |||
|---|---|---|---|
| Quadrant | BADHDUFLAG | Total packets | Discarded packets |
| A | 0 | 134 | 0 |
| B | 0 | 134 | 0 |
| C | 0 | 134 | 0 |
| D | 0 | 134 | 0 |
| Quadrant | Total seconds | Saturated seconds | Saturation percentage |
|---|---|---|---|
| A | 6566 | 107 | 1.629607% |
| B | 6566 | 104 | 1.583917% |
| C | 6566 | 142 | 2.162656% |
| D | 6566 | 103 | 1.568687% |
Noise dominated data is calculated using 1-second bins in cleaned event files. If a bin has >2000 counts, and if more than 50% of those come from <1% of pixels, then it is considered to be noise-dominated and hence unusable.
| Quadrant | # 1 sec bins | Bins with >0 counts | Bins with >2000 counts | High rate bins dominated by noise | Noise dominated (total time) | Noise dominated (detector-on time) | Marked lightcurve |
|---|---|---|---|---|---|---|---|
| A | 7591 | 6567 | 0 | 0 | 0.00% | 0.00% | 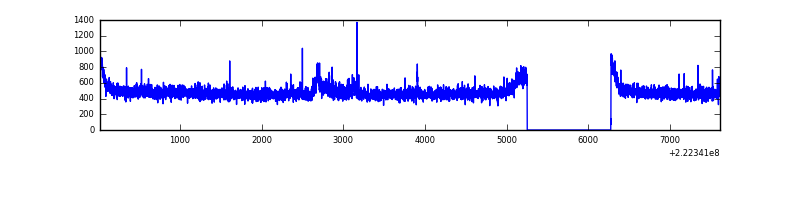 |
| B | 7591 | 6567 | 13 | 13 | 0.17% | 0.20% | 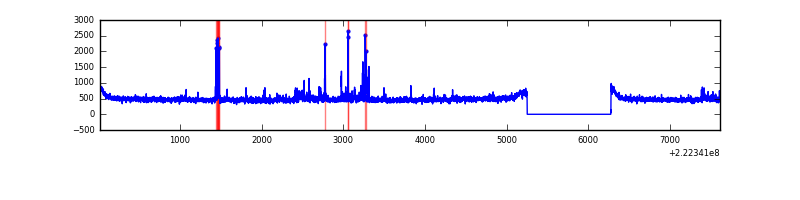 |
| C | 7591 | 6567 | 59 | 59 | 0.78% | 0.90% | 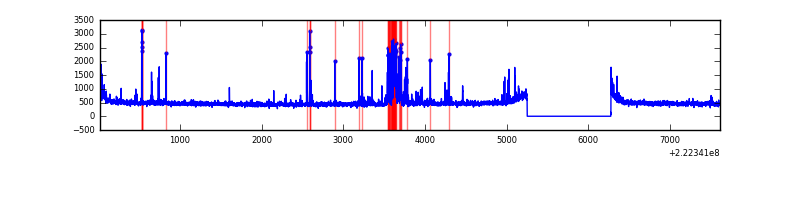 |
| D | 7591 | 6567 | 15 | 15 | 0.20% | 0.23% | 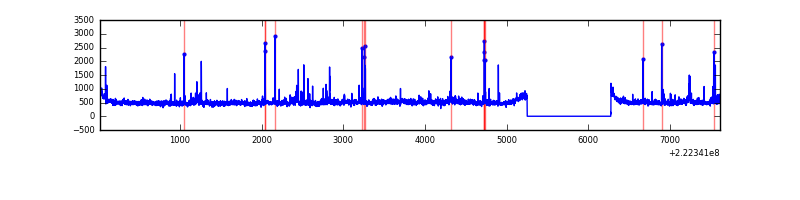 |
Top three noisy pixels from each quadrant. If the there are fewer than three noisy pixels in the level2.evt file, extra rows are filled as -1
| Pixel properties | Quadrant properties | ||||||
|---|---|---|---|---|---|---|---|
| Quadrant | DetID | PixID | Counts | Sigma | Mean | Median | Sigma |
| A | 14 | 238 | 47287 | 287.37 | 798 | 781 | 161.8 |
| A | 8 | 15 | 33557 | 202.53 | 798 | 781 | 161.8 |
| A | 13 | 14 | 16971 | 100.04 | 798 | 781 | 161.8 |
| B | 4 | 239 | 79257 | 517.73 | 796 | 777 | 151.6 |
| B | 0 | 214 | 64899 | 423.01 | 796 | 777 | 151.6 |
| B | 4 | 81 | 19899 | 126.15 | 796 | 777 | 151.6 |
| C | 4 | 254 | 365050 | 2022.11 | 777 | 780 | 180.1 |
| C | 13 | 61 | 6045 | 29.23 | 777 | 780 | 180.1 |
| C | 4 | 238 | 2531 | 9.72 | 777 | 780 | 180.1 |
| D | 8 | 195 | 312871 | 1638.09 | 782 | 759 | 190.5 |
| D | 2 | 14 | 37529 | 192.98 | 782 | 759 | 190.5 |
| D | 12 | 233 | 36616 | 188.19 | 782 | 759 | 190.5 |
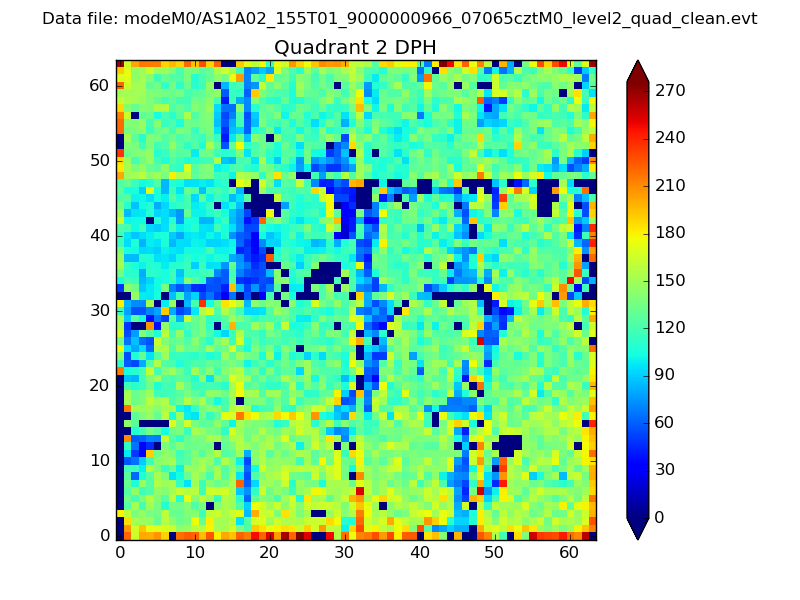
Histogram calculated using DETX and DETY for each event in the final _common_clean file
| Quadrant A | 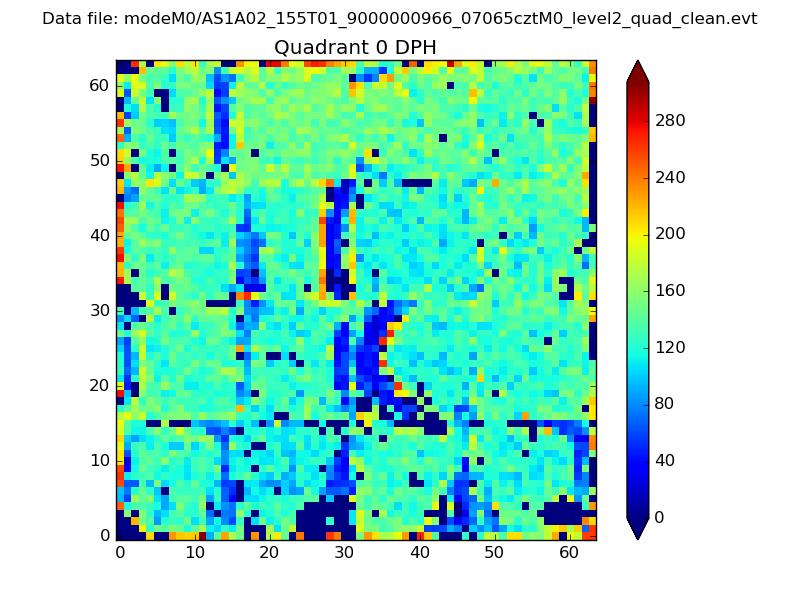 |
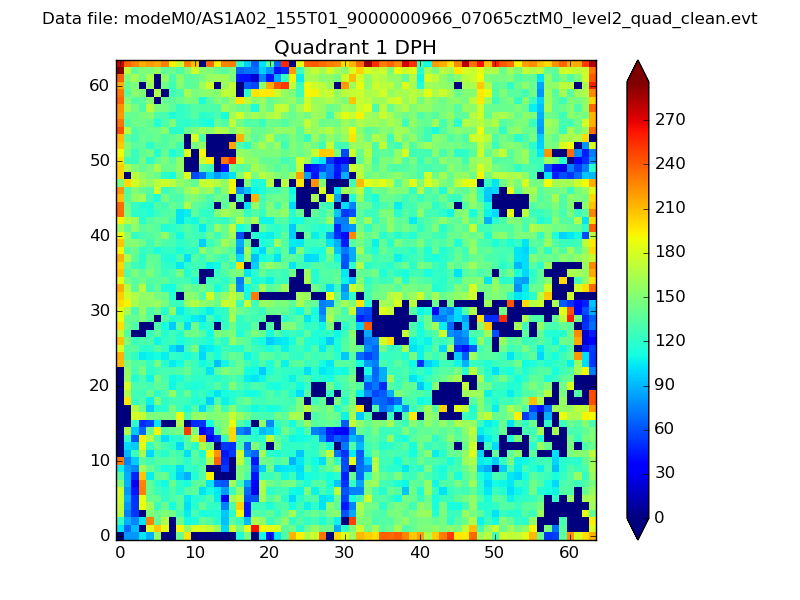 |
Quadrant B |
|---|---|---|---|
| Quadrant D | 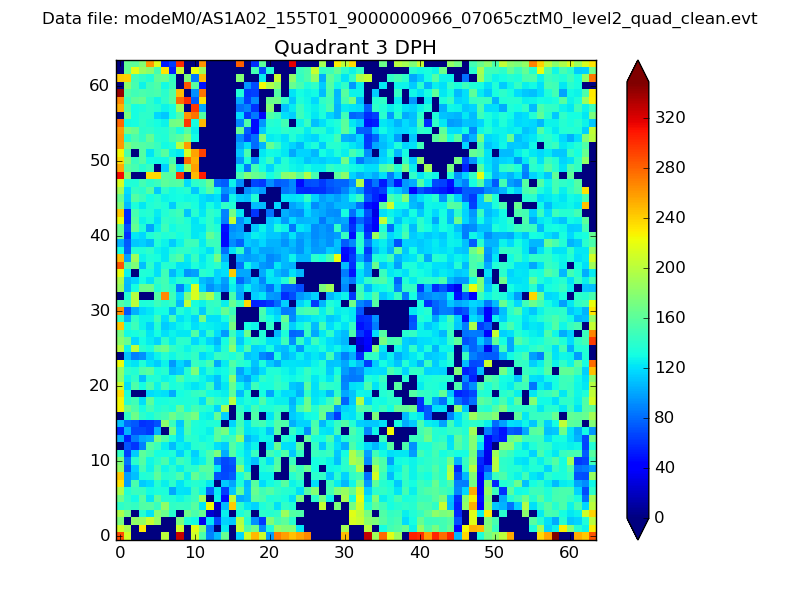 |
 |
Quadrant C |
| Plot type | Count rate plots | Images |
|---|---|---|
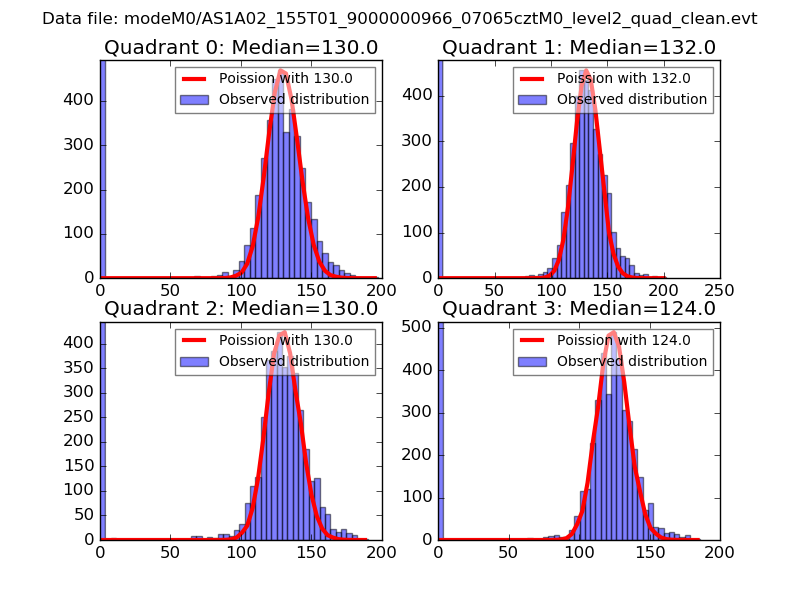
| Comparison with Poisson distribution Blue bars denote a histogram of data divided into 1 sec bins. Red curve is a Poisson curve with rate = median count rate of data. |
 |
 |
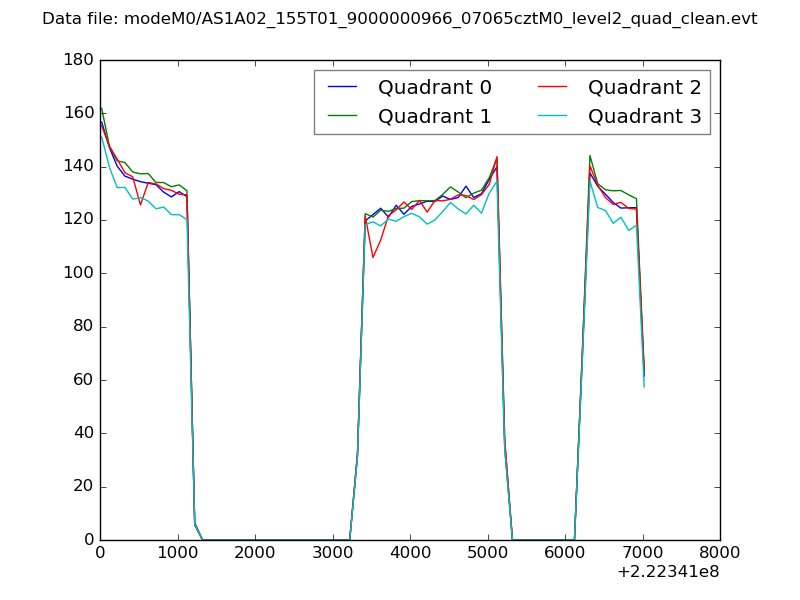
| Quadrant-wise count rates Data is divided into 100 sec bins |
 |
|
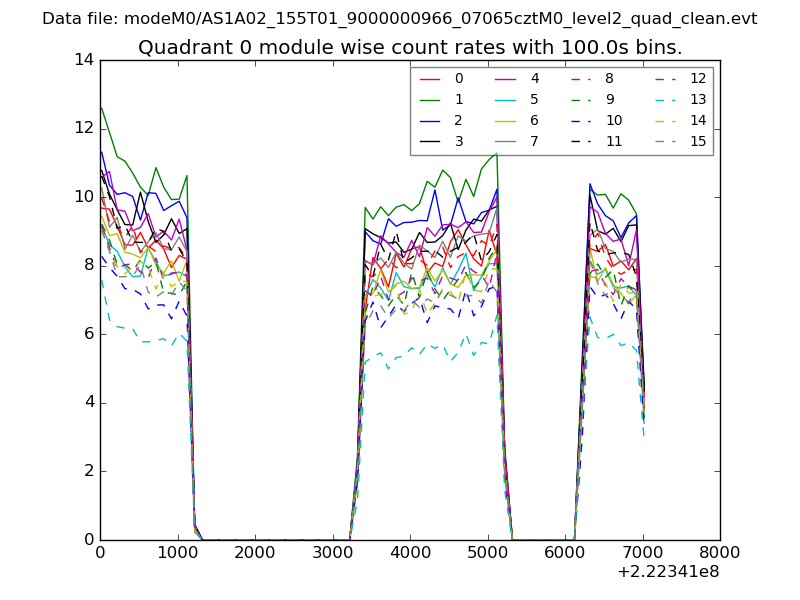
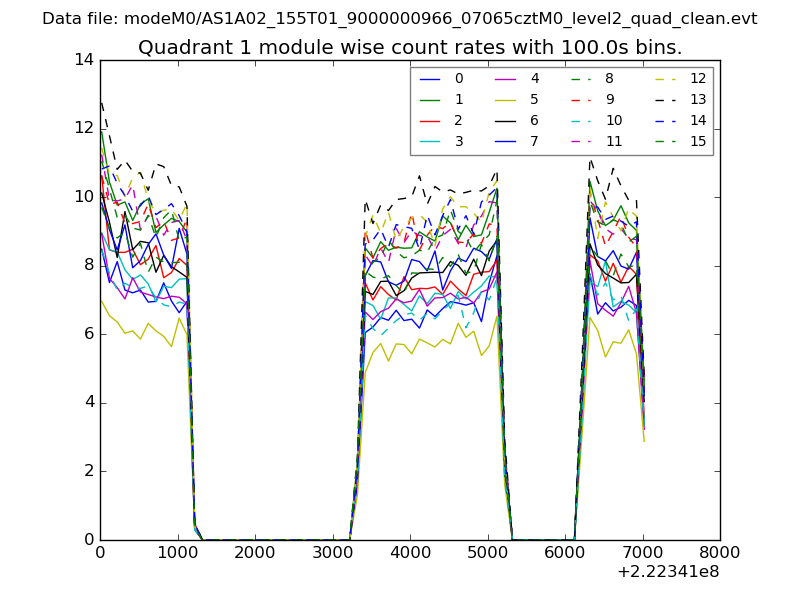
| Module-wise count rates for Quadrant A Data is divided into 100 sec bins |
 |
 |
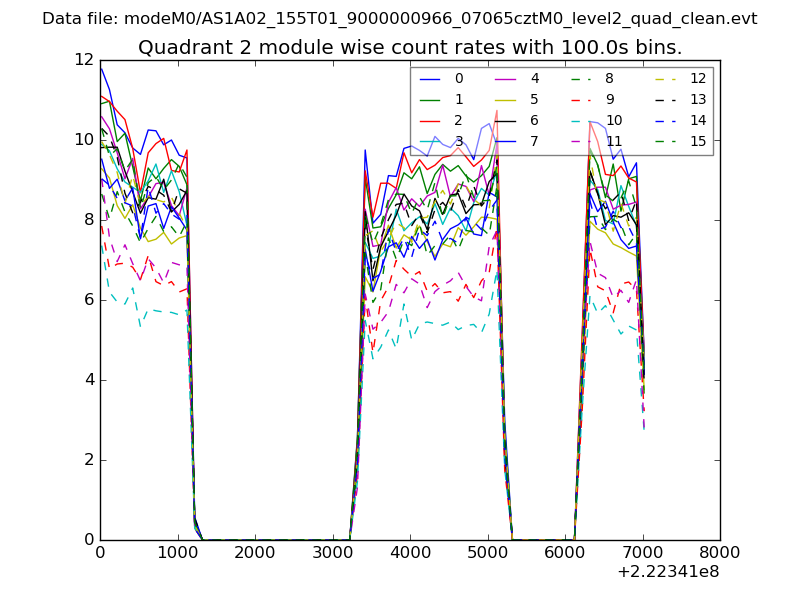
| Module-wise count rates for Quadrant B Data is divided into 100 sec bins |
 |
 |
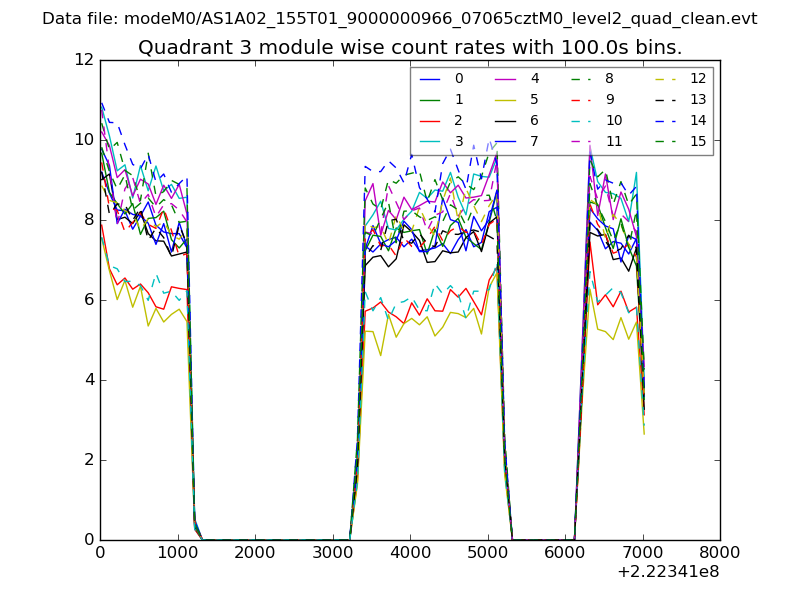
| Module-wise count rates for Quadrant C Data is divided into 100 sec bins |
 |
 |
| Module-wise count rates for Quadrant D Data is divided into 100 sec bins |
 |
 |
| Parameter | Plot |
|---|---|
| CZT HV Monitor | 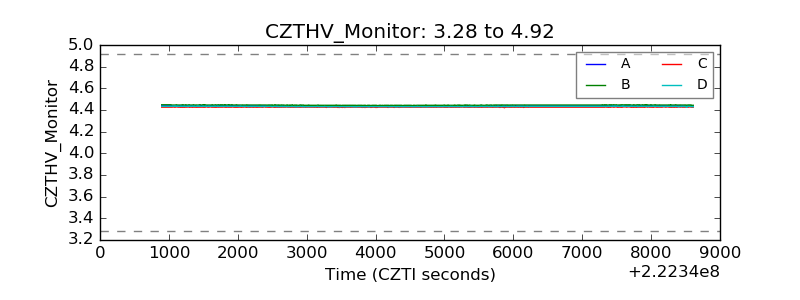 |
| D_VDD | 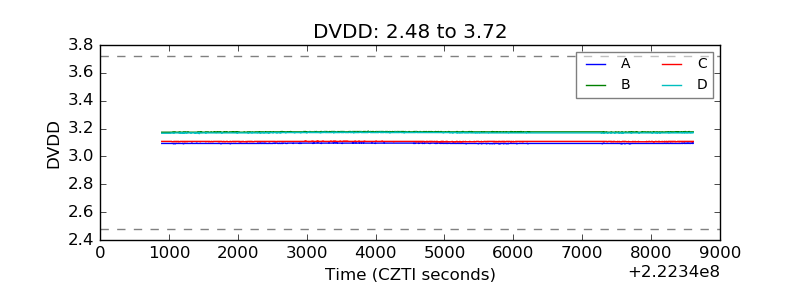 |
| Temperature 1 | 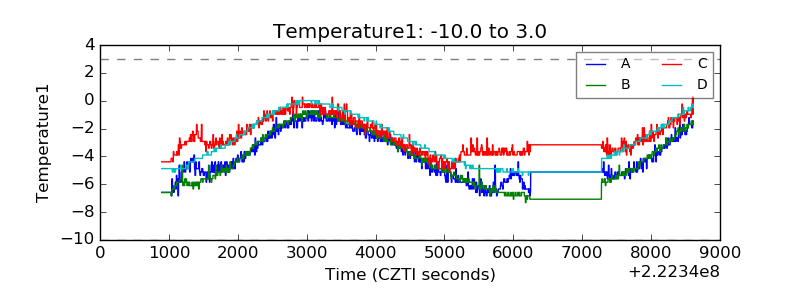 |
| Veto HV Monitor | 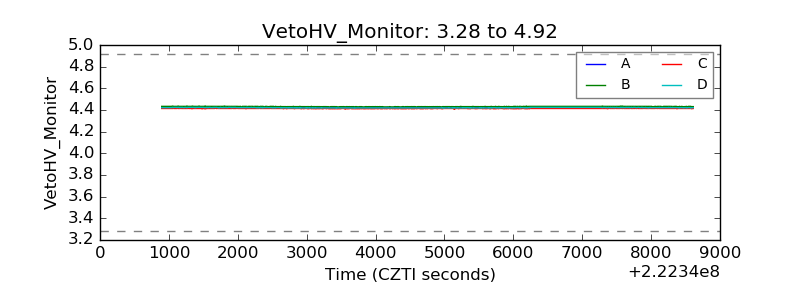 |
| Veto LLD | 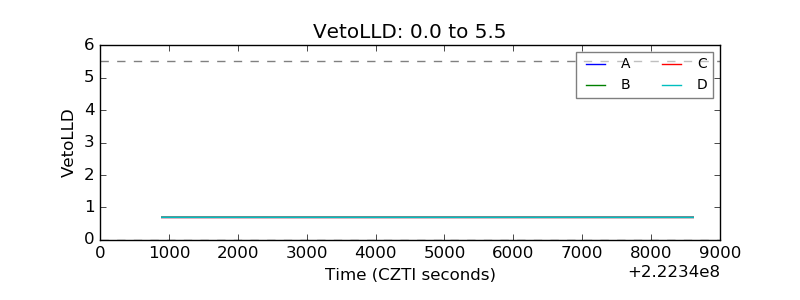 |
| Alpha Counter | 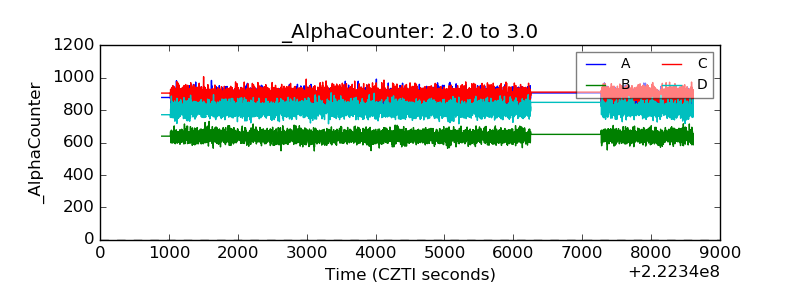 |
| _CPM_Rate | 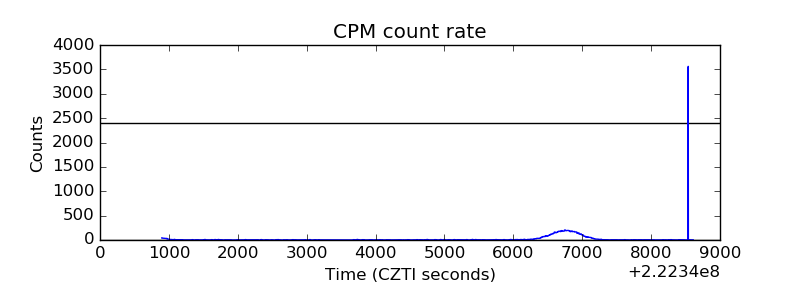 |
| CZT Counter | 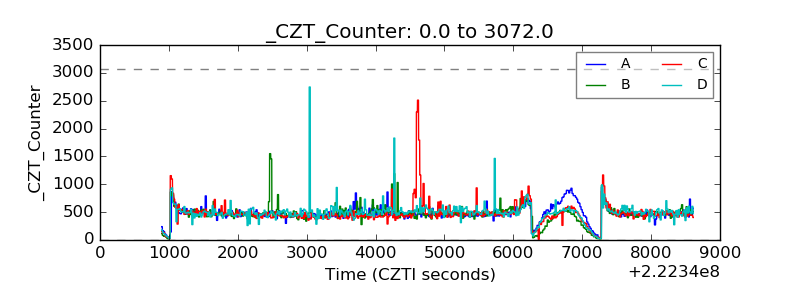 |
| +2.5 Volts monitor |  |
| +5 Volts monitor |  |
| _ROLL_ROT |  |
| _Roll_DEC | 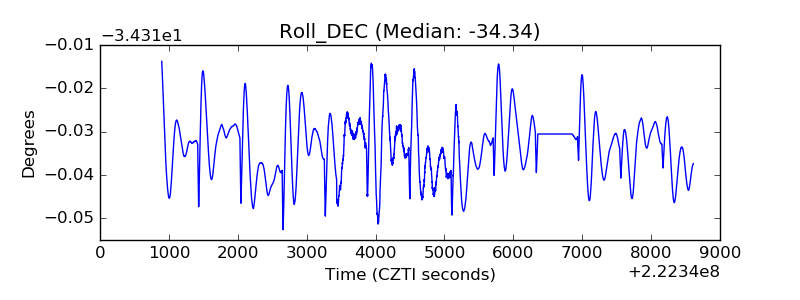 |
| _Roll_RA |  |
| Veto Counter | 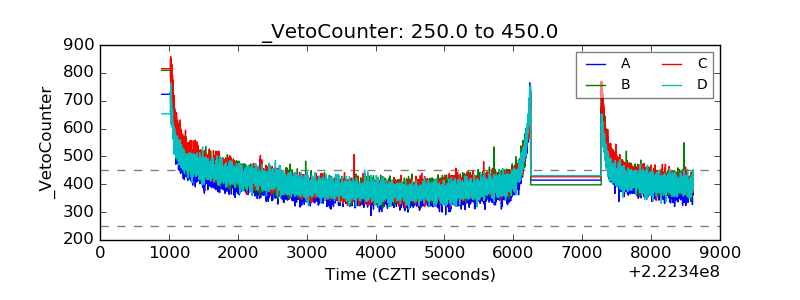 |