| Param | Original file | Final file |
|---|---|---|
| Filename | modeM0/AS1A02_155T01_9000000966_07067cztM0_level2.evt | modeM0/AS1A02_155T01_9000000966_07067cztM0_level2_quad_clean.evt |
| Size (bytes) | 559,897,920 | 73,157,760 |
| Size | 534.0 MB | 69.8 MB |
| Events in quadrant A | 3,464,036 | 428,568 |
| Events in quadrant B | 4,151,882 | 434,943 |
| Events in quadrant C | 4,633,532 | 421,778 |
| Events in quadrant D | 4,202,693 | 412,261 |
| Mode M0 | |||
|---|---|---|---|
| Quadrant | BADHDUFLAG | Total packets | Discarded packets |
| A | 0 | 15412 | 2 |
| B | 0 | 17209 | 1 |
| C | 0 | 18771 | 1 |
| D | 0 | 17240 | 1 |
| Mode M9 | |||
|---|---|---|---|
| Quadrant | BADHDUFLAG | Total packets | Discarded packets |
| A | 0 | 4 | 0 |
| B | 0 | 4 | 0 |
| C | 0 | 4 | 0 |
| D | 0 | 4 | 0 |
| Mode SS | |||
|---|---|---|---|
| Quadrant | BADHDUFLAG | Total packets | Discarded packets |
| A | 0 | 150 | 0 |
| B | 0 | 150 | 0 |
| C | 0 | 150 | 0 |
| D | 0 | 150 | 0 |
| Quadrant | Total seconds | Saturated seconds | Saturation percentage |
|---|---|---|---|
| A | 7438 | 134 | 1.801560% |
| B | 7438 | 237 | 3.186340% |
| C | 7438 | 244 | 3.280452% |
| D | 7438 | 200 | 2.688895% |
Noise dominated data is calculated using 1-second bins in cleaned event files. If a bin has >2000 counts, and if more than 50% of those come from <1% of pixels, then it is considered to be noise-dominated and hence unusable.
| Quadrant | # 1 sec bins | Bins with >0 counts | Bins with >2000 counts | High rate bins dominated by noise | Noise dominated (total time) | Noise dominated (detector-on time) | Marked lightcurve |
|---|---|---|---|---|---|---|---|
| A | 7789 | 7440 | 1 | 1 | 0.01% | 0.01% | 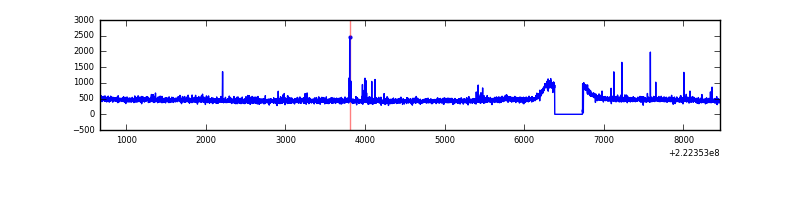 |
| B | 7789 | 7440 | 77 | 77 | 0.99% | 1.03% | 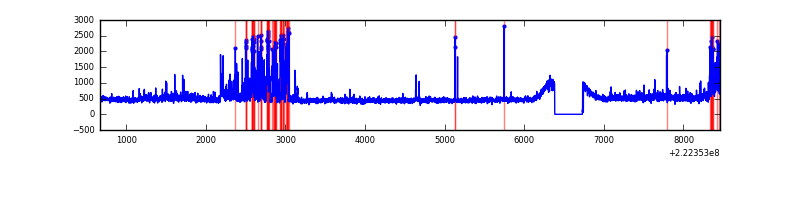 |
| C | 7789 | 7440 | 129 | 129 | 1.66% | 1.73% | 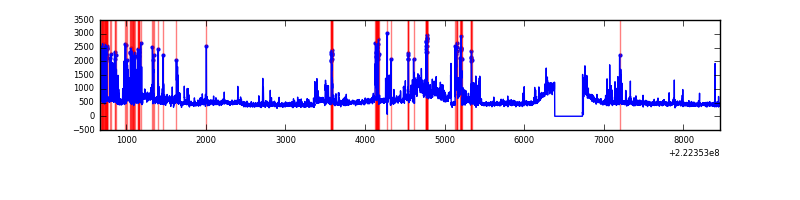 |
| D | 7789 | 7440 | 66 | 66 | 0.85% | 0.89% | 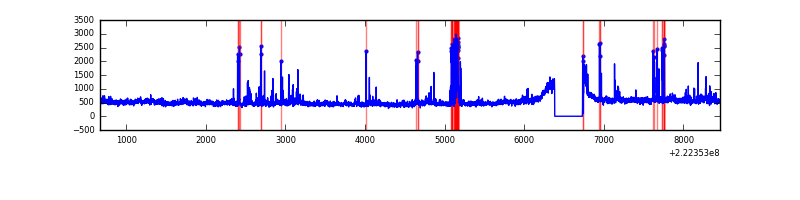 |
Top three noisy pixels from each quadrant. If the there are fewer than three noisy pixels in the level2.evt file, extra rows are filled as -1
| Pixel properties | Quadrant properties | ||||||
|---|---|---|---|---|---|---|---|
| Quadrant | DetID | PixID | Counts | Sigma | Mean | Median | Sigma |
| A | 8 | 15 | 36784 | 196.71 | 881 | 861 | 182.6 |
| A | 13 | 248 | 21559 | 113.34 | 881 | 861 | 182.6 |
| A | 13 | 14 | 9745 | 48.65 | 881 | 861 | 182.6 |
| B | 4 | 239 | 528223 | 3102.47 | 882 | 860 | 170.0 |
| B | 0 | 214 | 159343 | 932.35 | 882 | 860 | 170.0 |
| B | 4 | 81 | 21342 | 120.5 | 882 | 860 | 170.0 |
| C | 9 | 68 | 1188340 | 5922.62 | 854 | 858 | 200.5 |
| C | 4 | 254 | 106457 | 526.68 | 854 | 858 | 200.5 |
| C | 13 | 61 | 6666 | 28.97 | 854 | 858 | 200.5 |
| D | 8 | 195 | 524928 | 2463.79 | 858 | 829 | 212.7 |
| D | 14 | 34 | 182047 | 851.9 | 858 | 829 | 212.7 |
| D | 2 | 136 | 117137 | 546.76 | 858 | 829 | 212.7 |
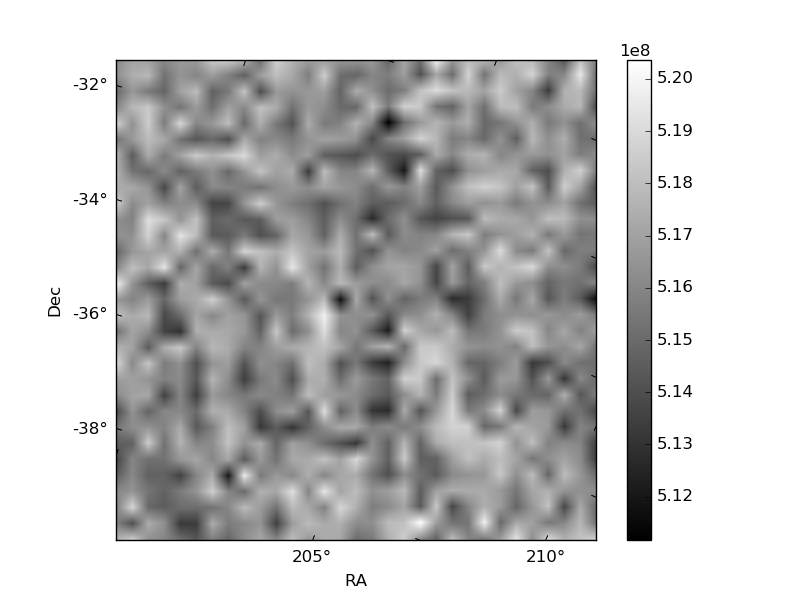
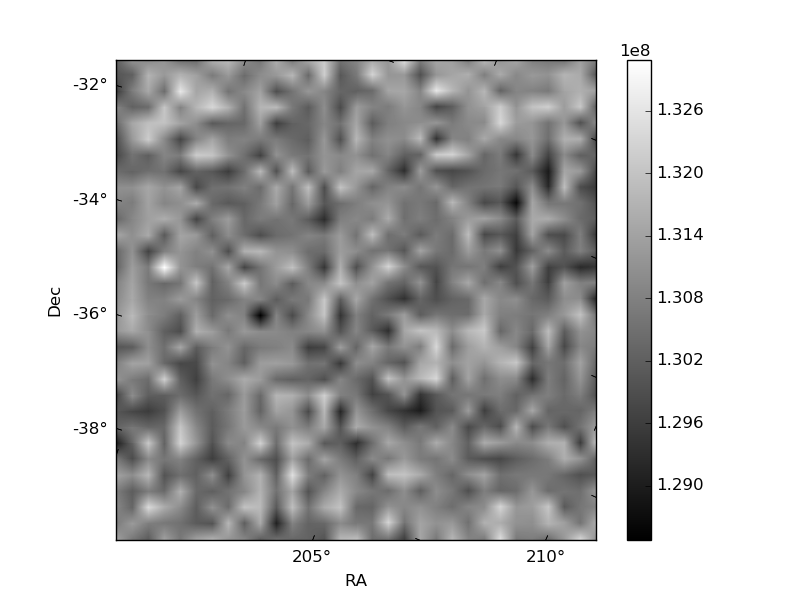
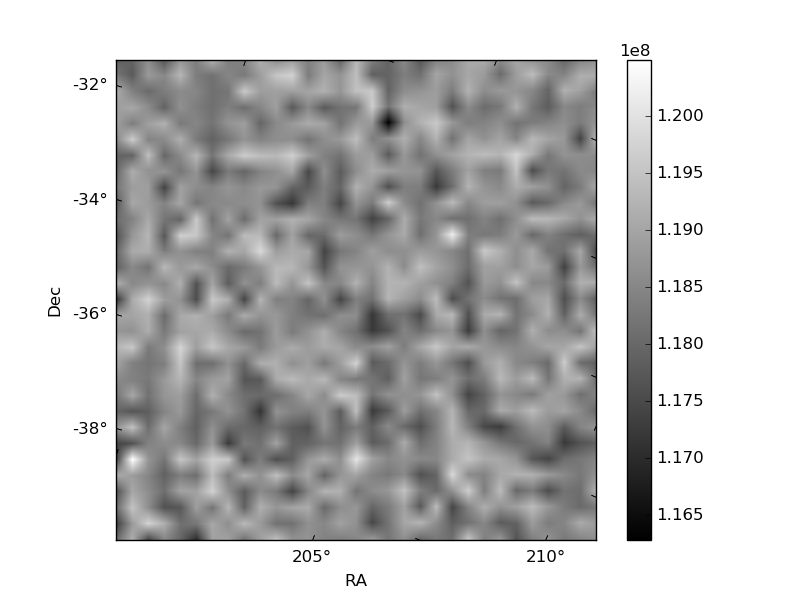
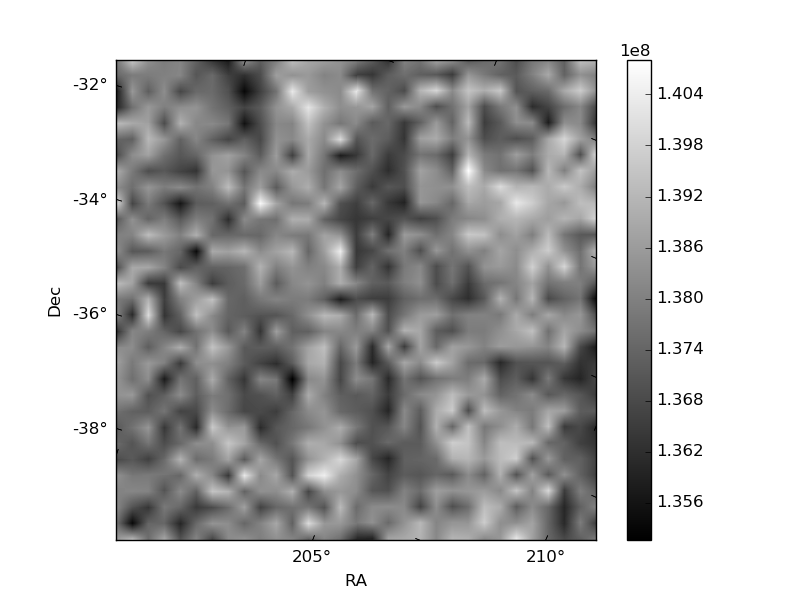
Histogram calculated using DETX and DETY for each event in the final _common_clean file
| Quadrant A | 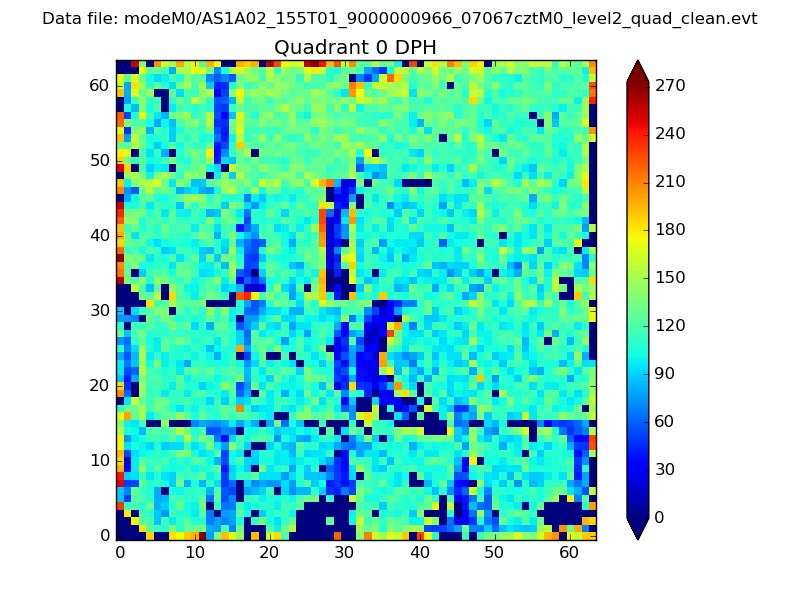 |
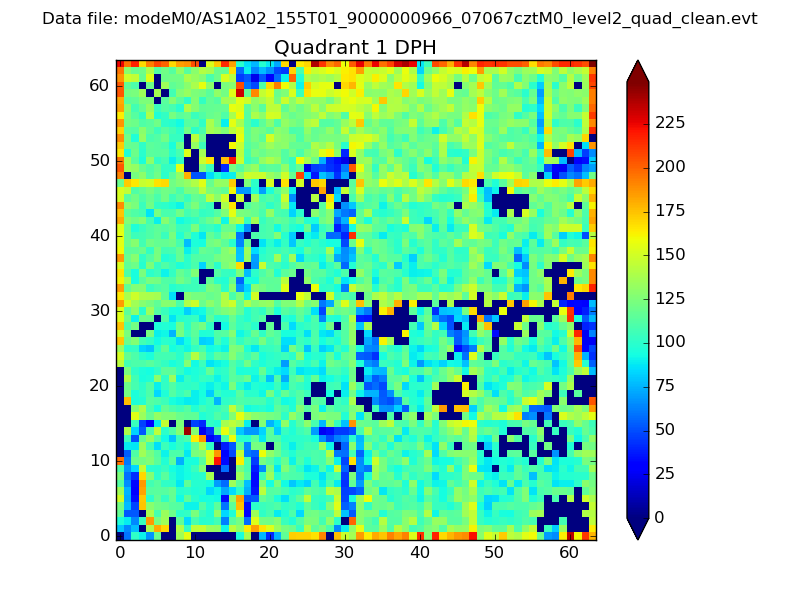 |
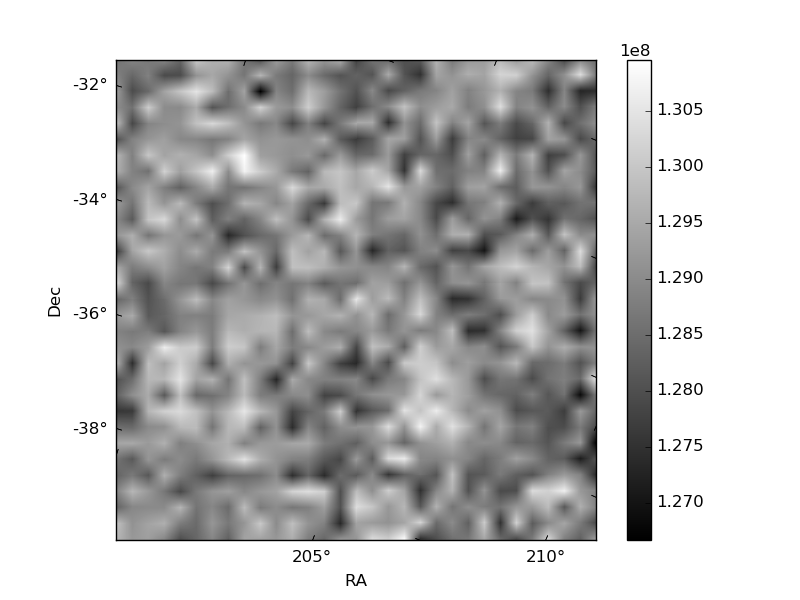
Quadrant B |
|---|---|---|---|
| Quadrant D | 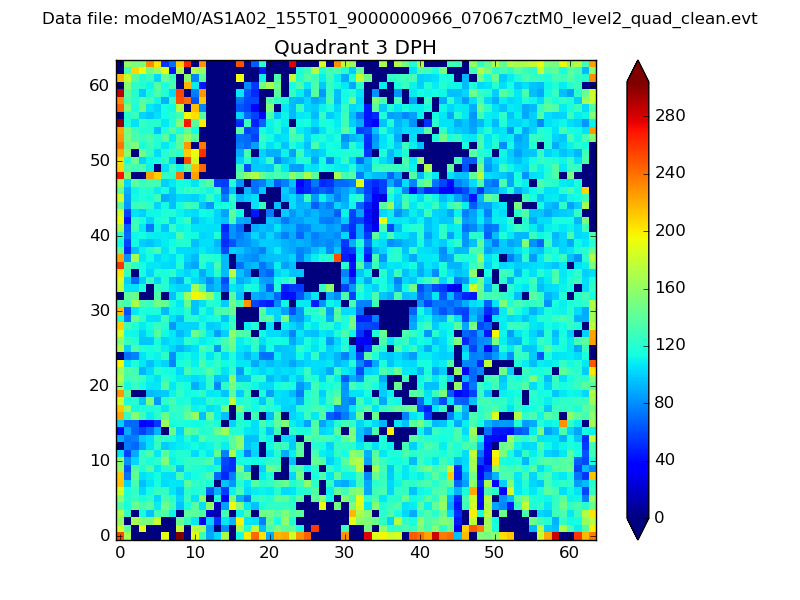 |
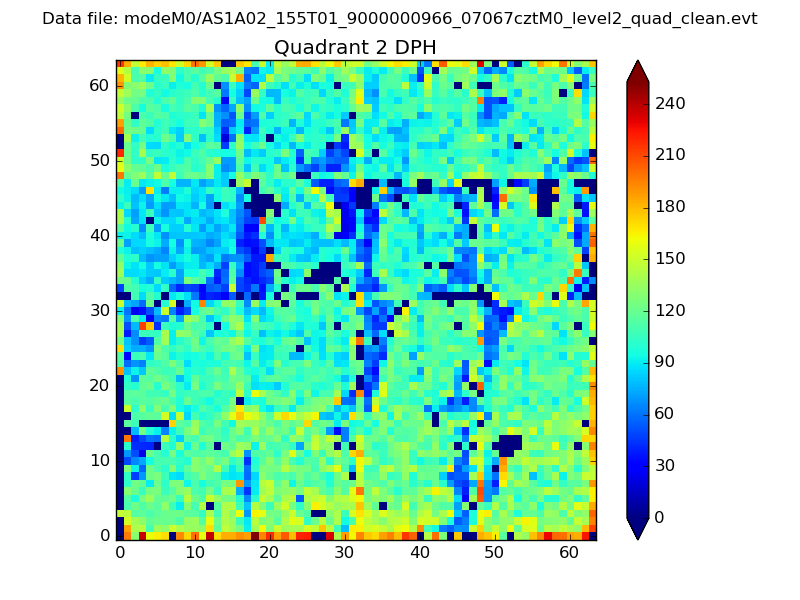 |
Quadrant C |
| Plot type | Count rate plots | Images |
|---|---|---|
| Comparison with Poisson distribution Blue bars denote a histogram of data divided into 1 sec bins. Red curve is a Poisson curve with rate = median count rate of data. |
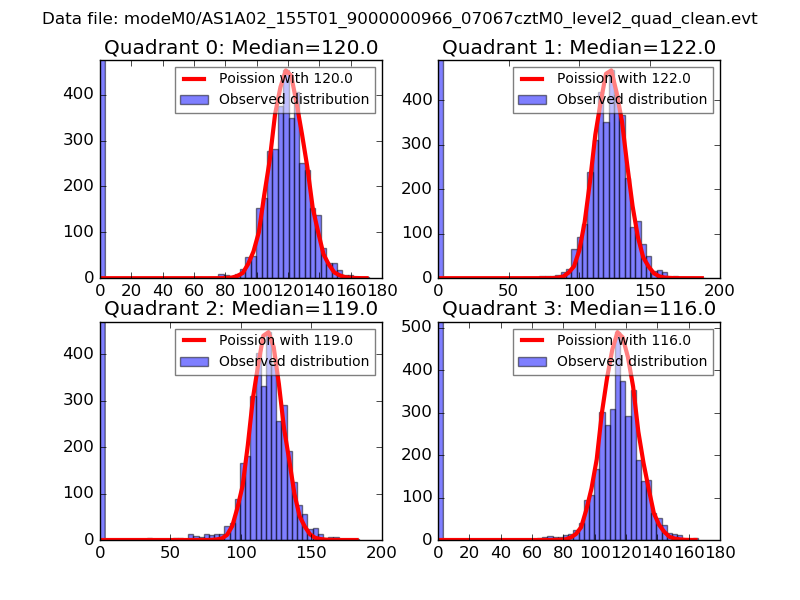 |
 |
| Quadrant-wise count rates Data is divided into 100 sec bins |
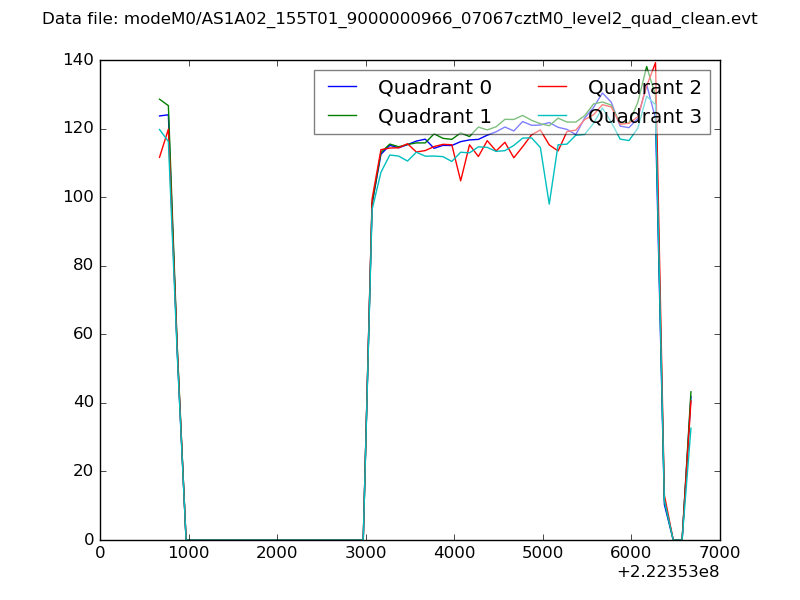 |
|
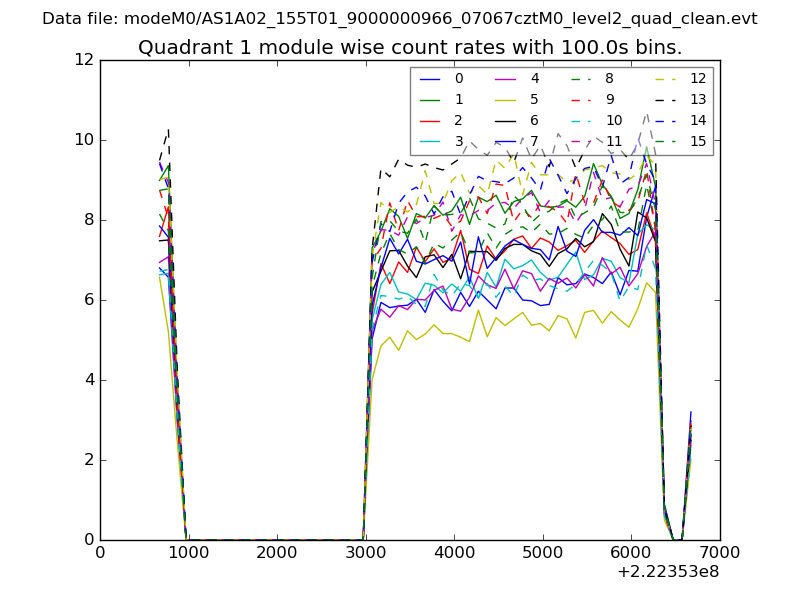
| Module-wise count rates for Quadrant A Data is divided into 100 sec bins |
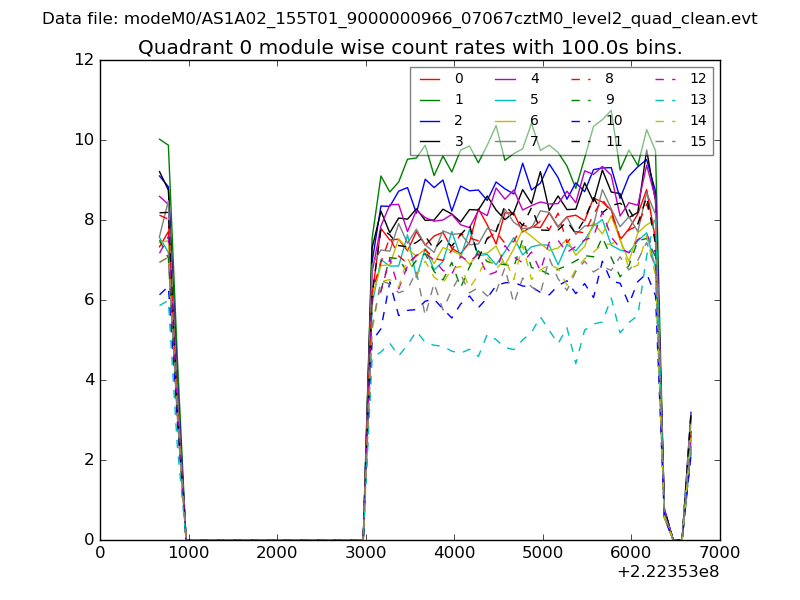 |
 |
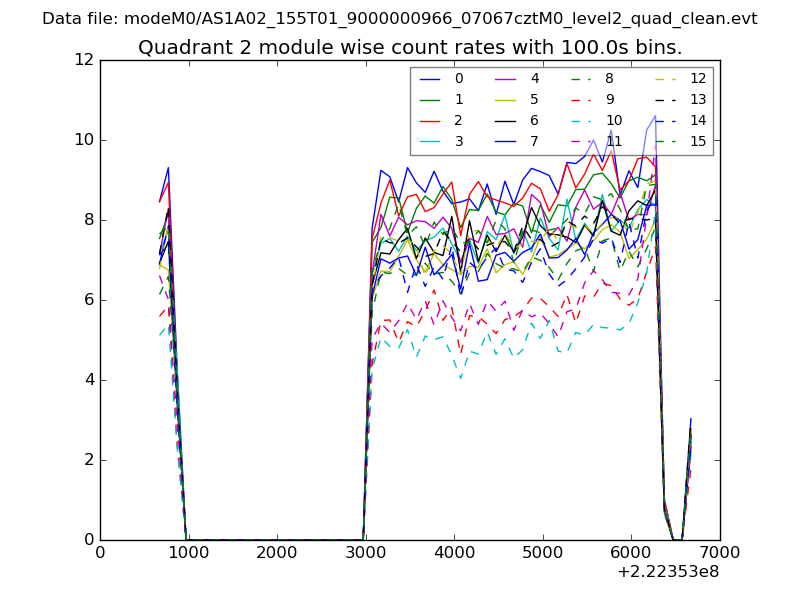
| Module-wise count rates for Quadrant B Data is divided into 100 sec bins |
 |
 |
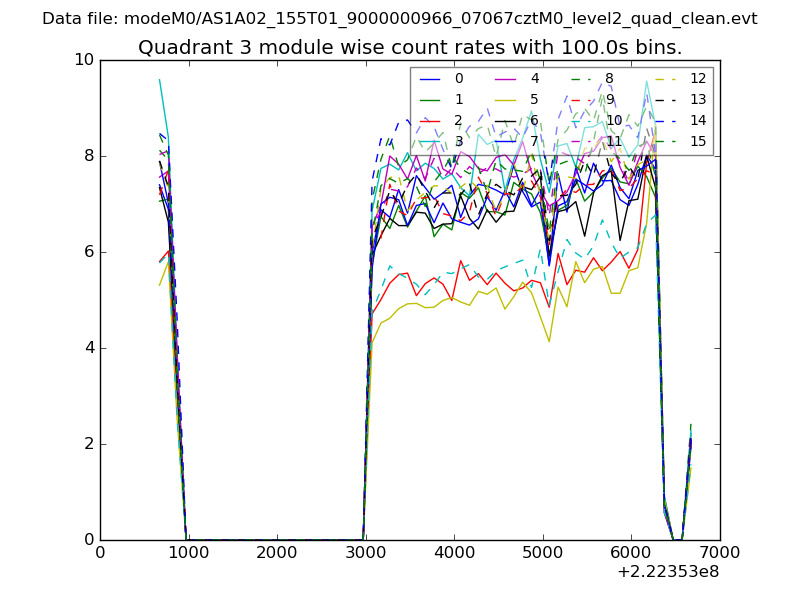
| Module-wise count rates for Quadrant C Data is divided into 100 sec bins |
 |
 |
| Module-wise count rates for Quadrant D Data is divided into 100 sec bins |
 |
 |
| Parameter | Plot |
|---|---|
| CZT HV Monitor | 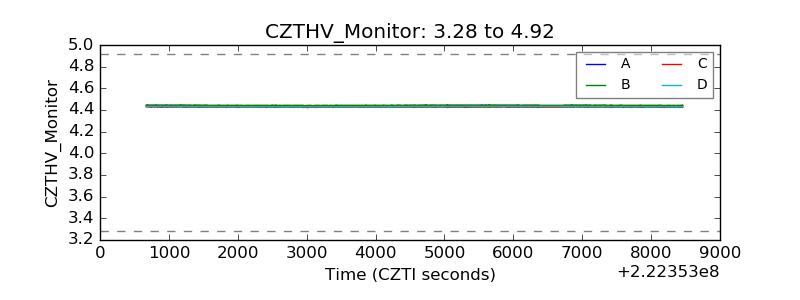 |
| D_VDD | 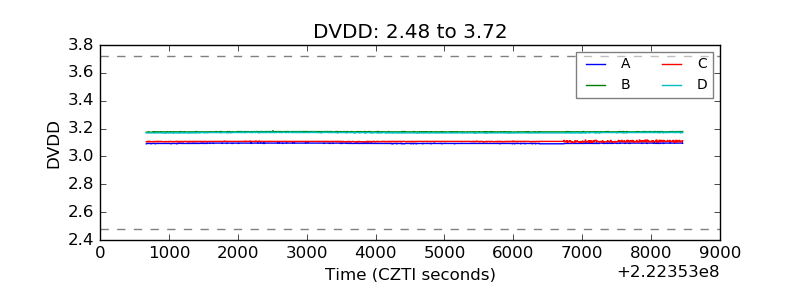 |
| Temperature 1 | 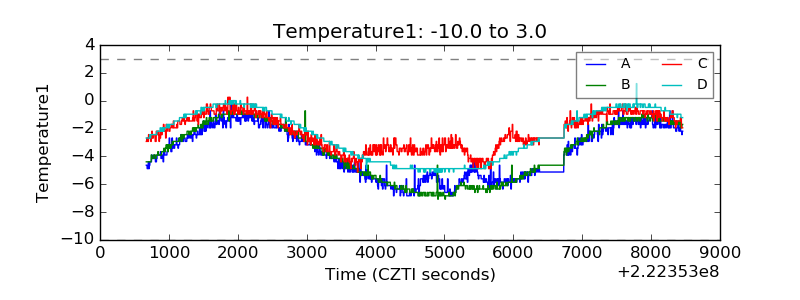 |
| Veto HV Monitor | 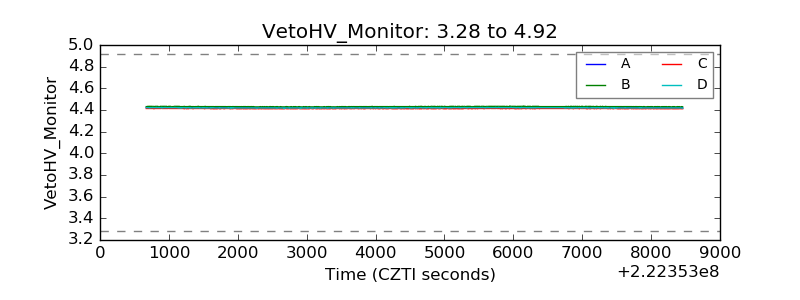 |
| Veto LLD | 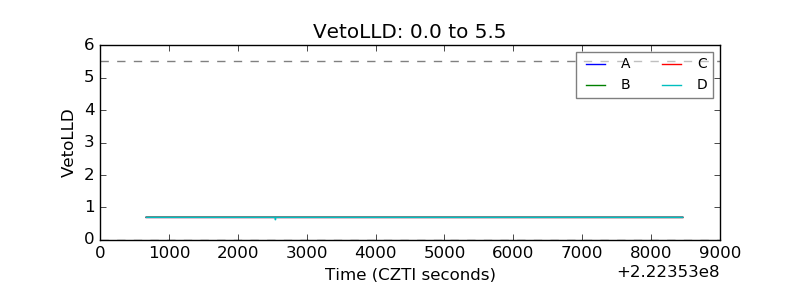 |
| Alpha Counter | 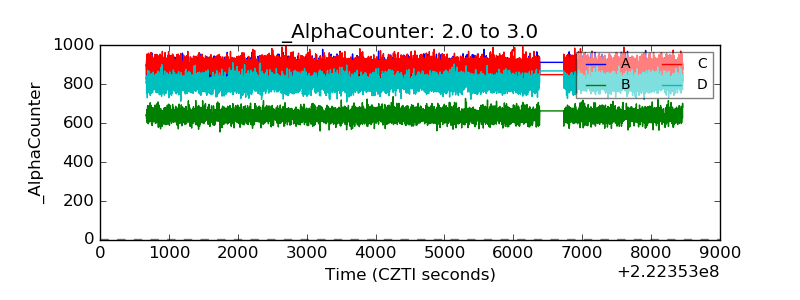 |
| _CPM_Rate | 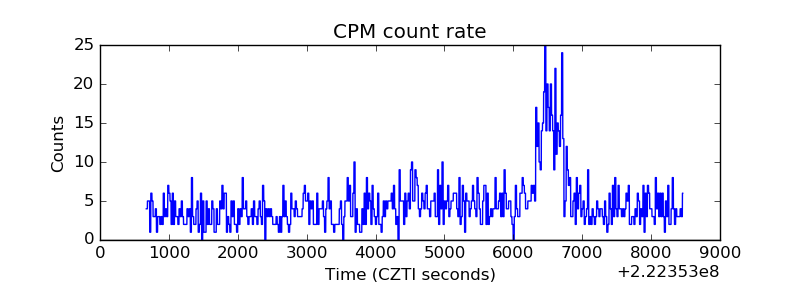 |
| CZT Counter | 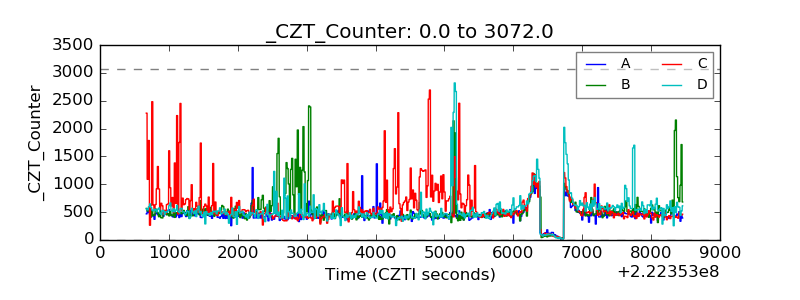 |
| +2.5 Volts monitor |  |
| +5 Volts monitor |  |
| _ROLL_ROT | 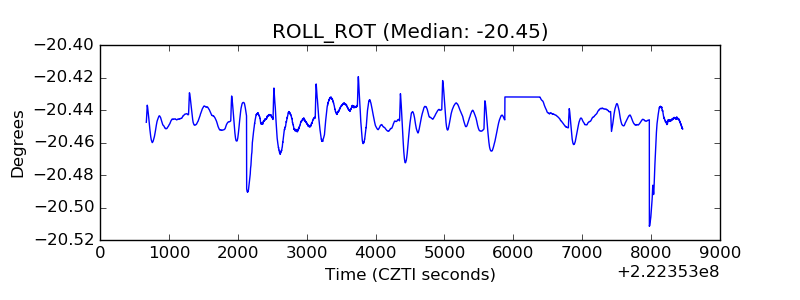 |
| _Roll_DEC | 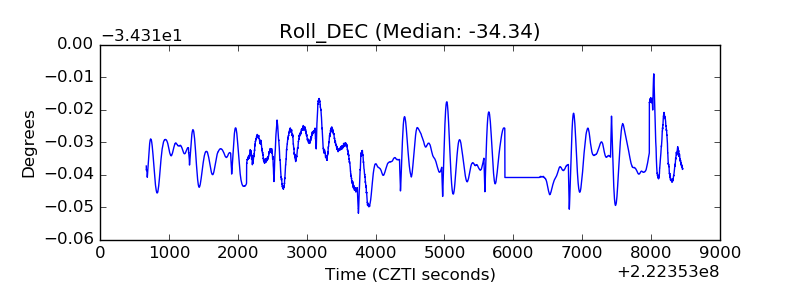 |
| _Roll_RA |  |
| Veto Counter | 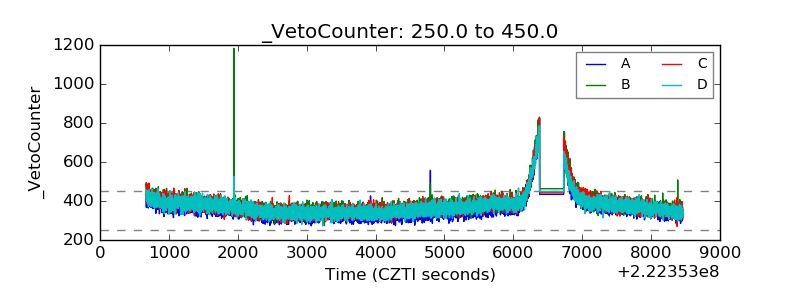 |