| Param | Original file | Final file |
|---|---|---|
| Filename | modeM0/AS1A02_155T01_9000000966_07071cztM0_level2.evt | modeM0/AS1A02_155T01_9000000966_07071cztM0_level2_quad_clean.evt |
| Size (bytes) | 286,882,560 | 61,061,760 |
| Size | 273.6 MB | 58.2 MB |
| Events in quadrant A | 1,913,391 | 385,303 |
| Events in quadrant B | 2,074,475 | 388,478 |
| Events in quadrant C | 2,028,899 | 385,578 |
| Events in quadrant D | 2,362,106 | 371,006 |
| Mode M0 | |||
|---|---|---|---|
| Quadrant | BADHDUFLAG | Total packets | Discarded packets |
| A | 0 | 9075 | 1 |
| B | 0 | 9362 | 0 |
| C | 0 | 9348 | 0 |
| D | 0 | 10169 | 0 |
| Mode SS | |||
|---|---|---|---|
| Quadrant | BADHDUFLAG | Total packets | Discarded packets |
| A | 0 | 92 | 0 |
| B | 0 | 92 | 0 |
| C | 0 | 92 | 0 |
| D | 0 | 92 | 0 |
| Quadrant | Total seconds | Saturated seconds | Saturation percentage |
|---|---|---|---|
| A | 4523 | 3 | 0.066328% |
| B | 4523 | 17 | 0.375857% |
| C | 4523 | 3 | 0.066328% |
| D | 4523 | 59 | 1.304444% |
Noise dominated data is calculated using 1-second bins in cleaned event files. If a bin has >2000 counts, and if more than 50% of those come from <1% of pixels, then it is considered to be noise-dominated and hence unusable.
| Quadrant | # 1 sec bins | Bins with >0 counts | Bins with >2000 counts | High rate bins dominated by noise | Noise dominated (total time) | Noise dominated (detector-on time) | Marked lightcurve |
|---|---|---|---|---|---|---|---|
| A | 4522 | 4522 | 0 | 0 | 0.00% | 0.00% | 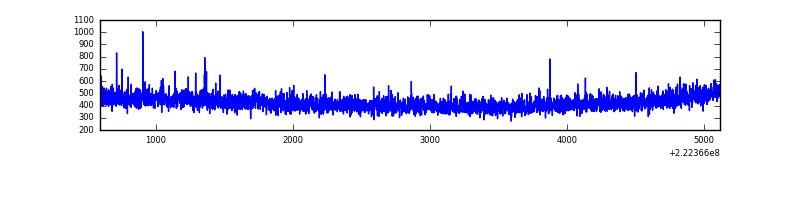 |
| B | 4522 | 4522 | 9 | 9 | 0.20% | 0.20% | 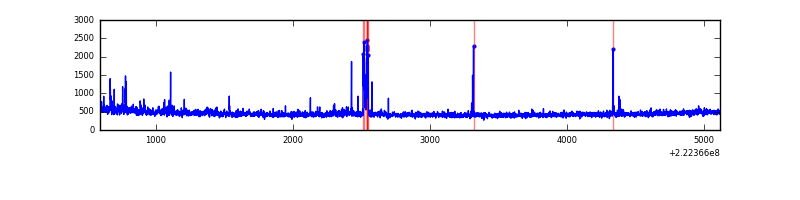 |
| C | 4522 | 4522 | 3 | 3 | 0.07% | 0.07% | 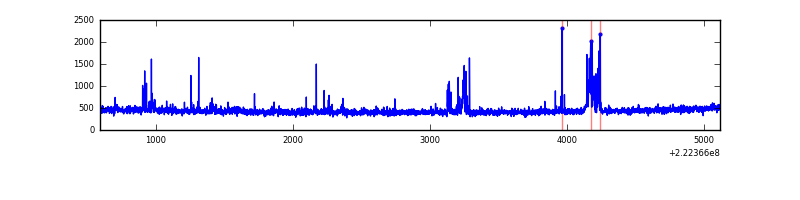 |
| D | 4523 | 4523 | 52 | 52 | 1.15% | 1.15% | 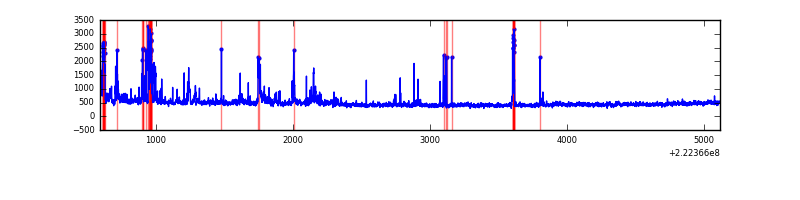 |
Top three noisy pixels from each quadrant. If the there are fewer than three noisy pixels in the level2.evt file, extra rows are filled as -1
| Pixel properties | Quadrant properties | ||||||
|---|---|---|---|---|---|---|---|
| Quadrant | DetID | PixID | Counts | Sigma | Mean | Median | Sigma |
| A | 8 | 15 | 6799 | 61.48 | 492 | 480 | 102.8 |
| A | 13 | 14 | 5322 | 47.11 | 492 | 480 | 102.8 |
| A | 0 | 226 | 4857 | 42.59 | 492 | 480 | 102.8 |
| B | 0 | 214 | 94428 | 976.13 | 499 | 488 | 96.2 |
| B | 0 | 219 | 9265 | 91.2 | 499 | 488 | 96.2 |
| B | 12 | 111 | 8838 | 86.76 | 499 | 488 | 96.2 |
| C | 4 | 254 | 134241 | 1175.48 | 484 | 485 | 113.8 |
| C | 13 | 61 | 3876 | 29.8 | 484 | 485 | 113.8 |
| C | 8 | 222 | 2457 | 17.33 | 484 | 485 | 113.8 |
| D | 12 | 233 | 189290 | 1594.27 | 477 | 464 | 118.4 |
| D | 8 | 195 | 178432 | 1502.6 | 477 | 464 | 118.4 |
| D | 13 | 169 | 72542 | 608.56 | 477 | 464 | 118.4 |
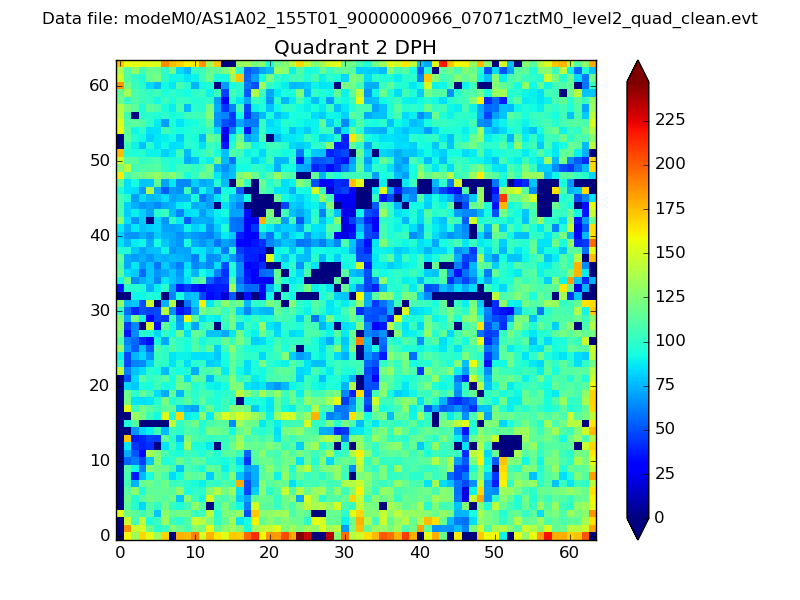
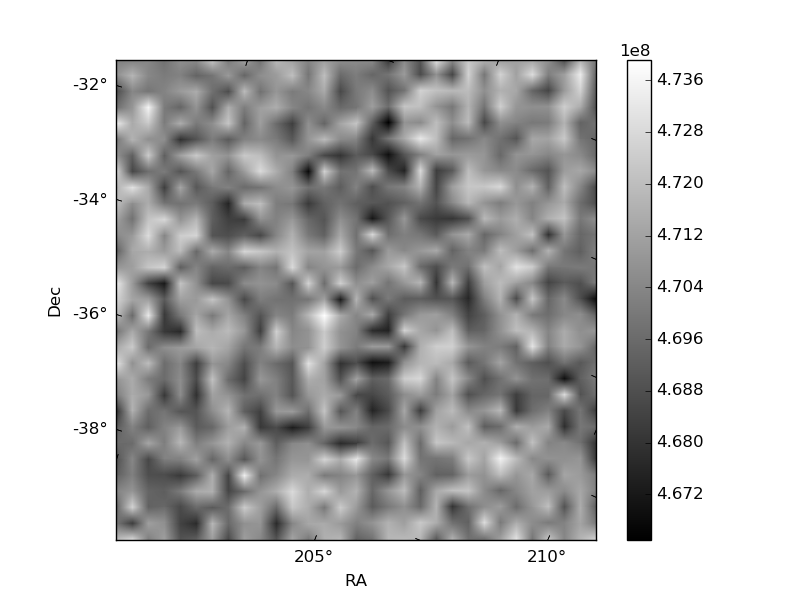
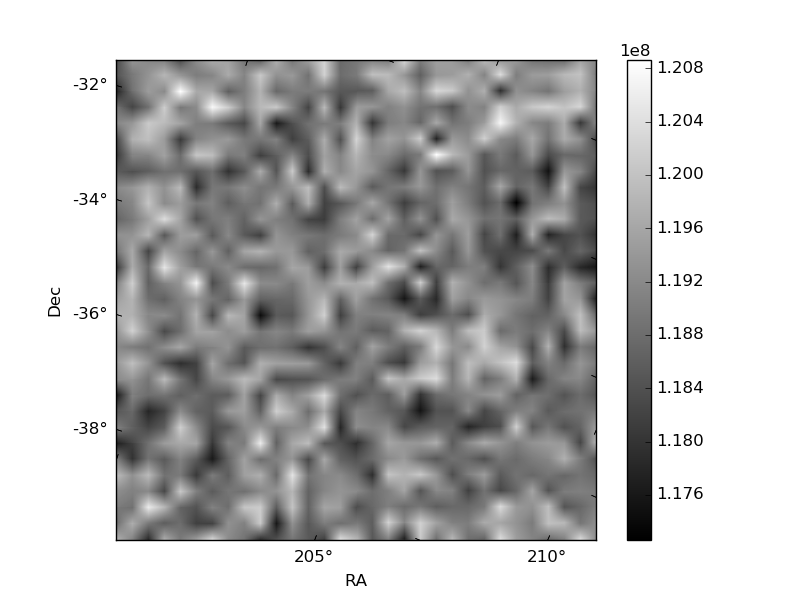
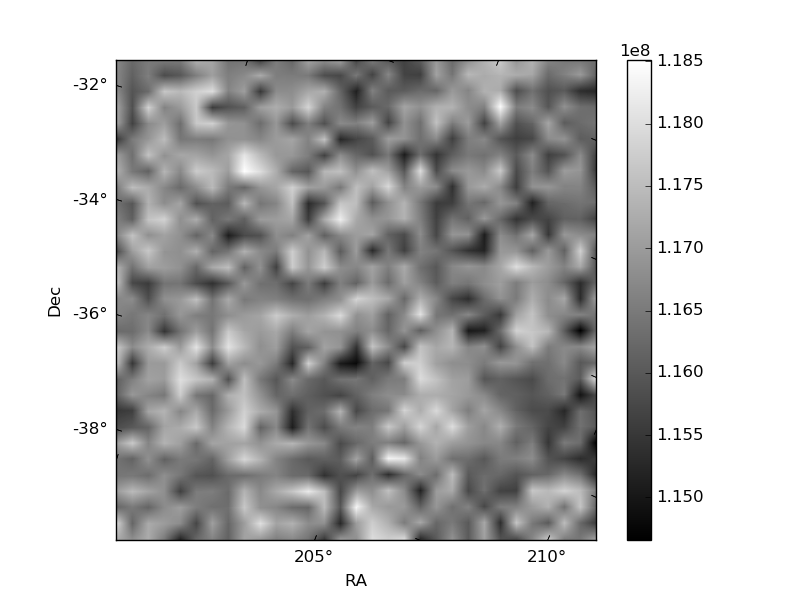
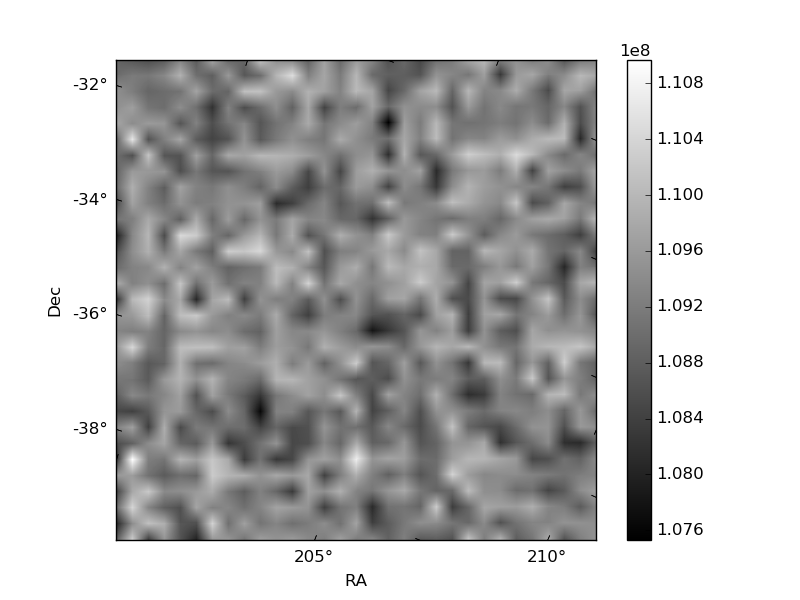
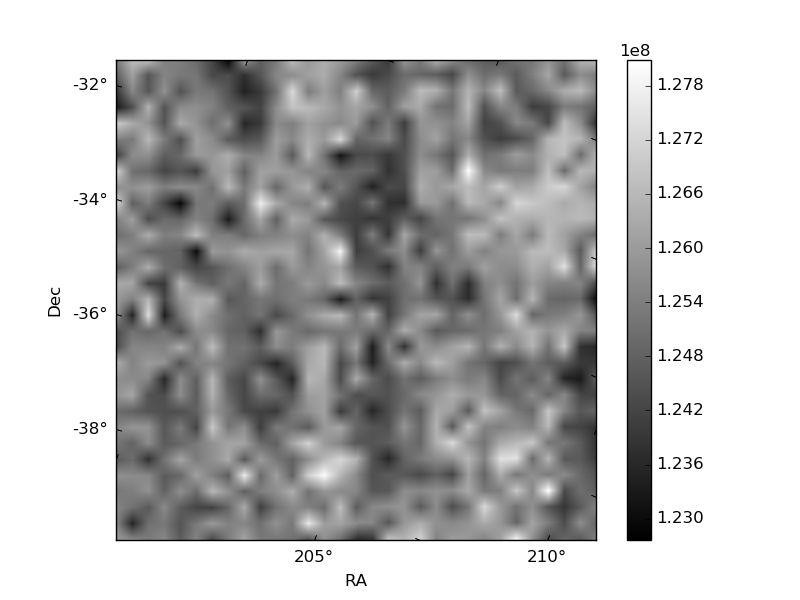
Histogram calculated using DETX and DETY for each event in the final _common_clean file
| Quadrant A | 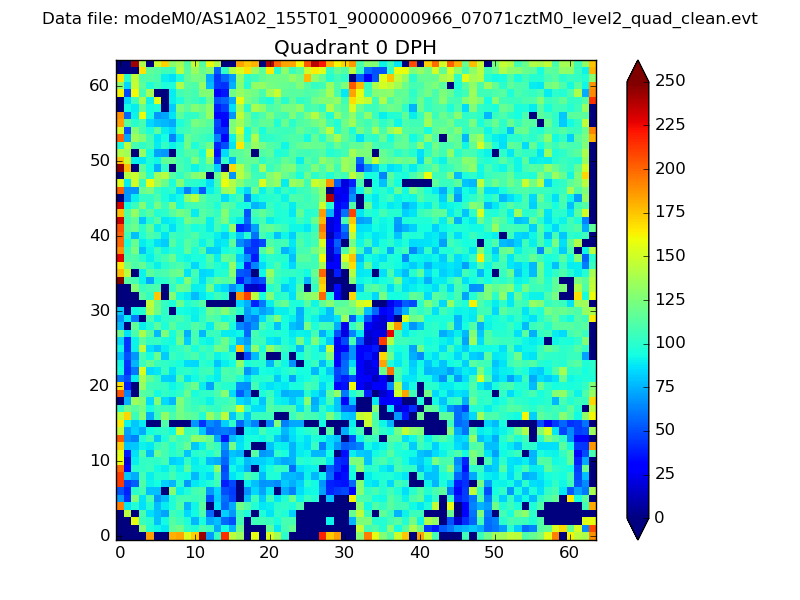 |
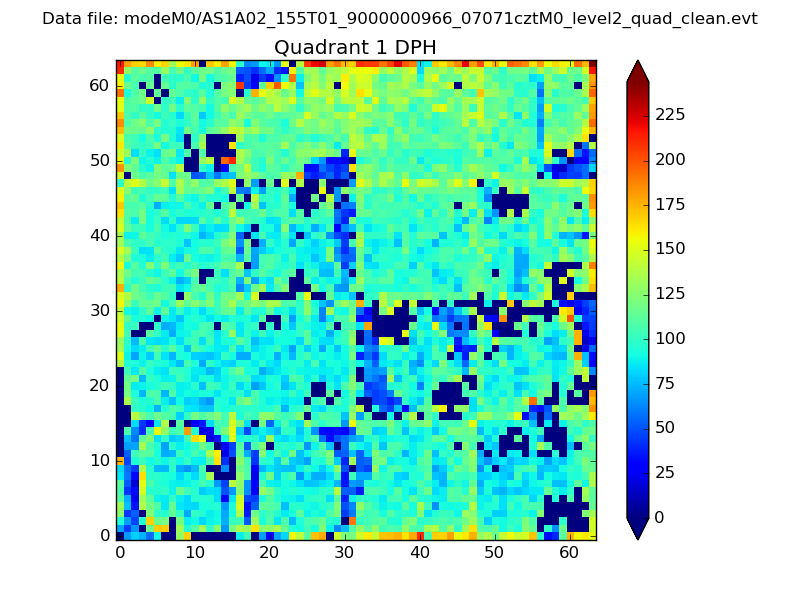 |
Quadrant B |
|---|---|---|---|
| Quadrant D | 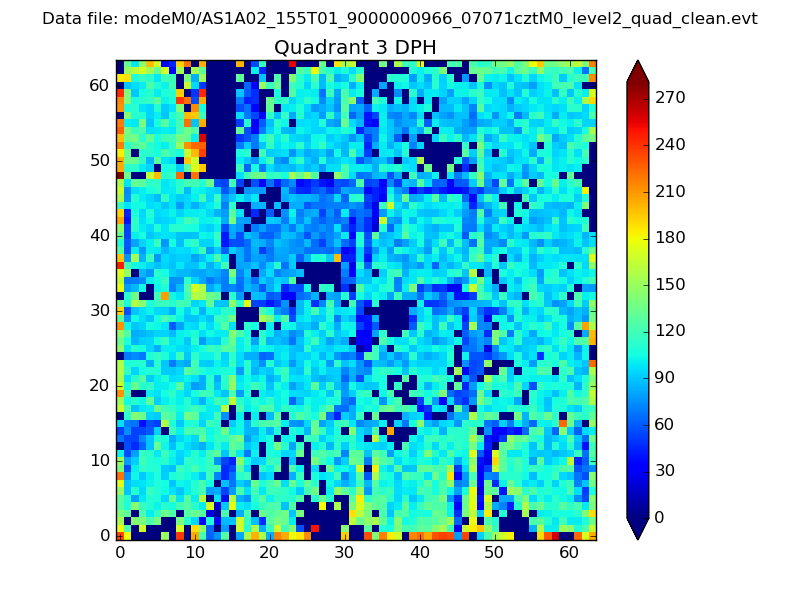 |
 |
Quadrant C |
| Plot type | Count rate plots | Images |
|---|---|---|
| Comparison with Poisson distribution Blue bars denote a histogram of data divided into 1 sec bins. Red curve is a Poisson curve with rate = median count rate of data. |
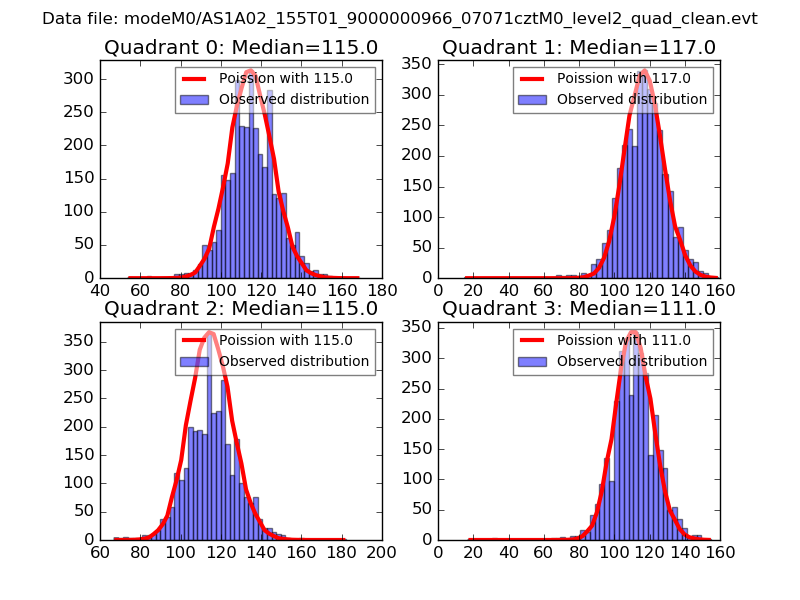 |
 |
| Quadrant-wise count rates Data is divided into 100 sec bins |
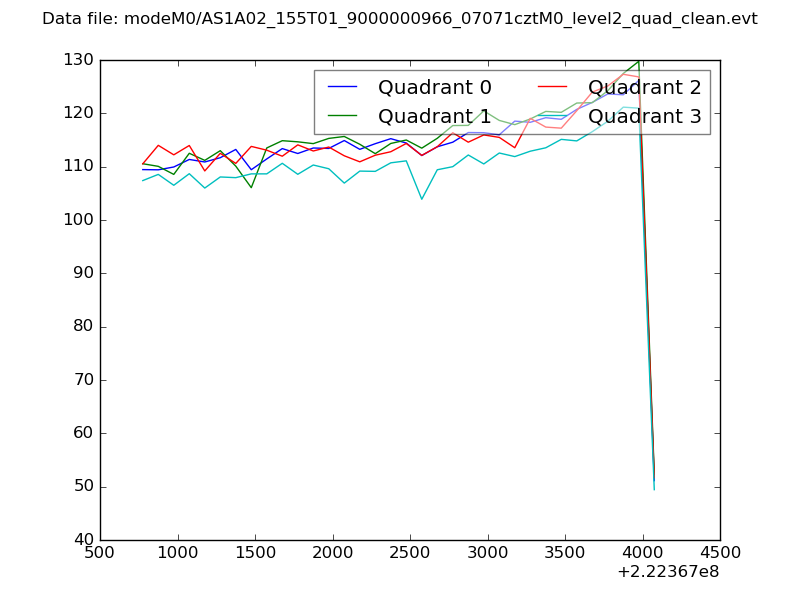 |
|
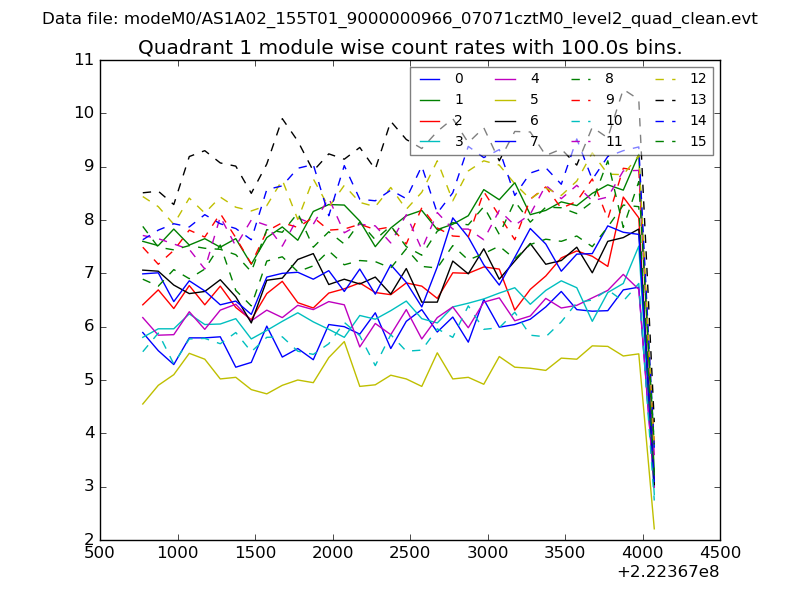
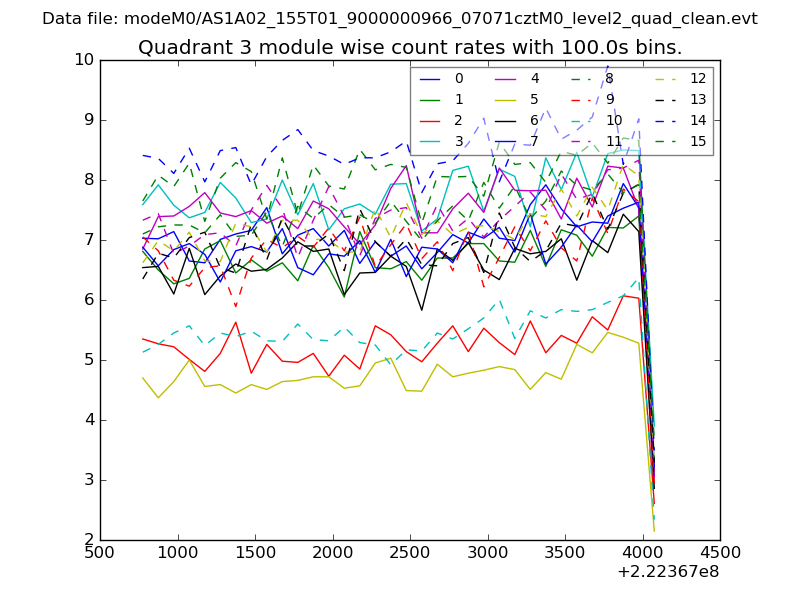
| Module-wise count rates for Quadrant A Data is divided into 100 sec bins |
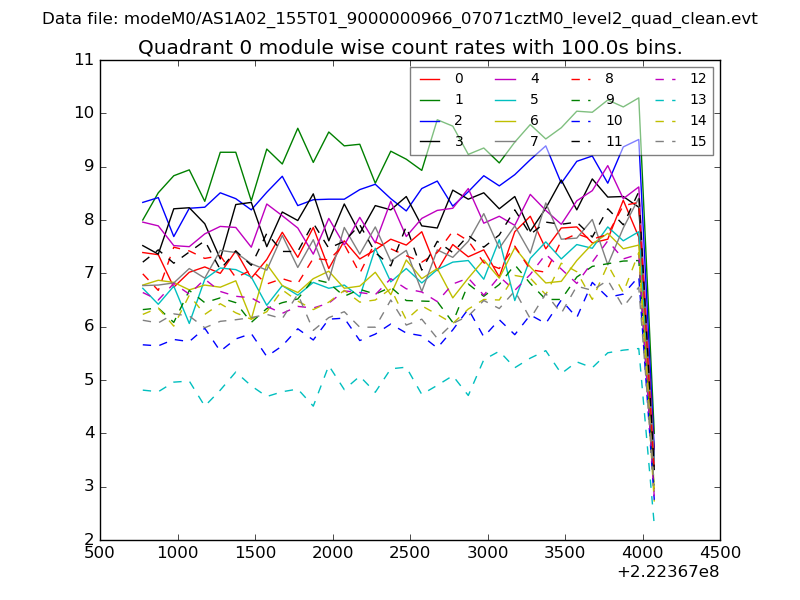 |
 |
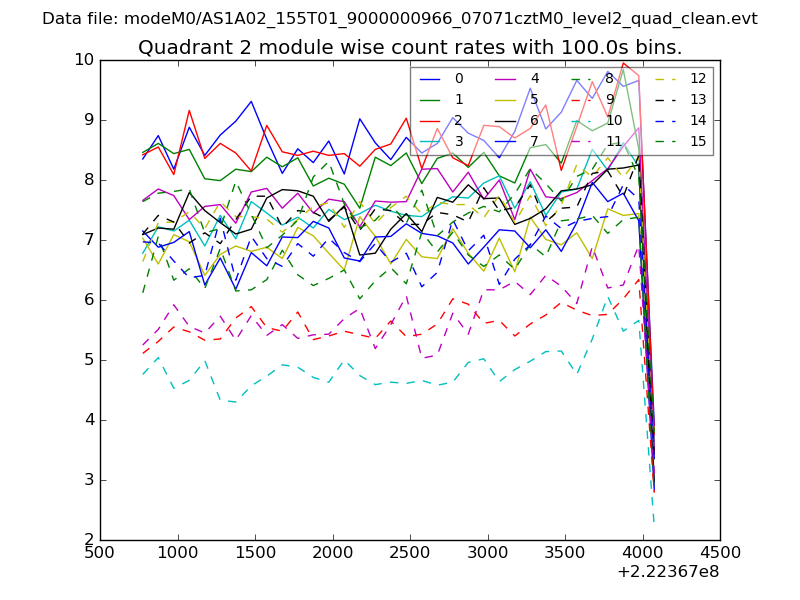
| Module-wise count rates for Quadrant B Data is divided into 100 sec bins |
 |
 |
| Module-wise count rates for Quadrant C Data is divided into 100 sec bins |
 |
 |
| Module-wise count rates for Quadrant D Data is divided into 100 sec bins |
 |
 |
| Parameter | Plot |
|---|---|
| CZT HV Monitor | 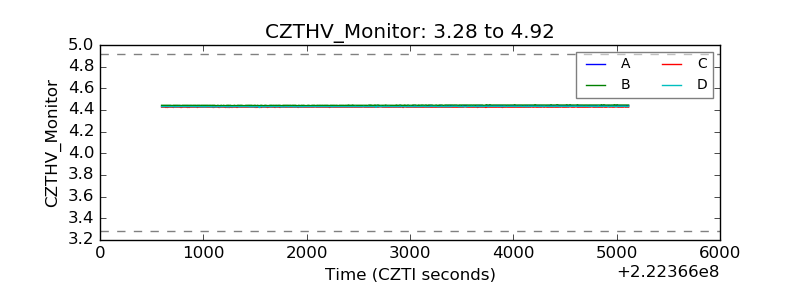 |
| D_VDD | 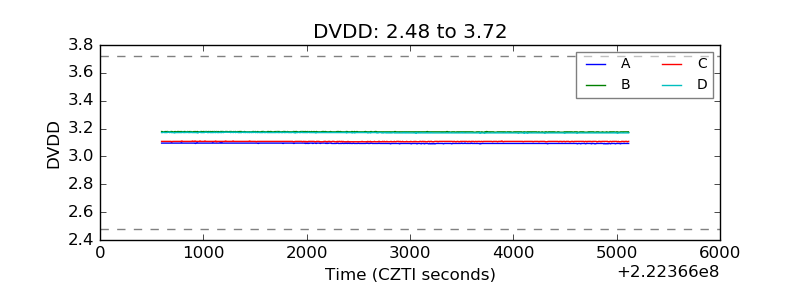 |
| Temperature 1 | 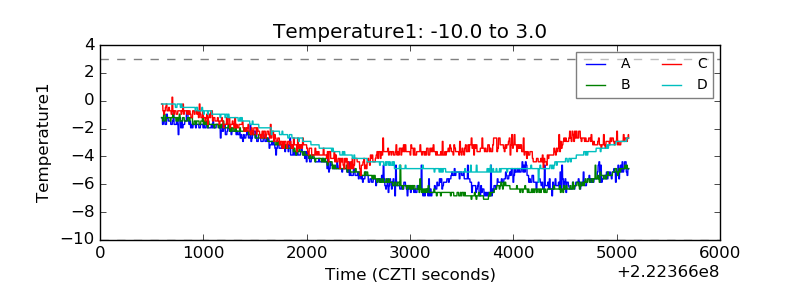 |
| Veto HV Monitor | 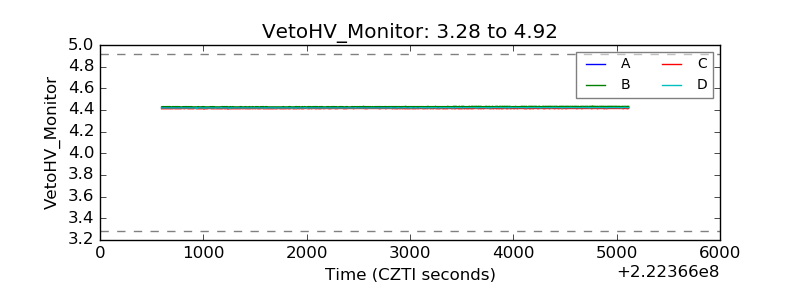 |
| Veto LLD | 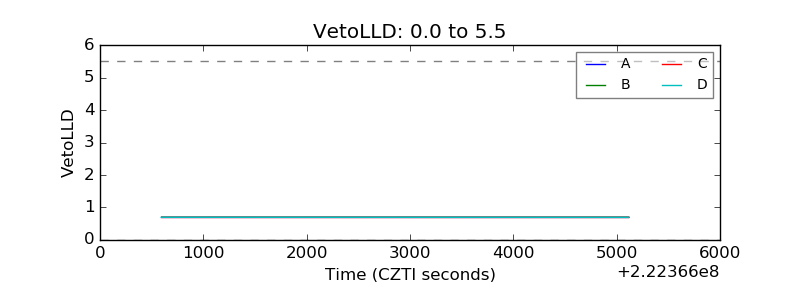 |
| Alpha Counter | 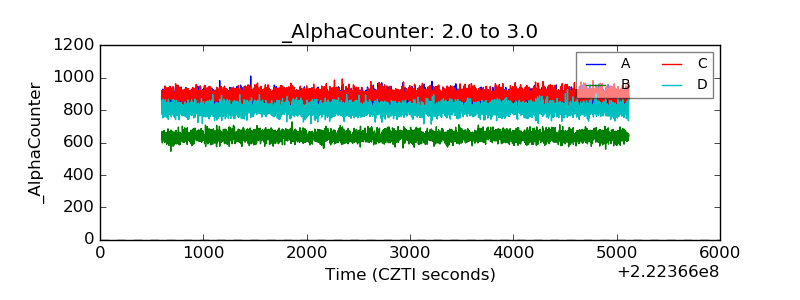 |
| _CPM_Rate | 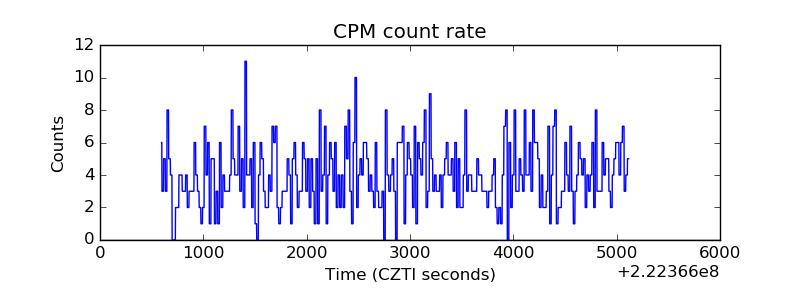 |
| CZT Counter | 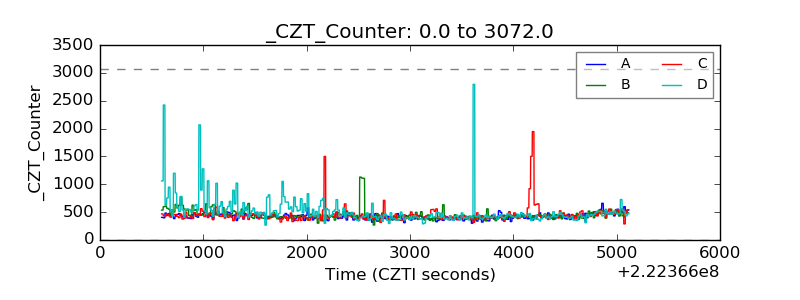 |
| +2.5 Volts monitor | 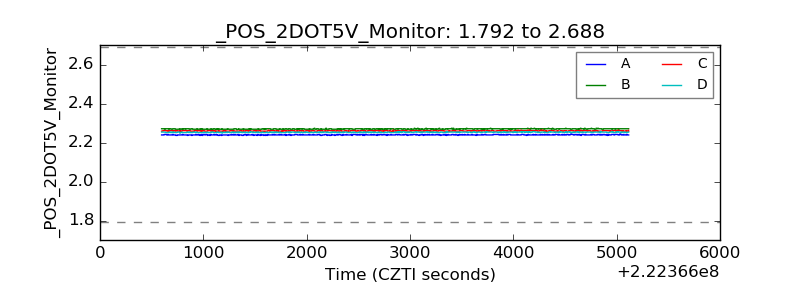 |
| +5 Volts monitor | 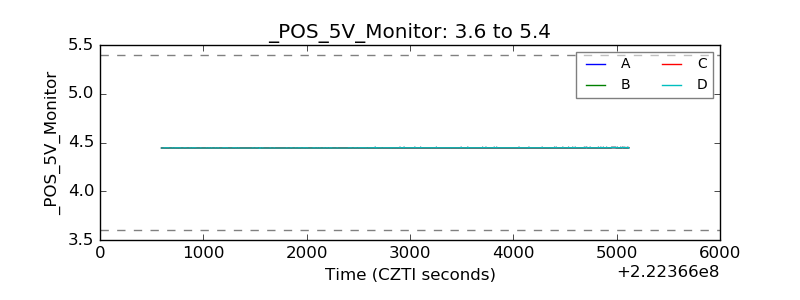 |
| _ROLL_ROT | 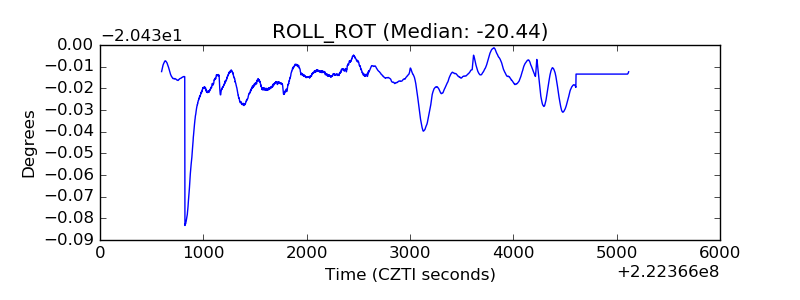 |
| _Roll_DEC | 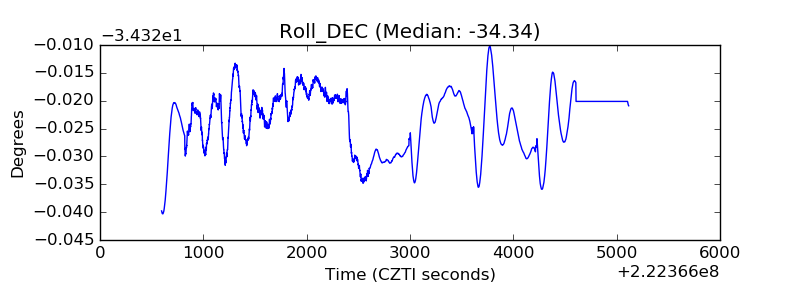 |
| _Roll_RA | 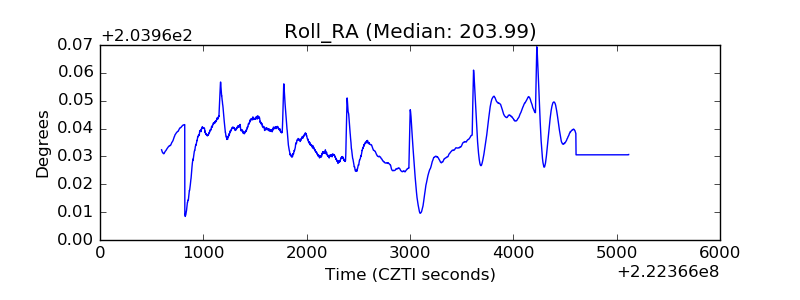 |
| Veto Counter | 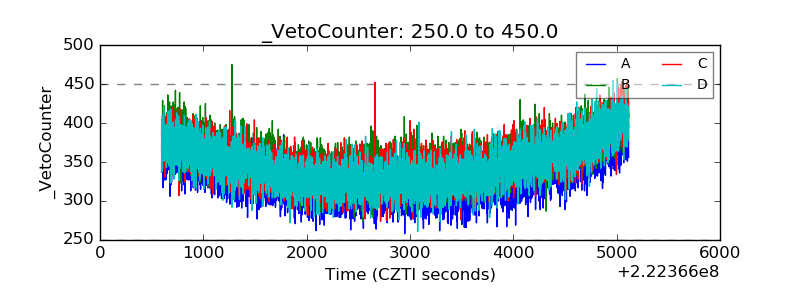 |