| Param | Original file | Final file |
|---|---|---|
| Filename | modeM0/AS1G06_164T01_9000000968cztM0_level2.fits | modeM0/AS1G06_164T01_9000000968cztM0_level2_quad_clean.evt |
| Size (bytes) | 41,356,800 | 52,202,880 |
| Size | 39.4 MB | 49.8 MB |
| Events in quadrant A | 247,380 | 337,312 |
| Events in quadrant B | 240,502 | 336,986 |
| Events in quadrant C | 239,214 | 302,150 |
| Events in quadrant D | 210,554 | 288,605 |
| Mode M9 | |||
|---|---|---|---|
| Quadrant | BADHDUFLAG | Total packets | Discarded packets |
| A | 0 | 24 | 0 |
| B | 0 | 24 | 0 |
| C | 0 | 24 | 0 |
| D | 0 | 24 | 0 |
| Mode SS | |||
|---|---|---|---|
| Quadrant | BADHDUFLAG | Total packets | Discarded packets |
| A | 0 | 90 | 0 |
| B | 0 | 90 | 0 |
| C | 0 | 90 | 0 |
| D | 0 | 90 | 0 |
| Mode M0 | |||
|---|---|---|---|
| Quadrant | BADHDUFLAG | Total packets | Discarded packets |
| A | 0 | 9131 | 0 |
| B | 0 | 10013 | 0 |
| C | 0 | 9757 | 0 |
| D | 0 | 9368 | 0 |
| Quadrant | Total seconds | Saturated seconds | Saturation percentage |
|---|---|---|---|
| A | 4478 | 31 | 0.692273% |
| B | 4478 | 43 | 0.960250% |
| C | 4478 | 96 | 2.143814% |
| D | 4479 | 33 | 0.736772% |
Noise dominated data is calculated using 1-second bins in cleaned event files. If a bin has >2000 counts, and if more than 50% of those come from <1% of pixels, then it is considered to be noise-dominated and hence unusable.
| Quadrant | # 1 sec bins | Bins with >0 counts | Bins with >2000 counts | High rate bins dominated by noise | Noise dominated (total time) | Noise dominated (detector-on time) | Marked lightcurve |
|---|---|---|---|---|---|---|---|
| A | 4478 | 4478 | 0 | 0 | 0.00% | 0.00% |  |
| B | 4478 | 4478 | 0 | 0 | 0.00% | 0.00% |  |
| C | 4478 | 4478 | 0 | 0 | 0.00% | 0.00% |  |
| D | 4478 | 4478 | 0 | 0 | 0.00% | 0.00% |  |
Top three noisy pixels from each quadrant. If the there are fewer than three noisy pixels in the level2.evt file, extra rows are filled as -1
| Pixel properties | Quadrant properties | ||||||
|---|---|---|---|---|---|---|---|
| Quadrant | DetID | PixID | Counts | Sigma | Mean | Median | Sigma |
| A | 0 | 29 | 248 | 10.39 | 64 | 60 | 18.1 |
| A | 7 | 110 | 218 | 8.73 | 64 | 60 | 18.1 |
| A | 0 | 30 | 204 | 7.96 | 64 | 60 | 18.1 |
| B | 2 | 9 | 220 | 10.52 | 63 | 60 | 15.2 |
| B | 12 | 226 | 184 | 8.15 | 63 | 60 | 15.2 |
| B | 5 | 128 | 181 | 7.96 | 63 | 60 | 15.2 |
| C | 1 | 81 | 171 | 6.09 | 63 | 59 | 18.4 |
| C | 12 | 241 | 169 | 5.98 | 63 | 59 | 18.4 |
| C | 9 | 188 | 167 | 5.88 | 63 | 59 | 18.4 |
| D | 6 | 231 | 177 | 6.98 | 59 | 54 | 17.6 |
| D | 6 | 83 | 157 | 5.85 | 59 | 54 | 17.6 |
| D | 7 | 5 | 154 | 5.68 | 59 | 54 | 17.6 |
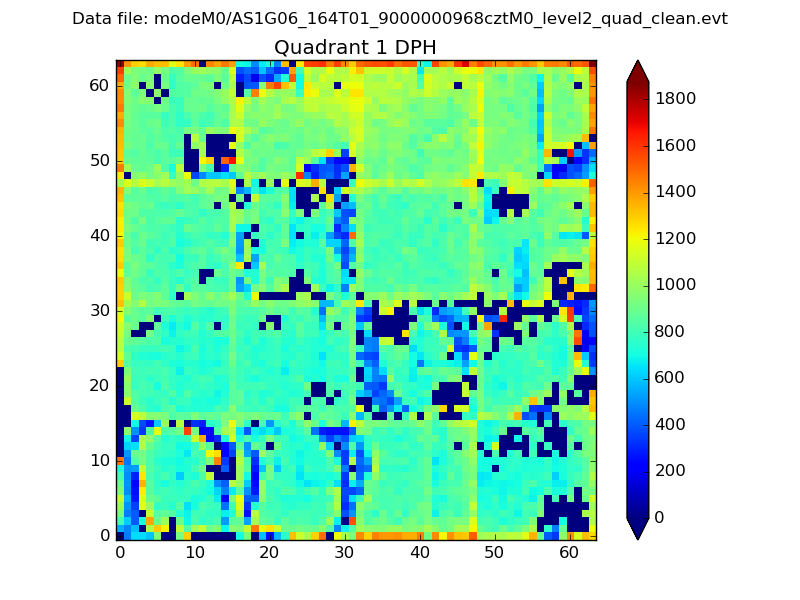
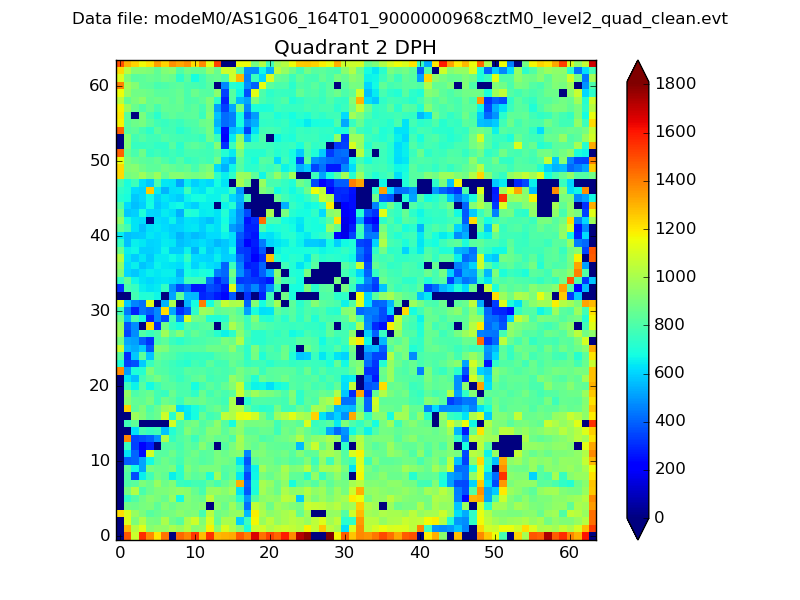
Histogram calculated using DETX and DETY for each event in the final _common_clean file
| Quadrant A |  |
 |
Quadrant B |
|---|---|---|---|
| Quadrant D | 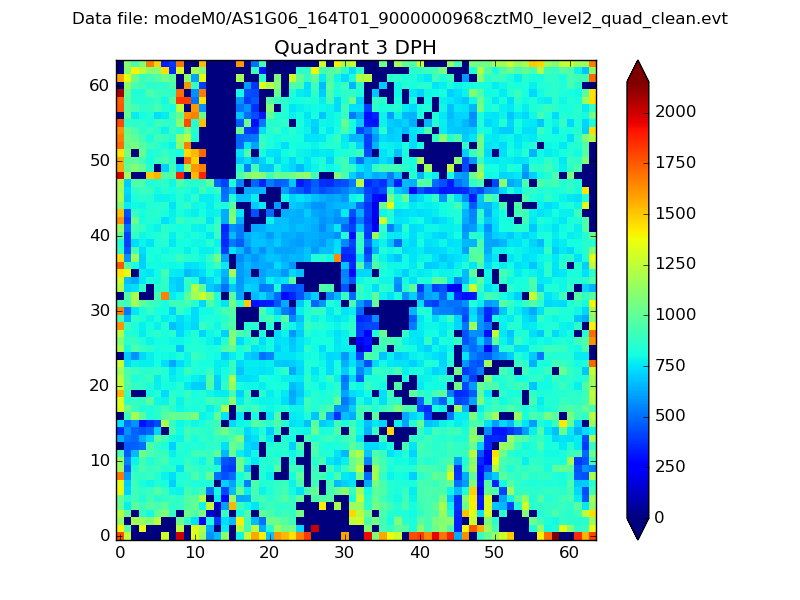 |
 |
Quadrant C |
| Plot type | Count rate plots | Images |
|---|---|---|
| Comparison with Poisson distribution Blue bars denote a histogram of data divided into 1 sec bins. Red curve is a Poisson curve with rate = median count rate of data. |
 |
 |
| Quadrant-wise count rates Data is divided into 100 sec bins |
 |
|
| Module-wise count rates for Quadrant A Data is divided into 100 sec bins |
 |
 |
| Module-wise count rates for Quadrant B Data is divided into 100 sec bins |
 |
 |
| Module-wise count rates for Quadrant C Data is divided into 100 sec bins |
 |
 |
| Module-wise count rates for Quadrant D Data is divided into 100 sec bins |
 |
 |
| Parameter | Plot |
|---|---|
| CZT HV Monitor |  |
| D_VDD |  |
| Temperature 1 |  |
| Veto HV Monitor |  |
| Veto LLD |  |
| Alpha Counter |  |
| _CPM_Rate |  |
| CZT Counter |  |
| +2.5 Volts monitor |  |
| +5 Volts monitor |  |
| _ROLL_ROT |  |
| _Roll_DEC |  |
| _Roll_RA |  |
| Veto Counter |  |