| Param | Original file | Final file |
|---|---|---|
| Filename | modeM0/AS1G06_164T01_9000000968_07075cztM0_level2.evt | modeM0/AS1G06_164T01_9000000968_07075cztM0_level2_quad_clean.evt |
| Size (bytes) | 416,655,360 | 106,295,040 |
| Size | 397.4 MB | 101.4 MB |
| Events in quadrant A | 3,220,549 | 690,265 |
| Events in quadrant B | 3,009,732 | 717,843 |
| Events in quadrant C | 2,859,711 | 692,977 |
| Events in quadrant D | 3,087,892 | 666,660 |
| Mode M9 | |||
|---|---|---|---|
| Quadrant | BADHDUFLAG | Total packets | Discarded packets |
| A | 0 | 22 | 0 |
| B | 0 | 22 | 0 |
| C | 0 | 22 | 0 |
| D | 0 | 22 | 0 |
| Mode SS | |||
|---|---|---|---|
| Quadrant | BADHDUFLAG | Total packets | Discarded packets |
| A | 0 | 134 | 0 |
| B | 0 | 134 | 0 |
| C | 0 | 134 | 0 |
| D | 0 | 134 | 0 |
| Mode M0 | |||
|---|---|---|---|
| Quadrant | BADHDUFLAG | Total packets | Discarded packets |
| A | 0 | 14133 | 3 |
| B | 0 | 13373 | 2 |
| C | 0 | 13229 | 2 |
| D | 0 | 13664 | 2 |
| Quadrant | Total seconds | Saturated seconds | Saturation percentage |
|---|---|---|---|
| A | 6470 | 219 | 3.384853% |
| B | 6470 | 27 | 0.417311% |
| C | 6470 | 13 | 0.200927% |
| D | 6470 | 23 | 0.355487% |
Noise dominated data is calculated using 1-second bins in cleaned event files. If a bin has >2000 counts, and if more than 50% of those come from <1% of pixels, then it is considered to be noise-dominated and hence unusable.
| Quadrant | # 1 sec bins | Bins with >0 counts | Bins with >2000 counts | High rate bins dominated by noise | Noise dominated (total time) | Noise dominated (detector-on time) | Marked lightcurve |
|---|---|---|---|---|---|---|---|
| A | 8675 | 6472 | 153 | 153 | 1.76% | 2.36% | 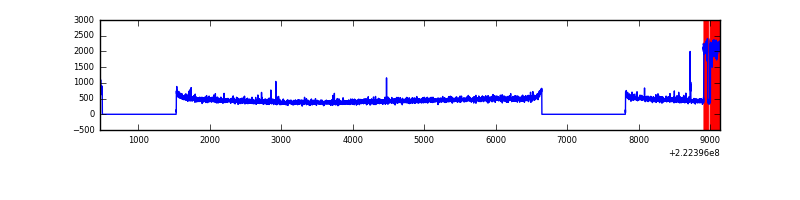 |
| B | 8675 | 6472 | 1 | 1 | 0.01% | 0.02% | 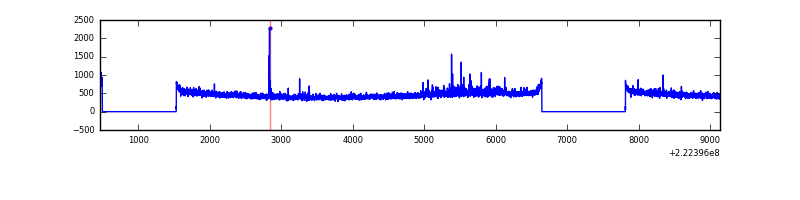 |
| C | 8675 | 6472 | 2 | 2 | 0.02% | 0.03% | 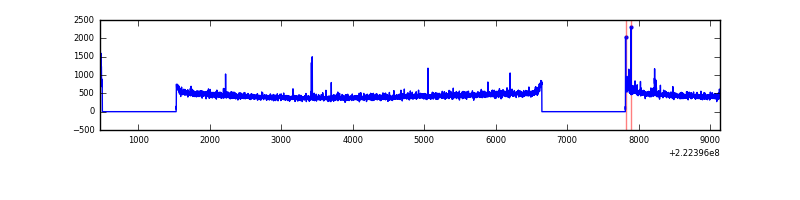 |
| D | 8675 | 6472 | 9 | 9 | 0.10% | 0.14% | 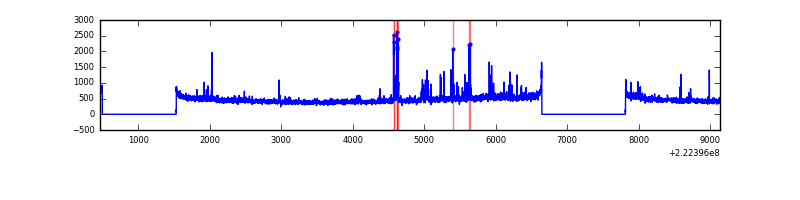 |
Top three noisy pixels from each quadrant. If the there are fewer than three noisy pixels in the level2.evt file, extra rows are filled as -1
| Pixel properties | Quadrant properties | ||||||
|---|---|---|---|---|---|---|---|
| Quadrant | DetID | PixID | Counts | Sigma | Mean | Median | Sigma |
| A | 14 | 111 | 378892 | 2539.91 | 733 | 718 | 148.9 |
| A | 8 | 15 | 12701 | 80.48 | 733 | 718 | 148.9 |
| A | 0 | 226 | 6921 | 41.66 | 733 | 718 | 148.9 |
| B | 0 | 214 | 70621 | 492.03 | 754 | 736 | 142.0 |
| B | 0 | 219 | 16083 | 108.05 | 754 | 736 | 142.0 |
| B | 12 | 111 | 14209 | 94.86 | 754 | 736 | 142.0 |
| C | 4 | 254 | 24230 | 140.75 | 720 | 723 | 167.0 |
| C | 7 | 247 | 19673 | 113.47 | 720 | 723 | 167.0 |
| C | 13 | 61 | 5697 | 29.78 | 720 | 723 | 167.0 |
| D | 8 | 195 | 241424 | 1387.08 | 714 | 693 | 173.6 |
| D | 12 | 144 | 35259 | 199.17 | 714 | 693 | 173.6 |
| D | 12 | 233 | 34159 | 192.83 | 714 | 693 | 173.6 |
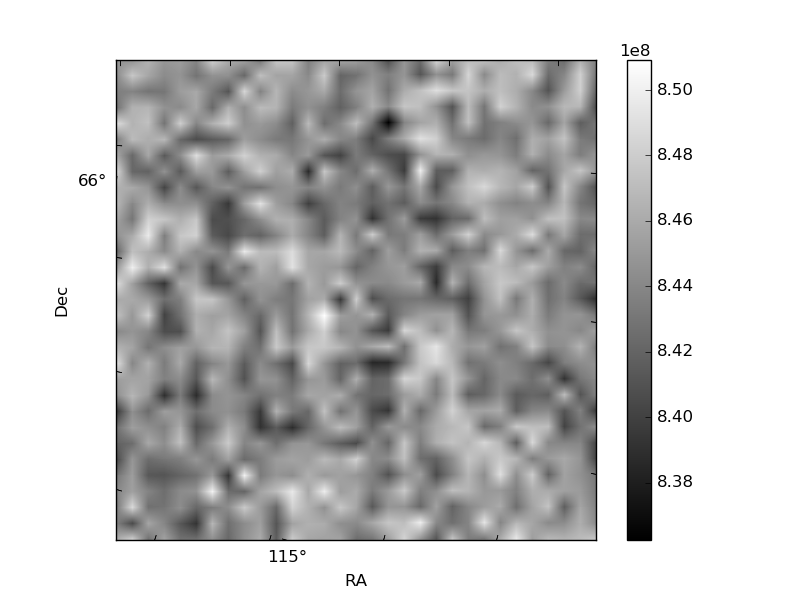
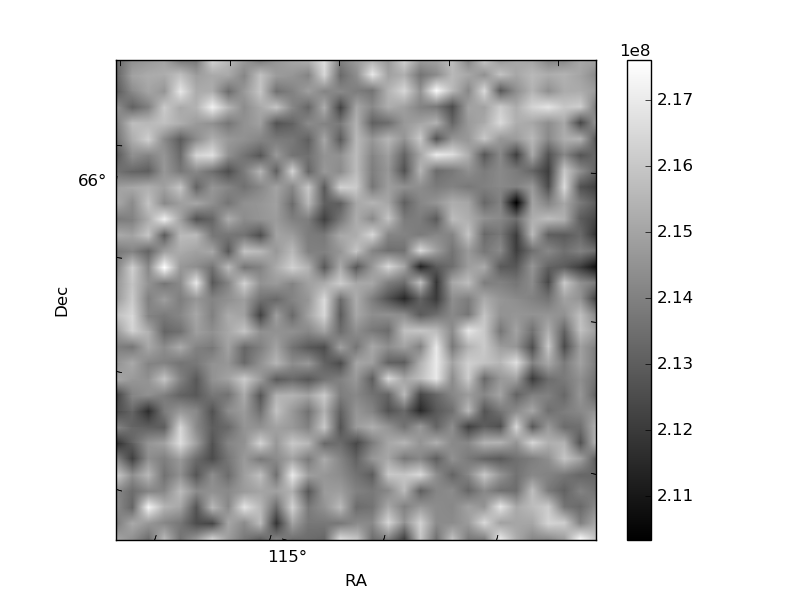
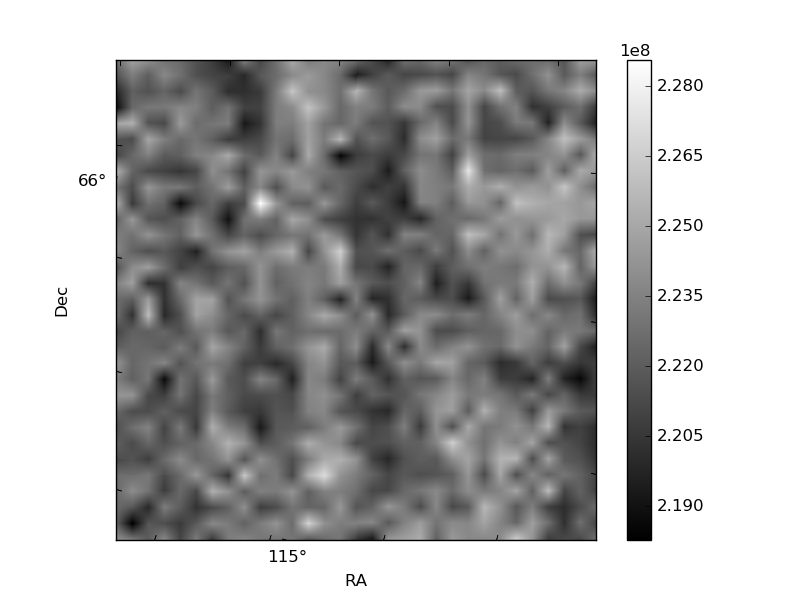
Histogram calculated using DETX and DETY for each event in the final _common_clean file
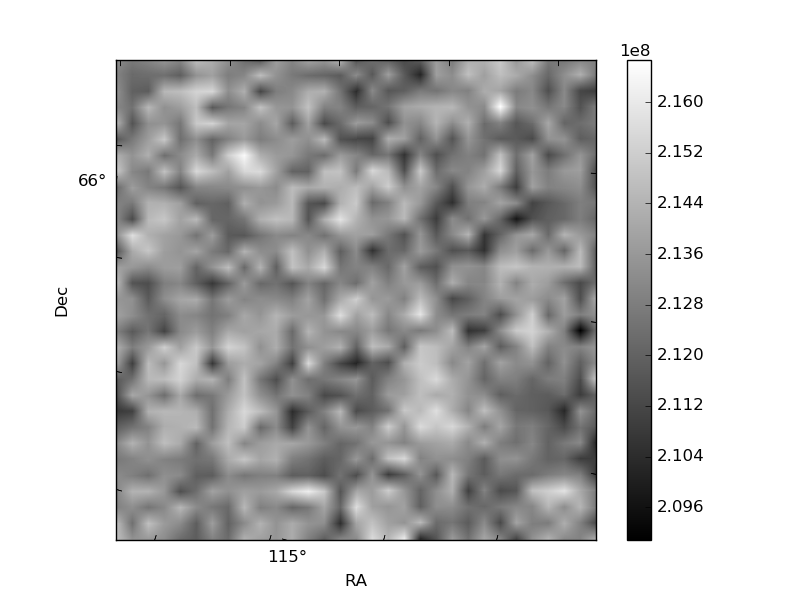
| Quadrant A | 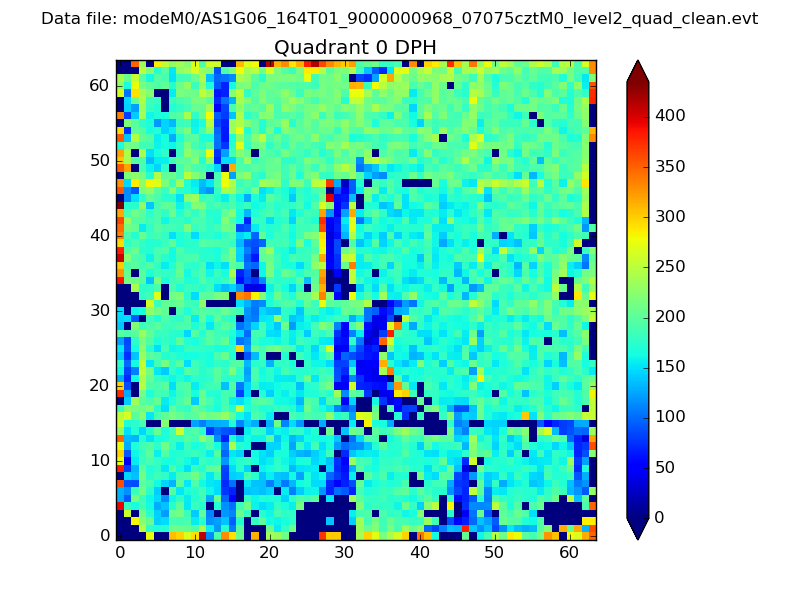 |
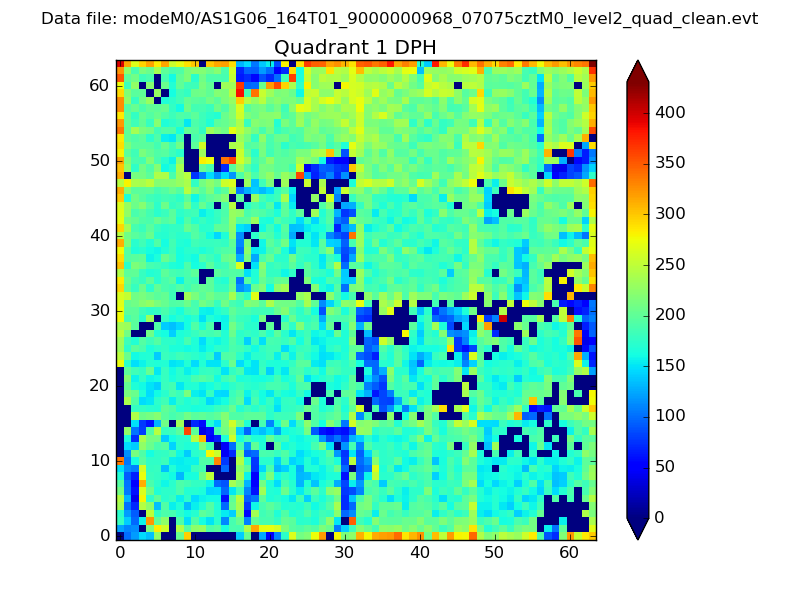 |
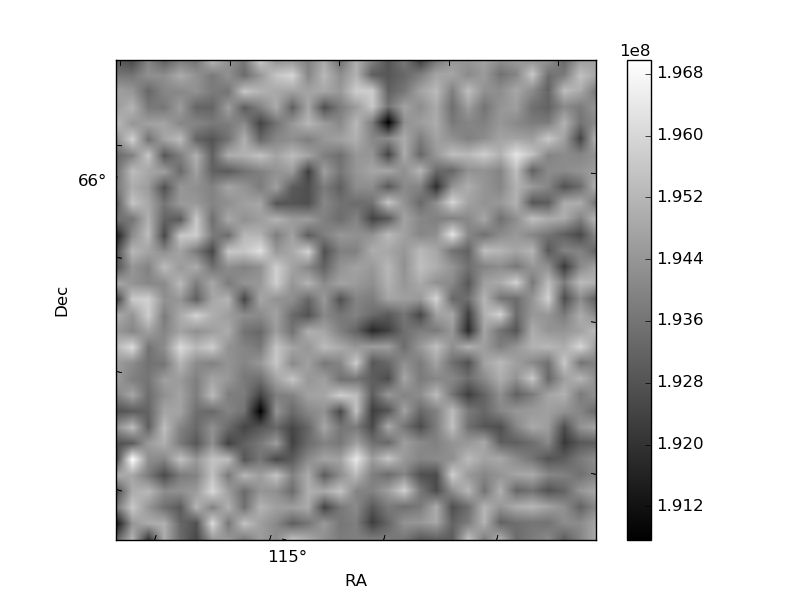
Quadrant B |
|---|---|---|---|
| Quadrant D |  |
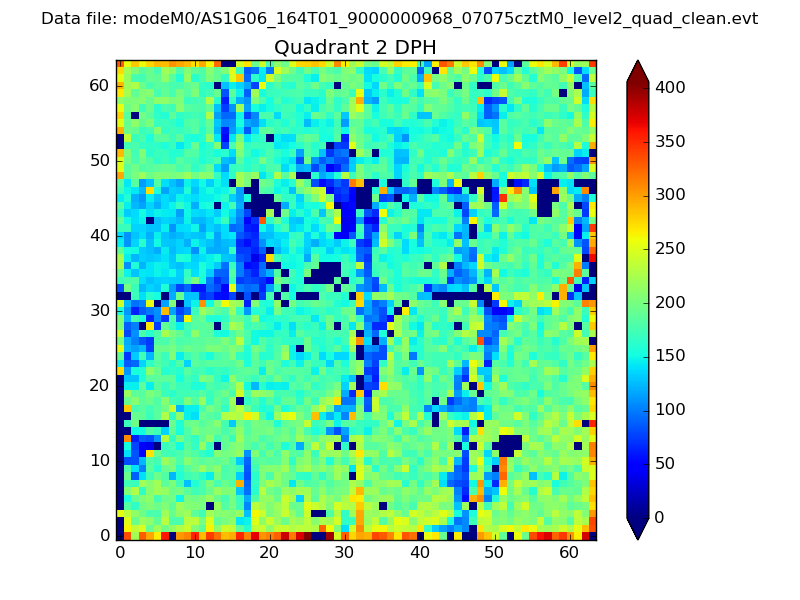 |
Quadrant C |
| Plot type | Count rate plots | Images |
|---|---|---|
| Comparison with Poisson distribution Blue bars denote a histogram of data divided into 1 sec bins. Red curve is a Poisson curve with rate = median count rate of data. |
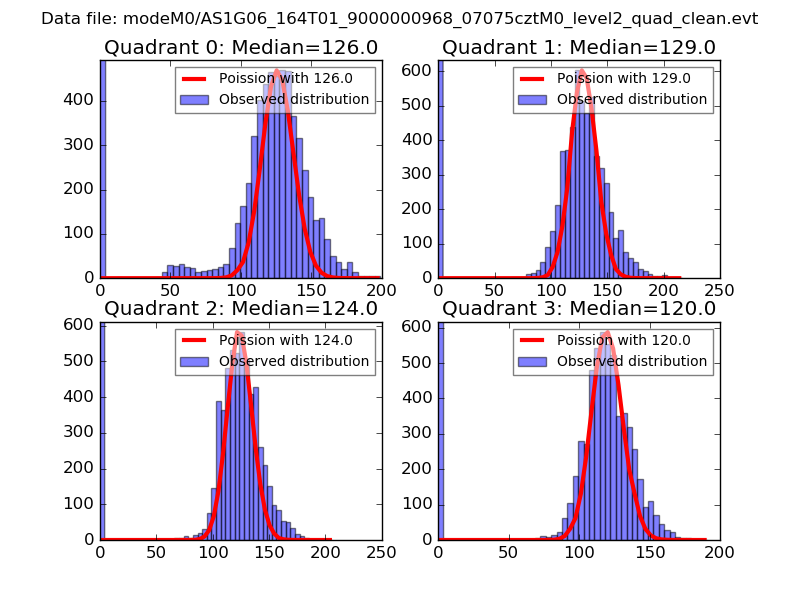 |
 |
| Quadrant-wise count rates Data is divided into 100 sec bins |
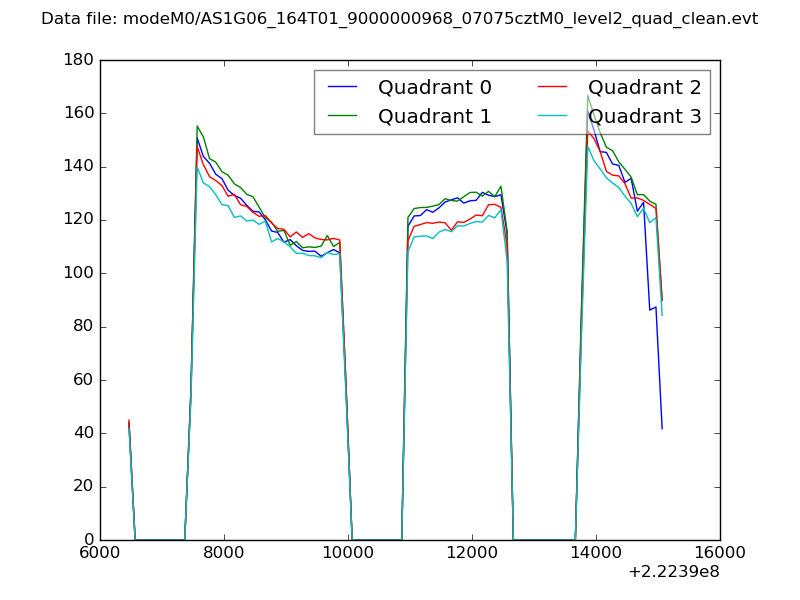 |
|
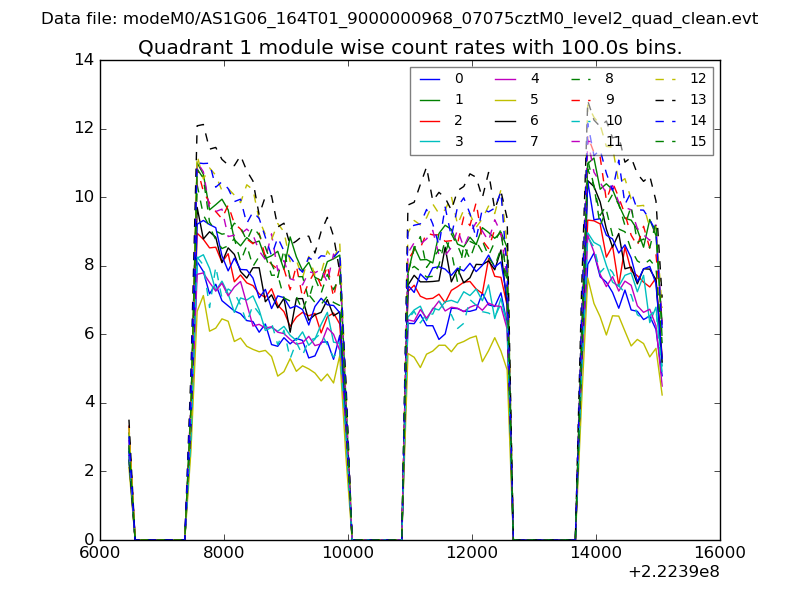
| Module-wise count rates for Quadrant A Data is divided into 100 sec bins |
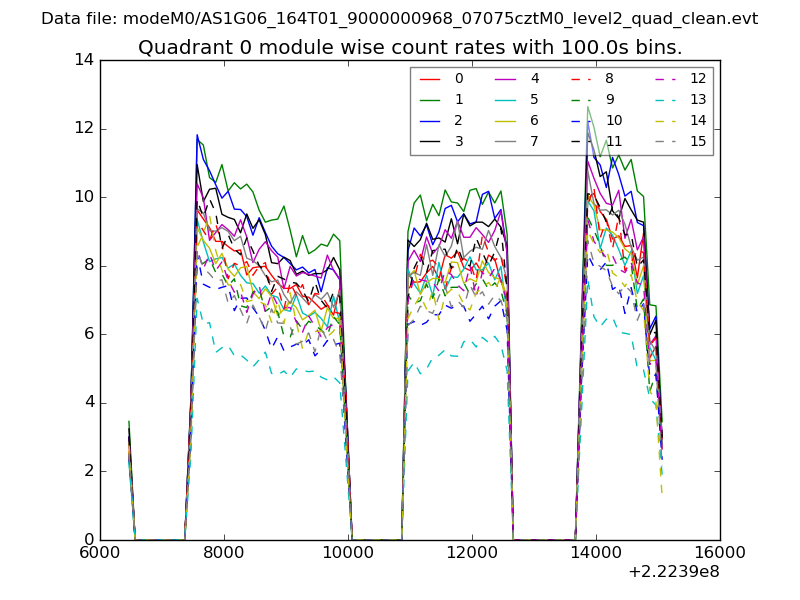 |
 |
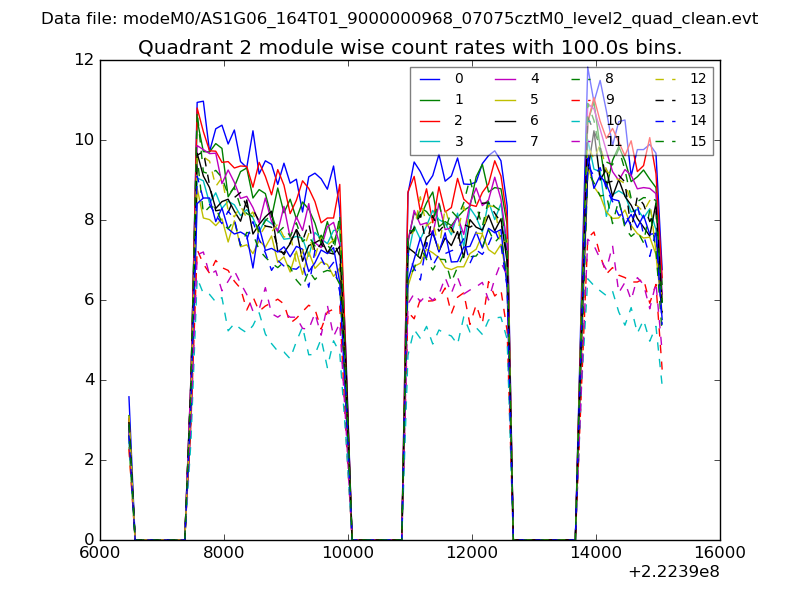
| Module-wise count rates for Quadrant B Data is divided into 100 sec bins |
 |
 |
| Module-wise count rates for Quadrant C Data is divided into 100 sec bins |
 |
 |
| Module-wise count rates for Quadrant D Data is divided into 100 sec bins |
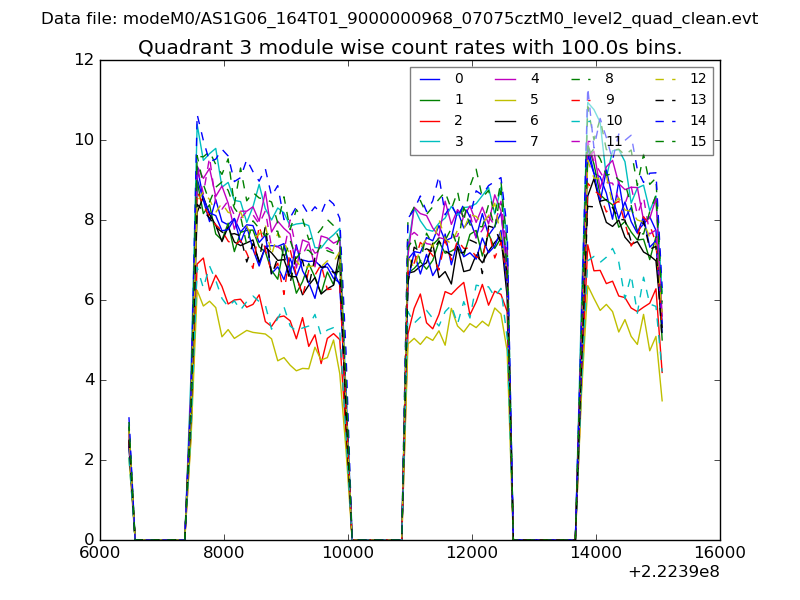 |
 |
| Parameter | Plot |
|---|---|
| CZT HV Monitor | 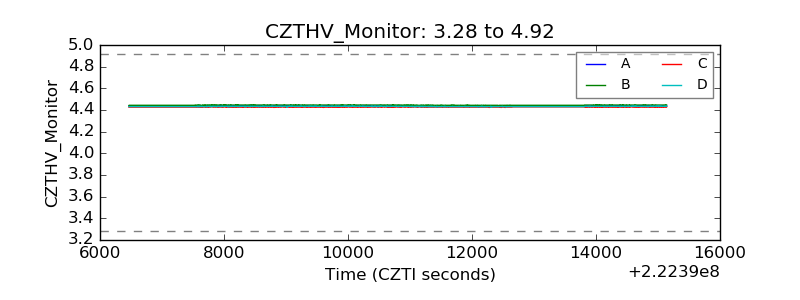 |
| D_VDD | 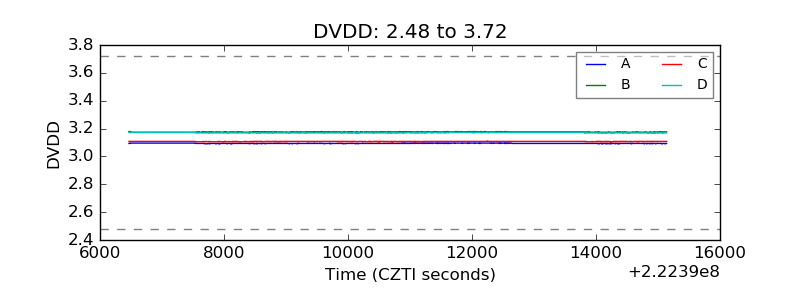 |
| Temperature 1 | 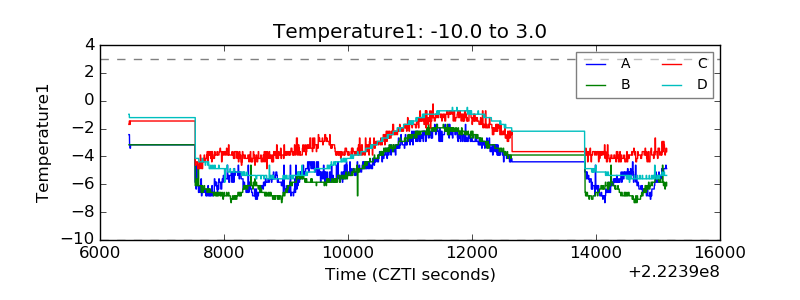 |
| Veto HV Monitor | 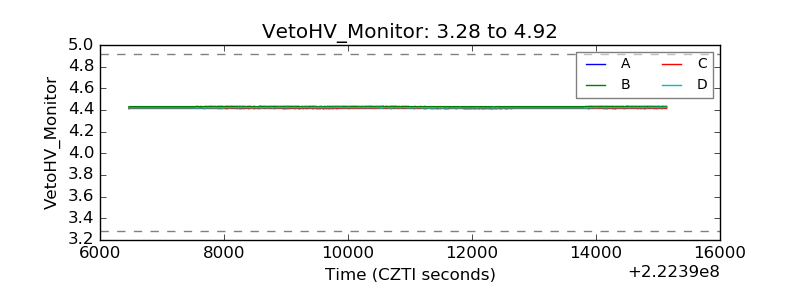 |
| Veto LLD | 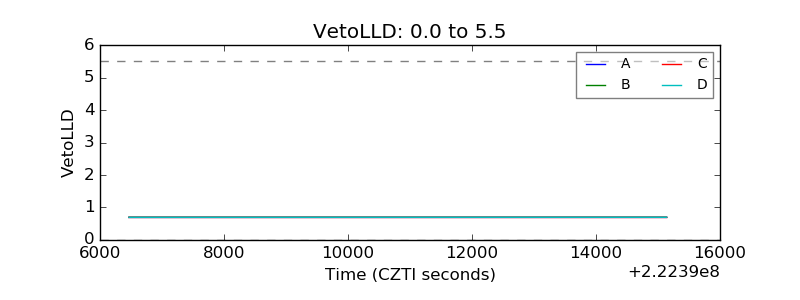 |
| Alpha Counter | 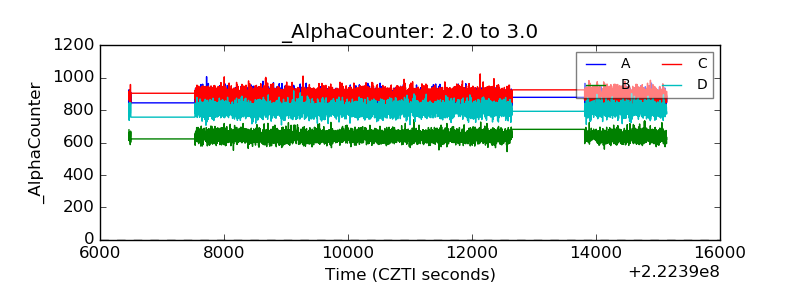 |
| _CPM_Rate | 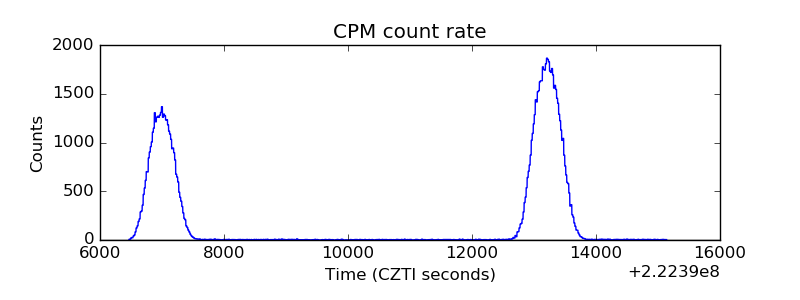 |
| CZT Counter | 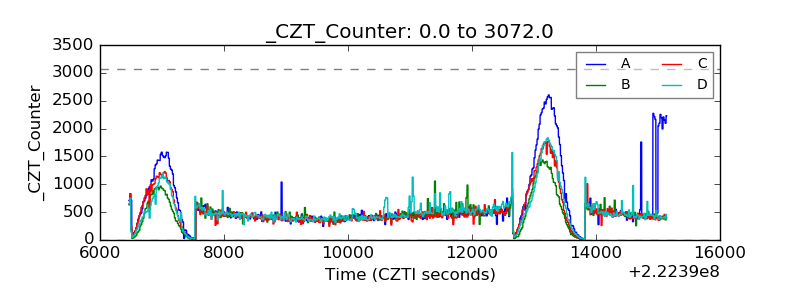 |
| +2.5 Volts monitor | 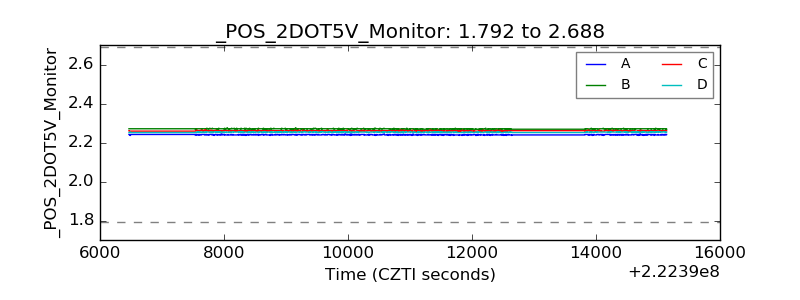 |
| +5 Volts monitor |  |
| _ROLL_ROT | 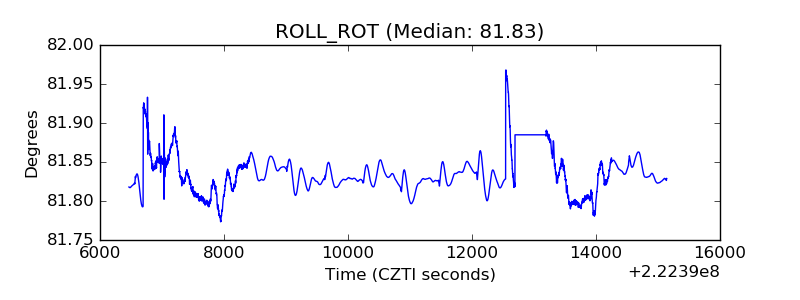 |
| _Roll_DEC | 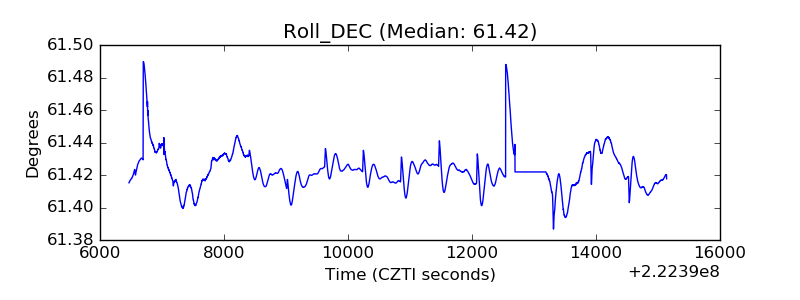 |
| _Roll_RA | 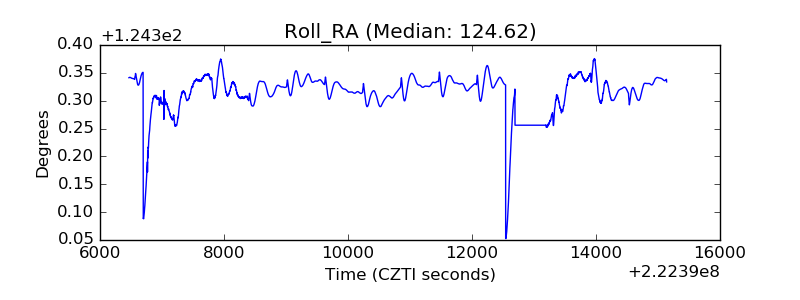 |
| Veto Counter | 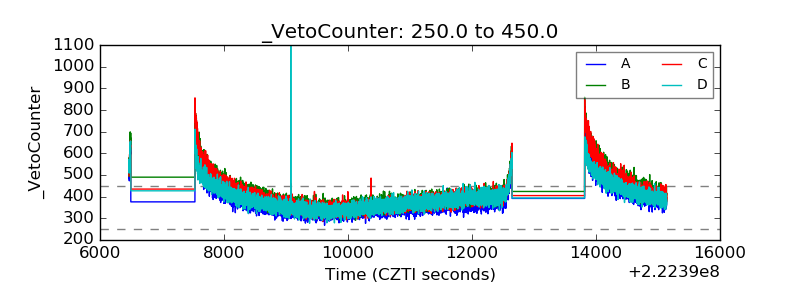 |