| Param | Original file | Final file |
|---|---|---|
| Filename | modeM0/AS1G06_164T01_9000000968_07076cztM0_level2.evt | modeM0/AS1G06_164T01_9000000968_07076cztM0_level2_quad_clean.evt |
| Size (bytes) | 496,123,200 | 108,987,840 |
| Size | 473.1 MB | 103.9 MB |
| Events in quadrant A | 4,268,815 | 667,036 |
| Events in quadrant B | 3,120,215 | 763,914 |
| Events in quadrant C | 2,926,512 | 727,600 |
| Events in quadrant D | 4,263,615 | 685,045 |
| Mode M9 | |||
|---|---|---|---|
| Quadrant | BADHDUFLAG | Total packets | Discarded packets |
| A | 0 | 18 | 0 |
| B | 0 | 18 | 0 |
| C | 0 | 18 | 0 |
| D | 0 | 19 | 0 |
| Mode SS | |||
|---|---|---|---|
| Quadrant | BADHDUFLAG | Total packets | Discarded packets |
| A | 0 | 132 | 0 |
| B | 0 | 132 | 0 |
| C | 0 | 132 | 0 |
| D | 0 | 132 | 0 |
| Mode M0 | |||
|---|---|---|---|
| Quadrant | BADHDUFLAG | Total packets | Discarded packets |
| A | 0 | 17098 | 3 |
| B | 0 | 13611 | 2 |
| C | 0 | 13378 | 2 |
| D | 0 | 17094 | 2 |
| Quadrant | Total seconds | Saturated seconds | Saturation percentage |
|---|---|---|---|
| A | 6548 | 1930 | 29.474649% |
| B | 6548 | 47 | 0.717776% |
| C | 6548 | 20 | 0.305437% |
| D | 6548 | 382 | 5.833842% |
Noise dominated data is calculated using 1-second bins in cleaned event files. If a bin has >2000 counts, and if more than 50% of those come from <1% of pixels, then it is considered to be noise-dominated and hence unusable.
| Quadrant | # 1 sec bins | Bins with >0 counts | Bins with >2000 counts | High rate bins dominated by noise | Noise dominated (total time) | Noise dominated (detector-on time) | Marked lightcurve |
|---|---|---|---|---|---|---|---|
| A | 7773 | 6549 | 242 | 242 | 3.11% | 3.70% | 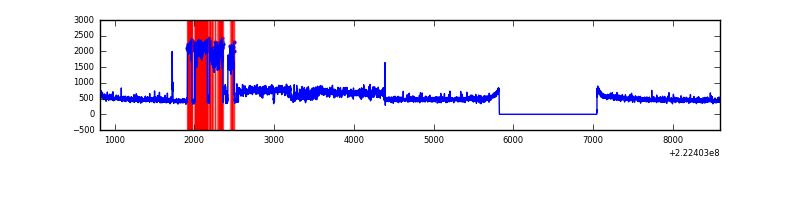 |
| B | 7773 | 6549 | 2 | 2 | 0.03% | 0.03% | 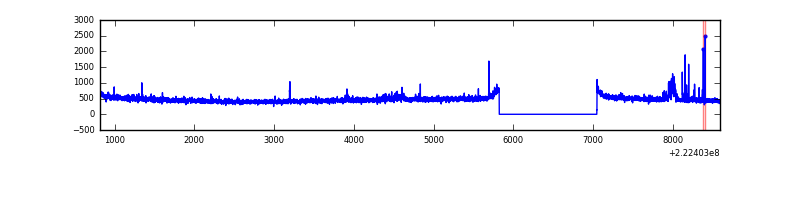 |
| C | 7773 | 6549 | 2 | 2 | 0.03% | 0.03% | 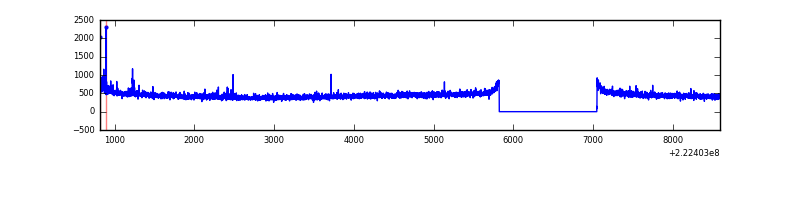 |
| D | 7773 | 6549 | 290 | 290 | 3.73% | 4.43% | 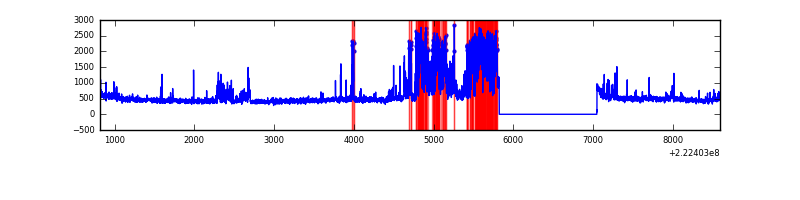 |
Top three noisy pixels from each quadrant. If the there are fewer than three noisy pixels in the level2.evt file, extra rows are filled as -1
| Pixel properties | Quadrant properties | ||||||
|---|---|---|---|---|---|---|---|
| Quadrant | DetID | PixID | Counts | Sigma | Mean | Median | Sigma |
| A | 14 | 111 | 1593235 | 11557.62 | 687 | 675 | 137.8 |
| A | 8 | 15 | 17204 | 119.95 | 687 | 675 | 137.8 |
| A | 13 | 14 | 12151 | 83.28 | 687 | 675 | 137.8 |
| B | 0 | 219 | 60354 | 407.01 | 781 | 763 | 146.4 |
| B | 0 | 214 | 27050 | 179.54 | 781 | 763 | 146.4 |
| B | 12 | 111 | 14580 | 94.37 | 781 | 763 | 146.4 |
| C | 7 | 247 | 22965 | 131.04 | 740 | 742 | 169.6 |
| C | 4 | 254 | 14738 | 82.53 | 740 | 742 | 169.6 |
| C | 13 | 61 | 5899 | 30.41 | 740 | 742 | 169.6 |
| D | 12 | 233 | 969134 | 5481.59 | 726 | 704 | 176.7 |
| D | 8 | 195 | 253274 | 1429.62 | 726 | 704 | 176.7 |
| D | 14 | 34 | 176061 | 992.57 | 726 | 704 | 176.7 |
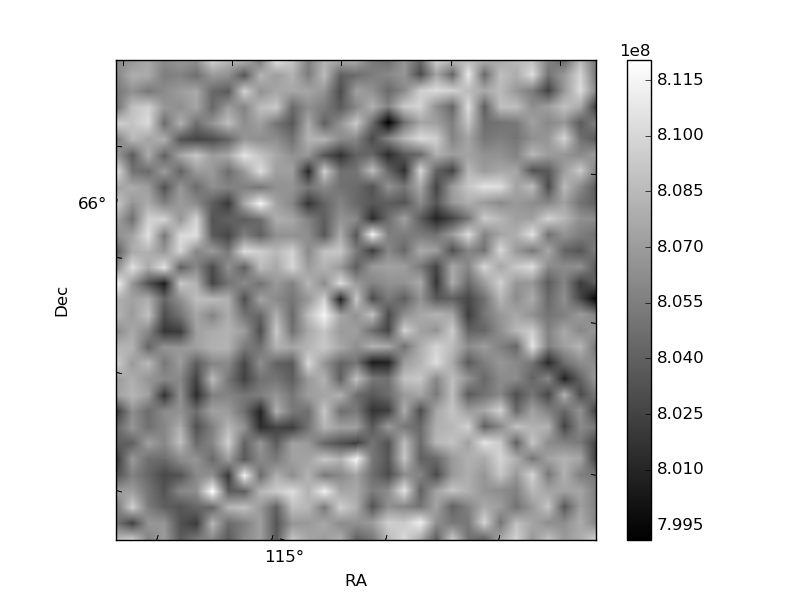
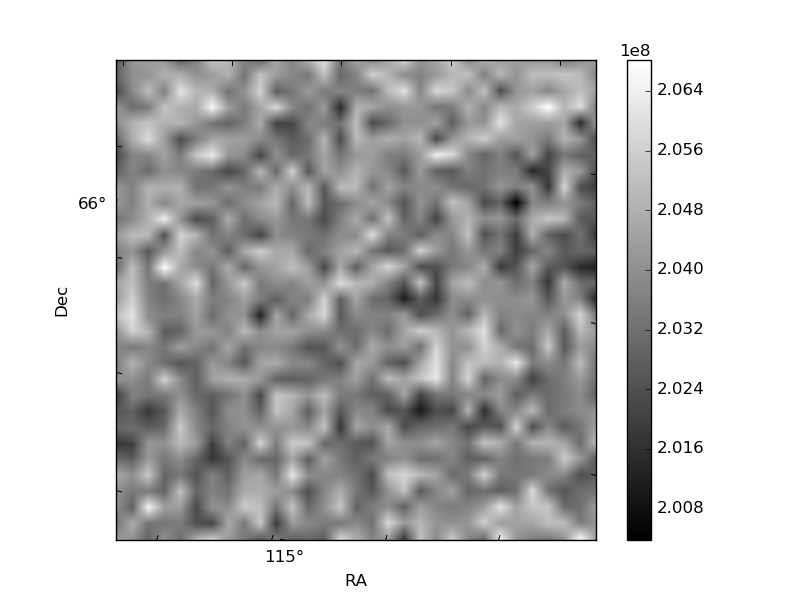
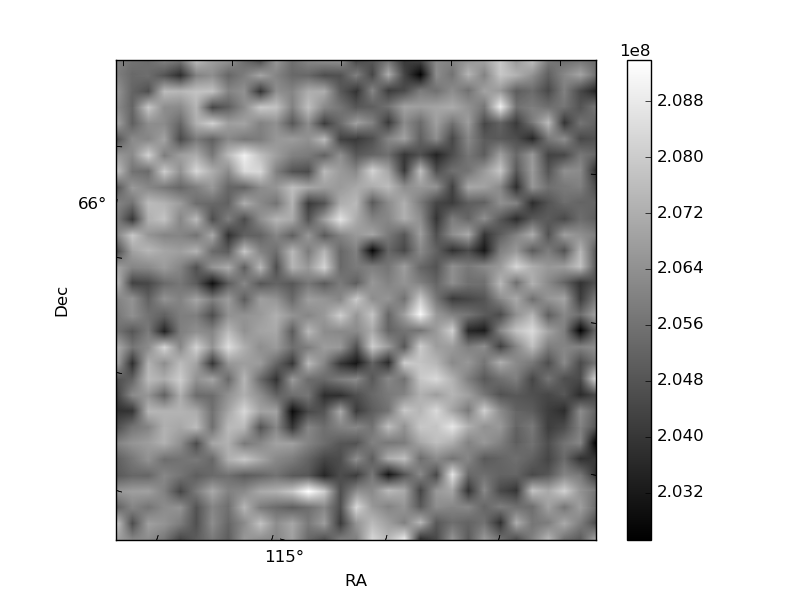
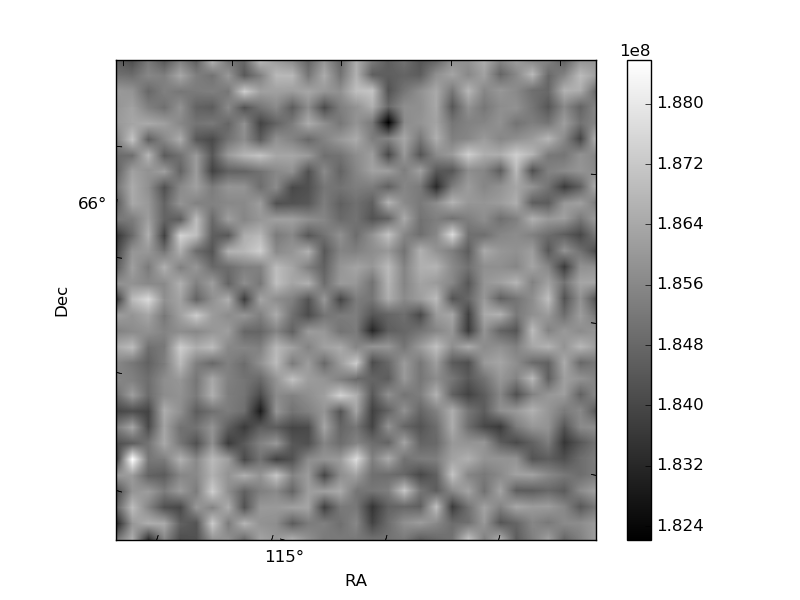
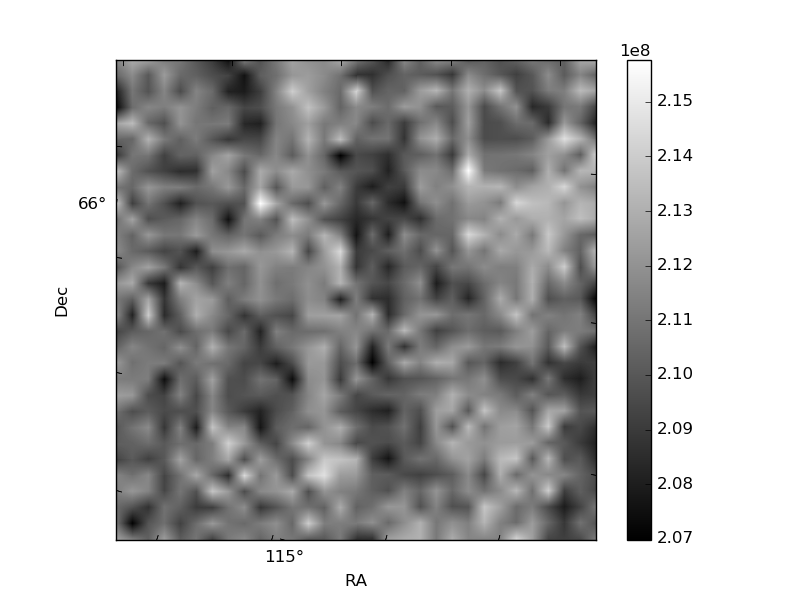
Histogram calculated using DETX and DETY for each event in the final _common_clean file
| Quadrant A | 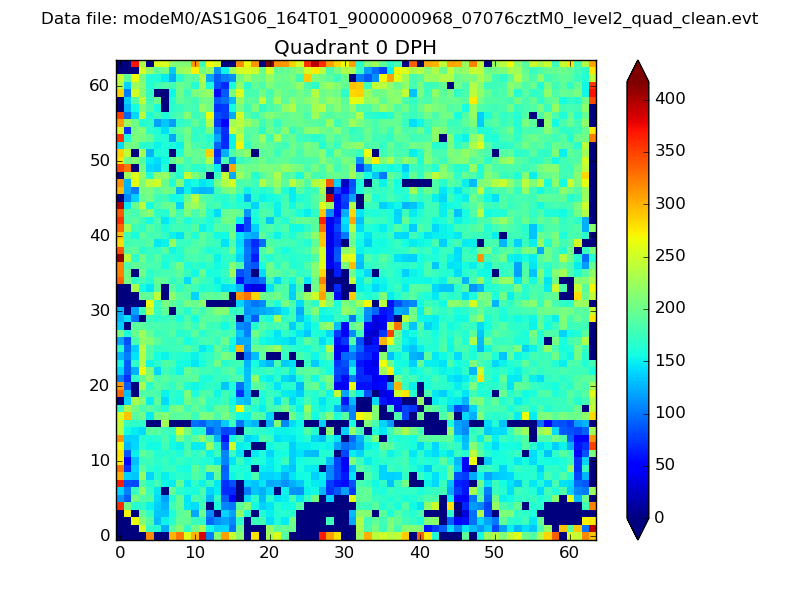 |
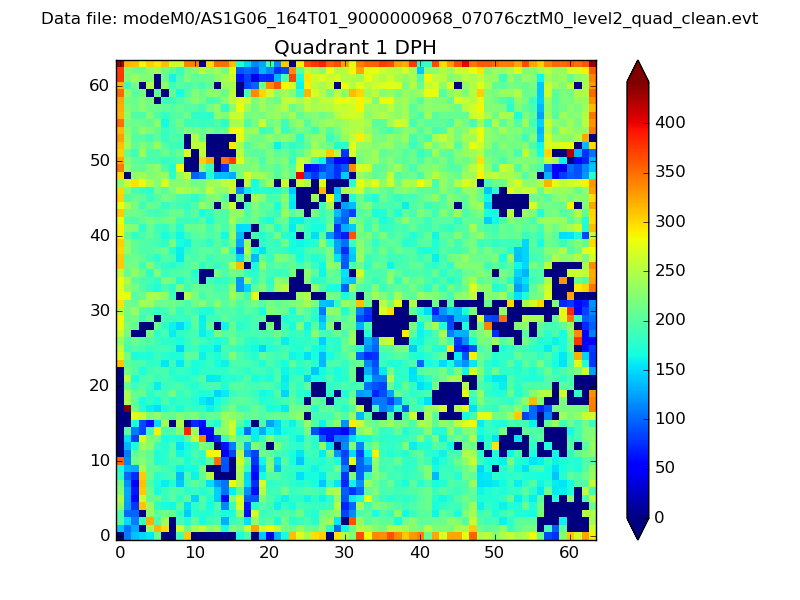 |
Quadrant B |
|---|---|---|---|
| Quadrant D | 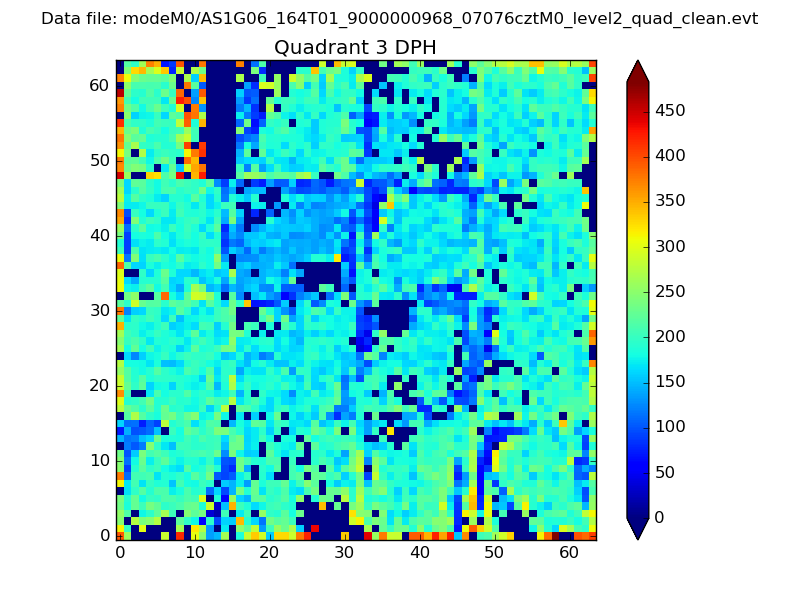 |
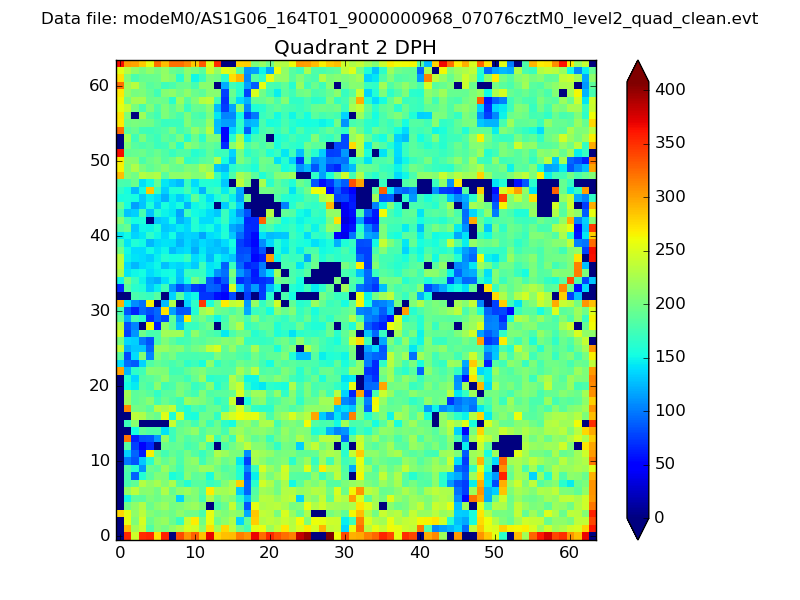 |
Quadrant C |
| Plot type | Count rate plots | Images |
|---|---|---|
| Comparison with Poisson distribution Blue bars denote a histogram of data divided into 1 sec bins. Red curve is a Poisson curve with rate = median count rate of data. |
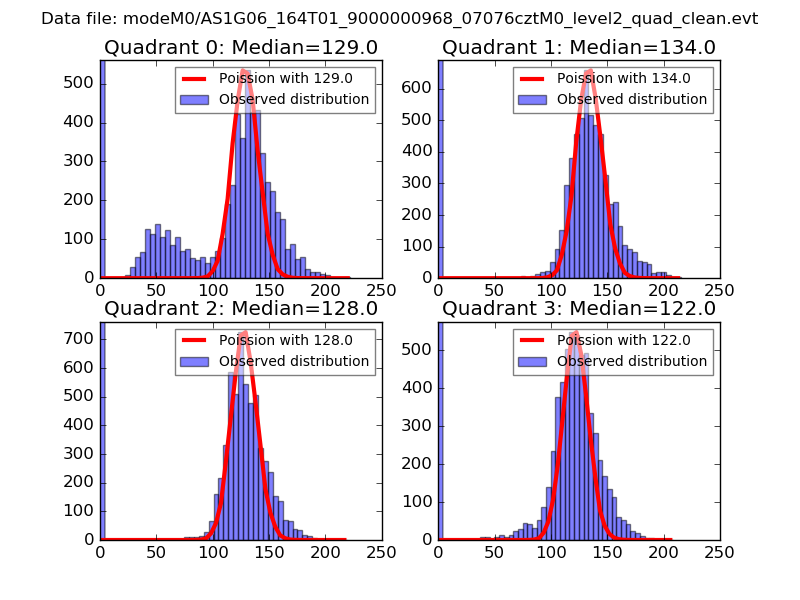 |
 |
| Quadrant-wise count rates Data is divided into 100 sec bins |
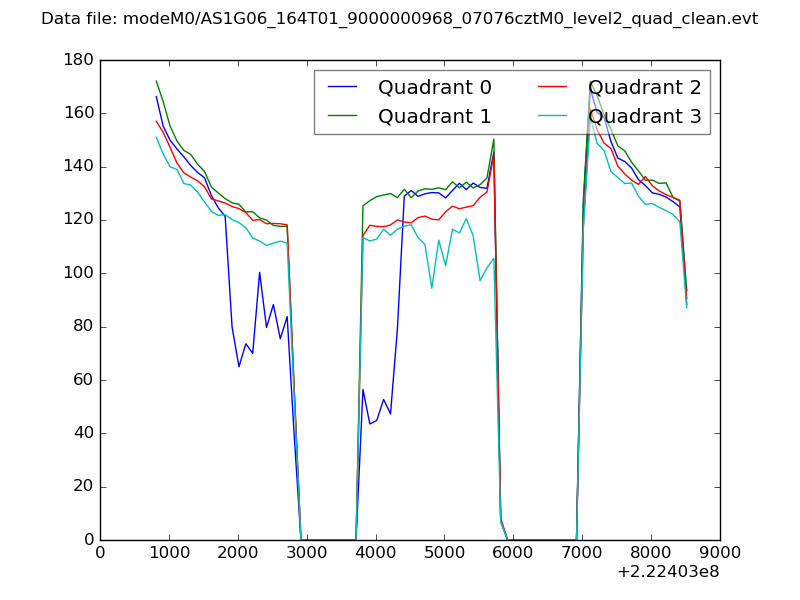 |
|
| Module-wise count rates for Quadrant A Data is divided into 100 sec bins |
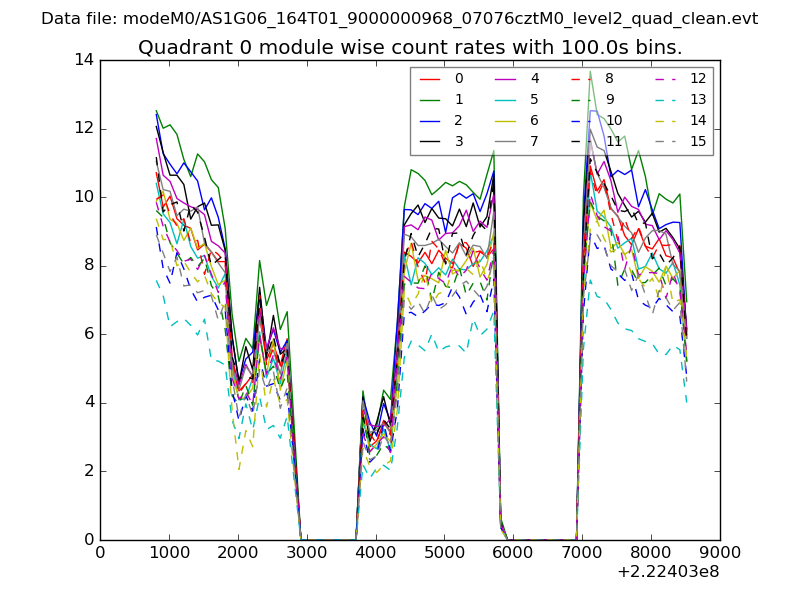 |
 |
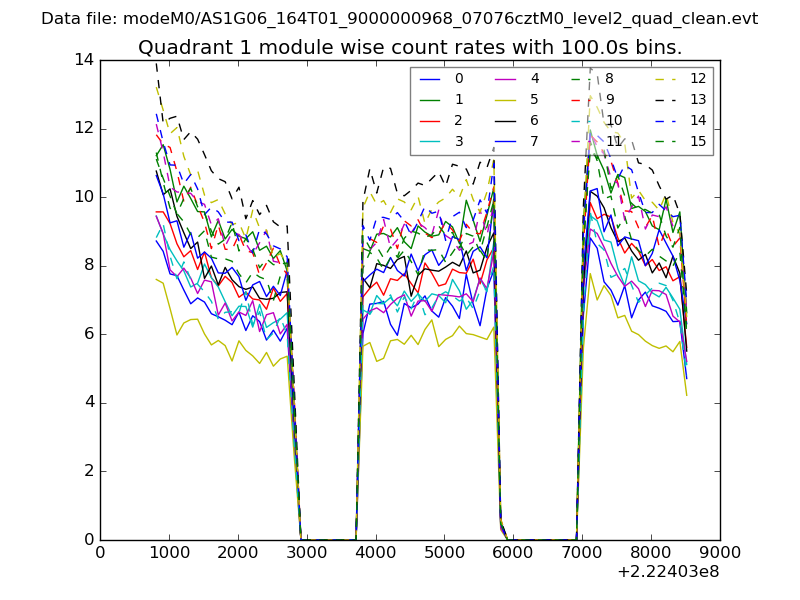
| Module-wise count rates for Quadrant B Data is divided into 100 sec bins |
 |
 |
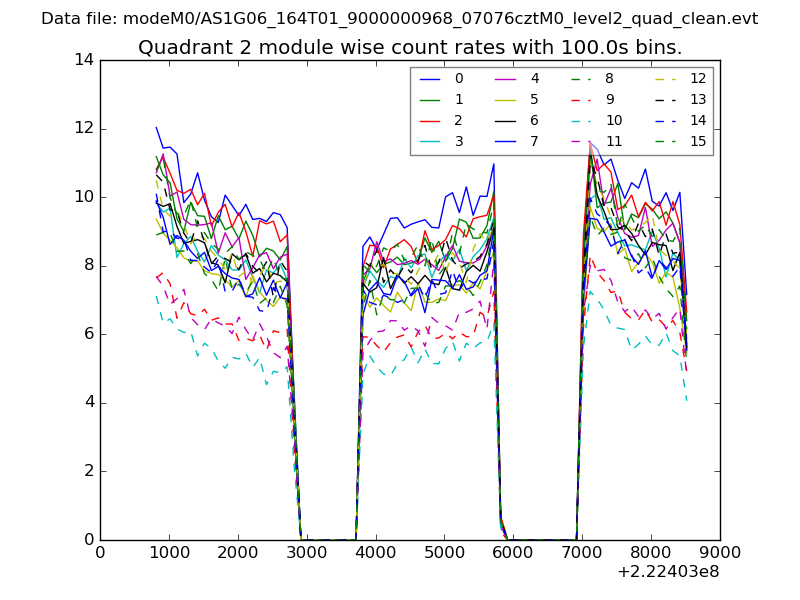
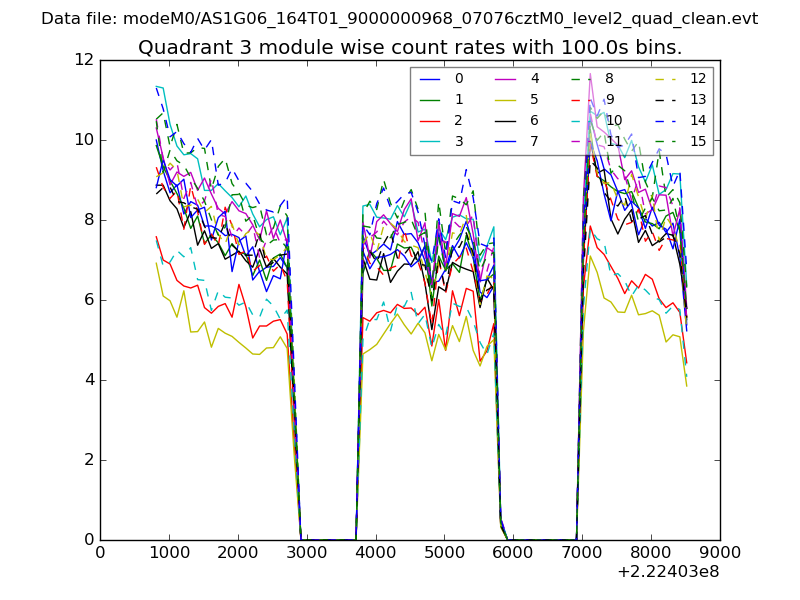
| Module-wise count rates for Quadrant C Data is divided into 100 sec bins |
 |
 |
| Module-wise count rates for Quadrant D Data is divided into 100 sec bins |
 |
 |
| Parameter | Plot |
|---|---|
| CZT HV Monitor | 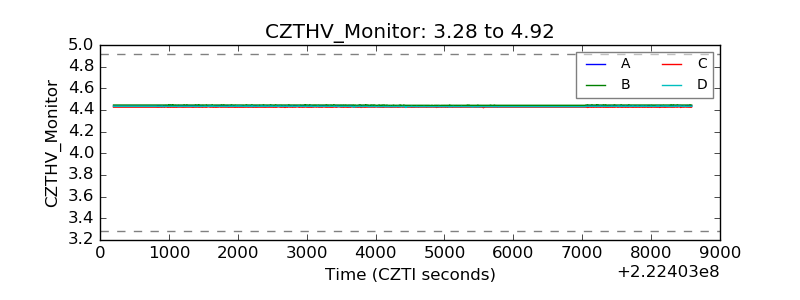 |
| D_VDD | 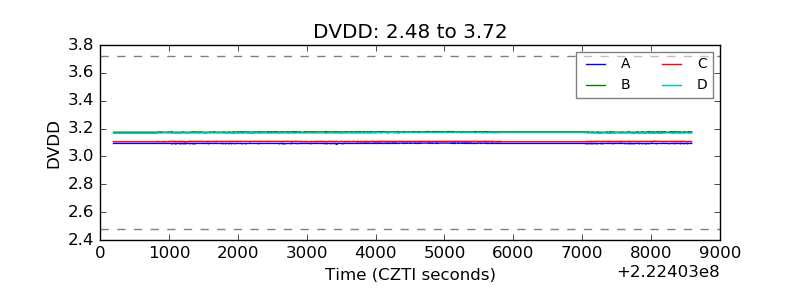 |
| Temperature 1 | 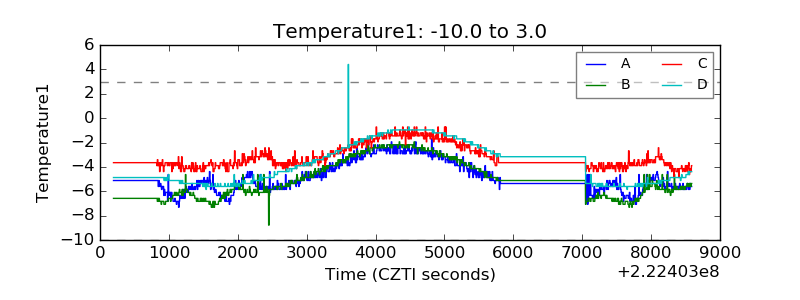 |
| Veto HV Monitor | 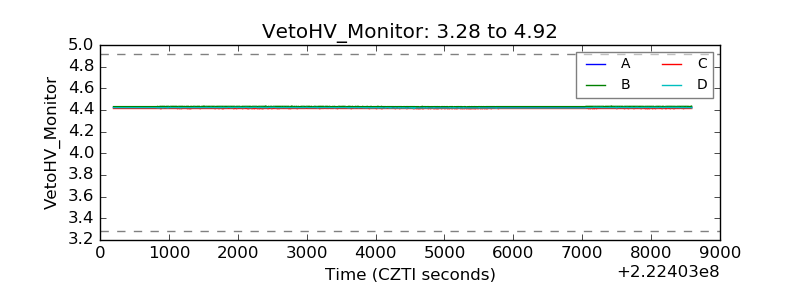 |
| Veto LLD | 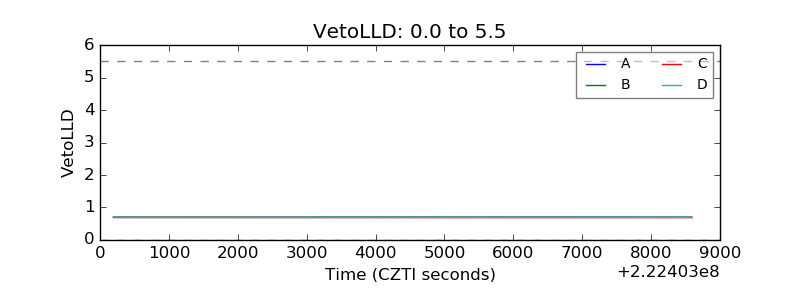 |
| Alpha Counter | 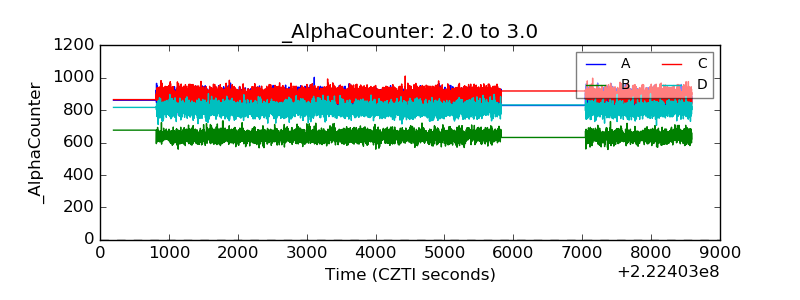 |
| _CPM_Rate | 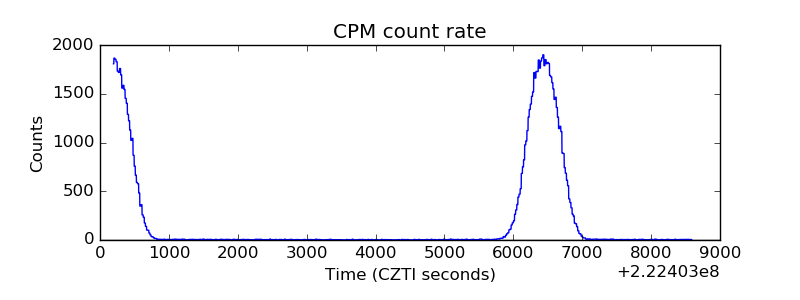 |
| CZT Counter | 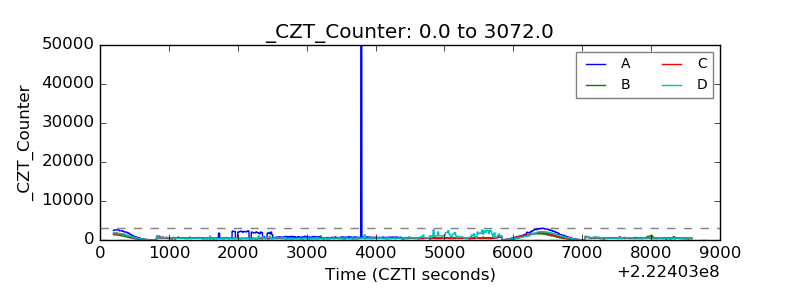 |
| +2.5 Volts monitor | 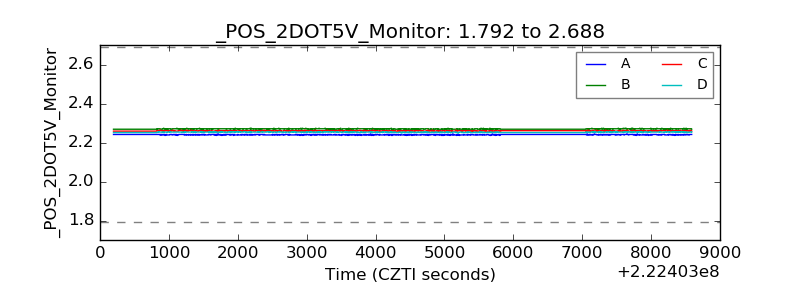 |
| +5 Volts monitor | 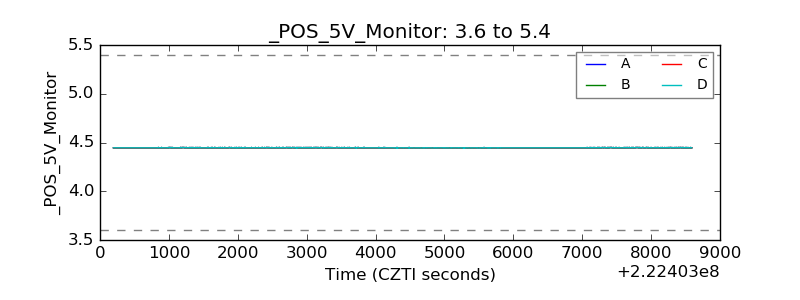 |
| _ROLL_ROT | 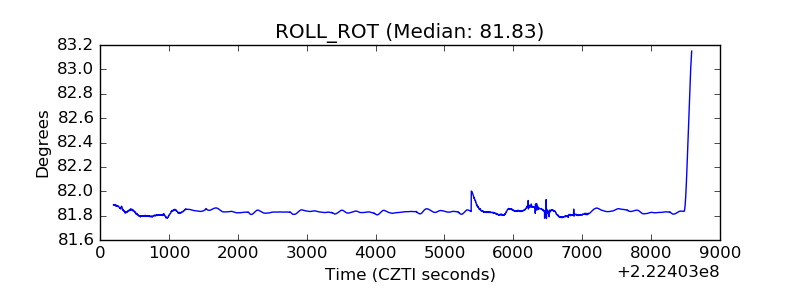 |
| _Roll_DEC | 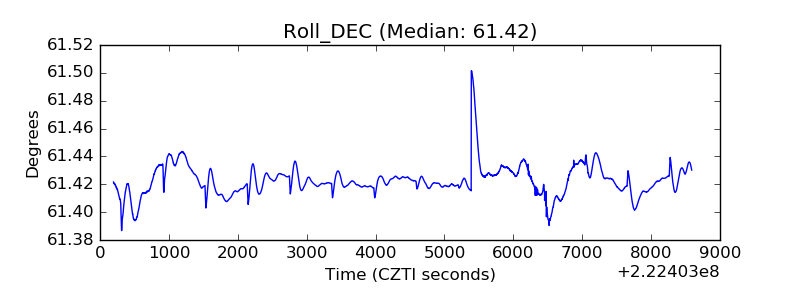 |
| _Roll_RA | 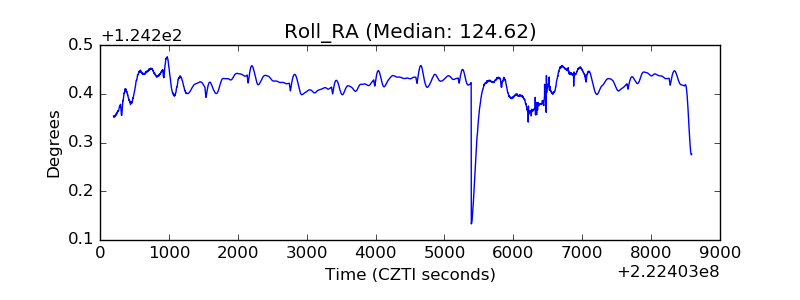 |
| Veto Counter | 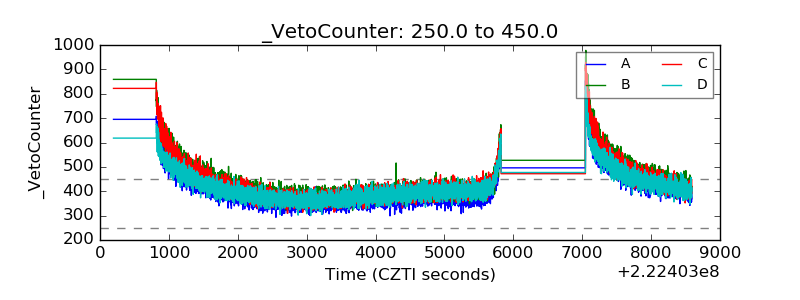 |