| Param | Original file | Final file |
|---|---|---|
| Filename | modeM0/AS1G06_164T01_9000000968_07080cztM0_level2.evt | modeM0/AS1G06_164T01_9000000968_07080cztM0_level2_quad_clean.evt |
| Size (bytes) | 293,042,880 | 66,648,960 |
| Size | 279.5 MB | 63.6 MB |
| Events in quadrant A | 2,018,082 | 437,298 |
| Events in quadrant B | 2,354,251 | 441,513 |
| Events in quadrant C | 2,174,099 | 416,014 |
| Events in quadrant D | 2,022,412 | 408,199 |
| Mode SS | |||
|---|---|---|---|
| Quadrant | BADHDUFLAG | Total packets | Discarded packets |
| A | 0 | 90 | 0 |
| B | 0 | 90 | 0 |
| C | 0 | 90 | 0 |
| D | 0 | 90 | 0 |
| Mode M0 | |||
|---|---|---|---|
| Quadrant | BADHDUFLAG | Total packets | Discarded packets |
| A | 0 | 9132 | 1 |
| B | 0 | 10014 | 1 |
| C | 0 | 9758 | 1 |
| D | 0 | 9369 | 1 |
| Quadrant | Total seconds | Saturated seconds | Saturation percentage |
|---|---|---|---|
| A | 4478 | 31 | 0.692273% |
| B | 4478 | 43 | 0.960250% |
| C | 4478 | 96 | 2.143814% |
| D | 4479 | 33 | 0.736772% |
Noise dominated data is calculated using 1-second bins in cleaned event files. If a bin has >2000 counts, and if more than 50% of those come from <1% of pixels, then it is considered to be noise-dominated and hence unusable.
| Quadrant | # 1 sec bins | Bins with >0 counts | Bins with >2000 counts | High rate bins dominated by noise | Noise dominated (total time) | Noise dominated (detector-on time) | Marked lightcurve |
|---|---|---|---|---|---|---|---|
| A | 4478 | 4478 | 0 | 0 | 0.00% | 0.00% | 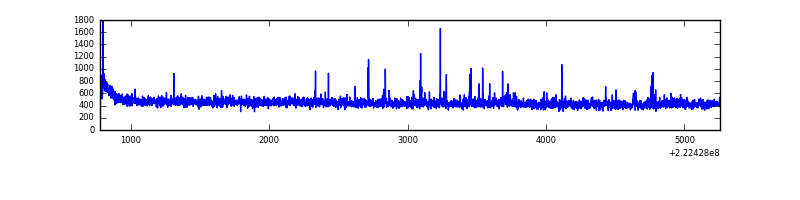 |
| B | 4478 | 4478 | 13 | 13 | 0.29% | 0.29% | 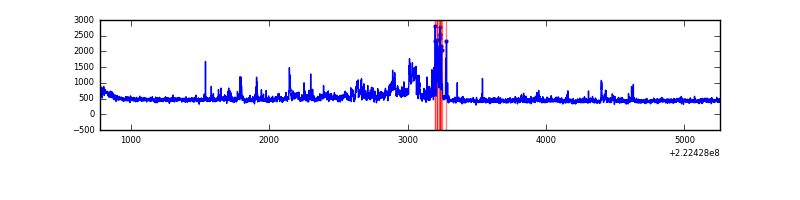 |
| C | 4478 | 4478 | 69 | 69 | 1.54% | 1.54% | 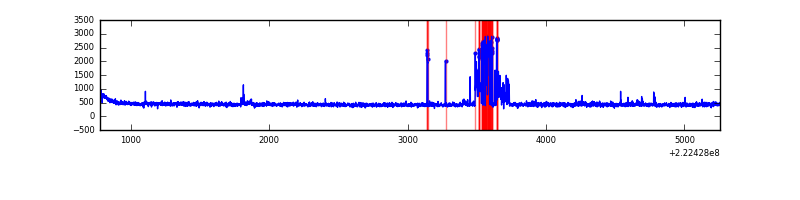 |
| D | 4479 | 4479 | 12 | 12 | 0.27% | 0.27% | 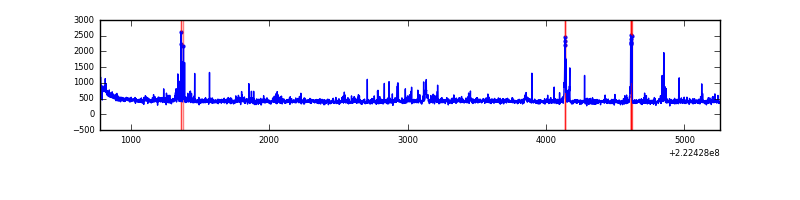 |
Top three noisy pixels from each quadrant. If the there are fewer than three noisy pixels in the level2.evt file, extra rows are filled as -1
| Pixel properties | Quadrant properties | ||||||
|---|---|---|---|---|---|---|---|
| Quadrant | DetID | PixID | Counts | Sigma | Mean | Median | Sigma |
| A | 8 | 15 | 51598 | 488.76 | 509 | 498 | 104.6 |
| A | 0 | 226 | 4913 | 42.23 | 509 | 498 | 104.6 |
| A | 12 | 194 | 4733 | 40.51 | 509 | 498 | 104.6 |
| B | 0 | 219 | 319724 | 3300.46 | 510 | 498 | 96.7 |
| B | 0 | 214 | 45603 | 466.34 | 510 | 498 | 96.7 |
| B | 12 | 111 | 9198 | 89.95 | 510 | 498 | 96.7 |
| C | 9 | 68 | 271780 | 2408.12 | 486 | 487 | 112.7 |
| C | 4 | 254 | 5207 | 41.9 | 486 | 487 | 112.7 |
| C | 13 | 61 | 3851 | 29.86 | 486 | 487 | 112.7 |
| D | 2 | 14 | 45453 | 370.91 | 492 | 476 | 121.3 |
| D | 14 | 34 | 34257 | 278.58 | 492 | 476 | 121.3 |
| D | 13 | 169 | 30640 | 248.75 | 492 | 476 | 121.3 |
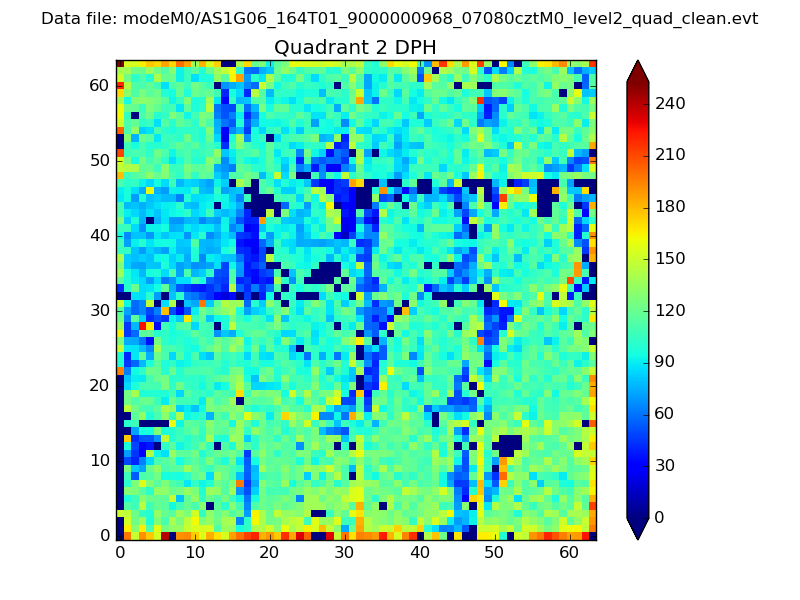
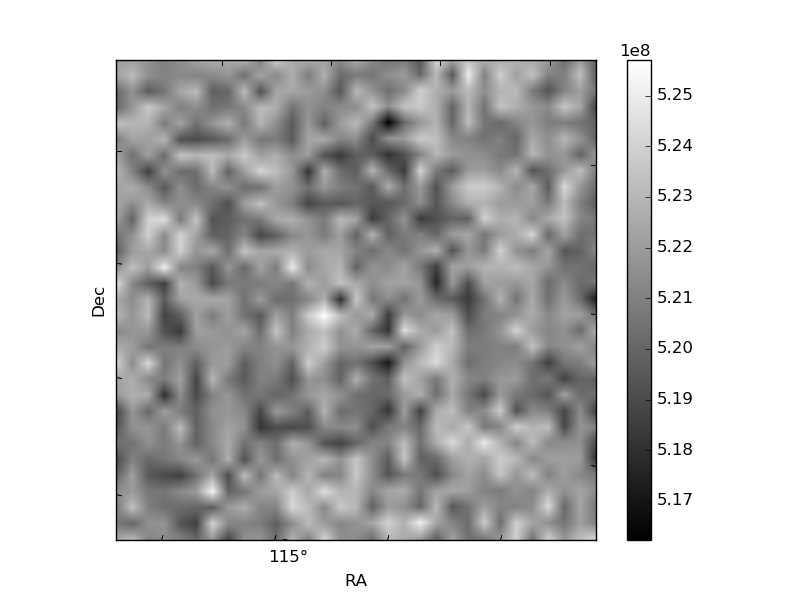
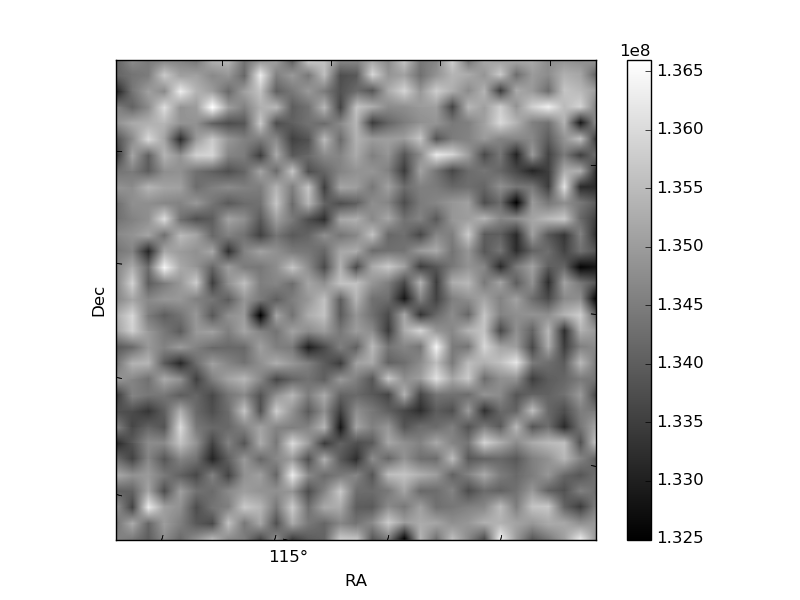
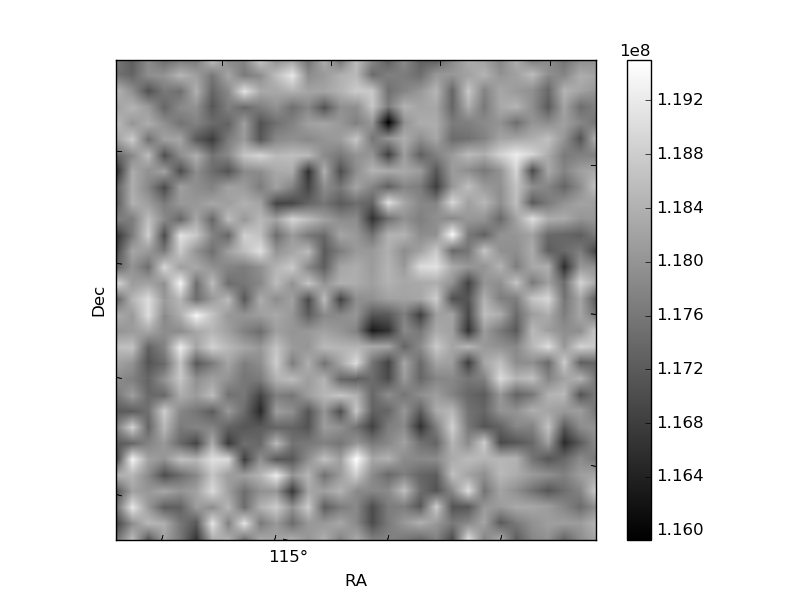
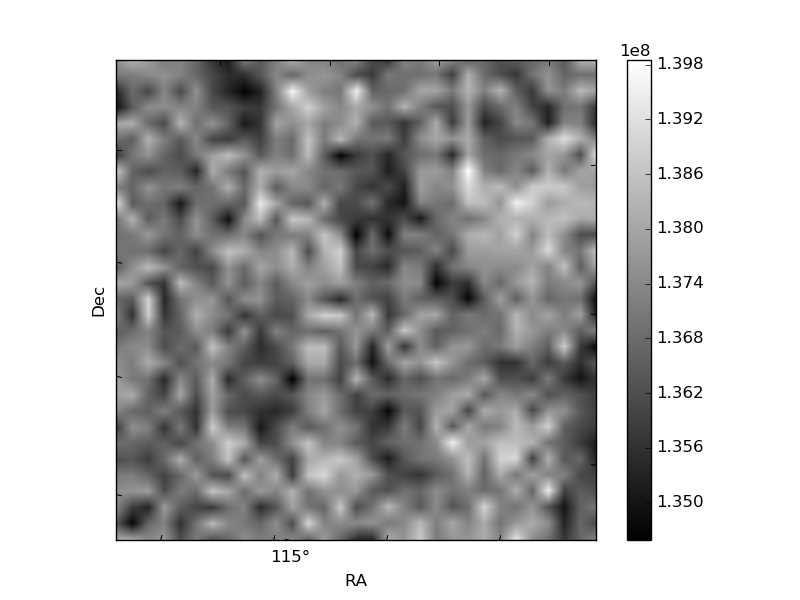
Histogram calculated using DETX and DETY for each event in the final _common_clean file
| Quadrant A | 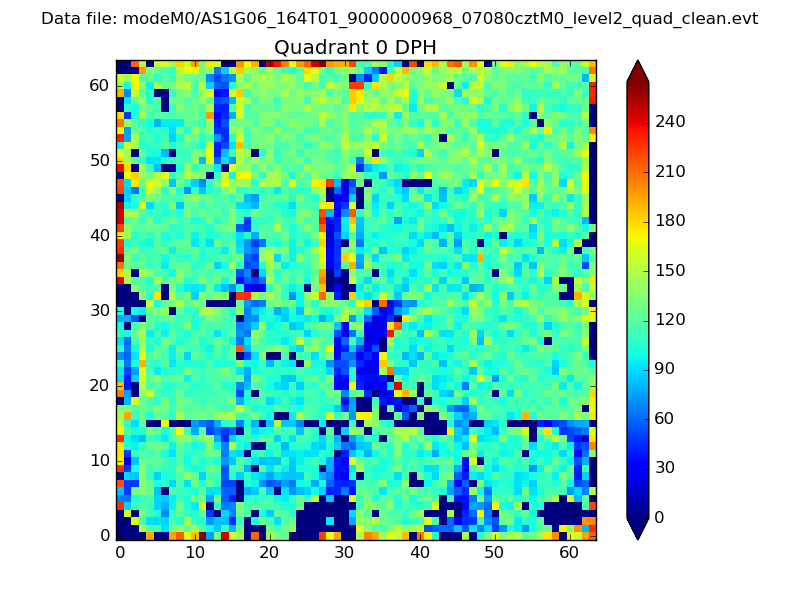 |
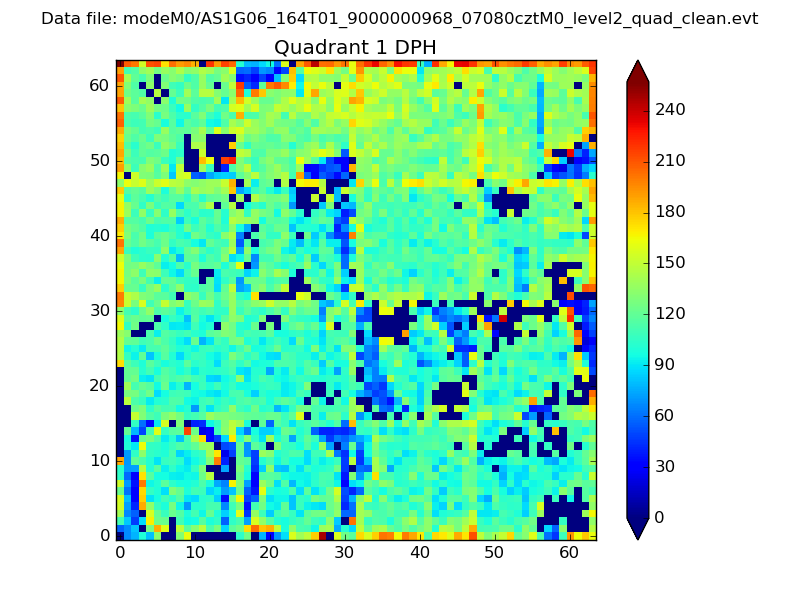 |
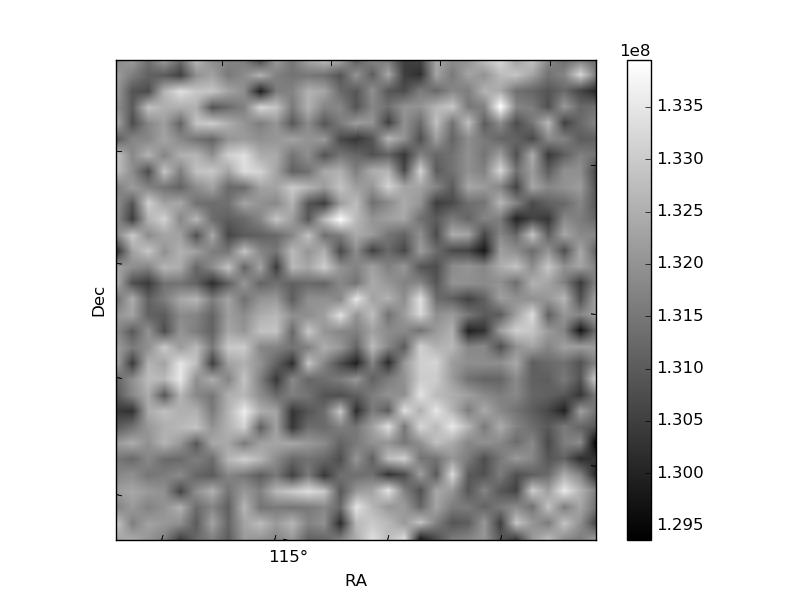
Quadrant B |
|---|---|---|---|
| Quadrant D | 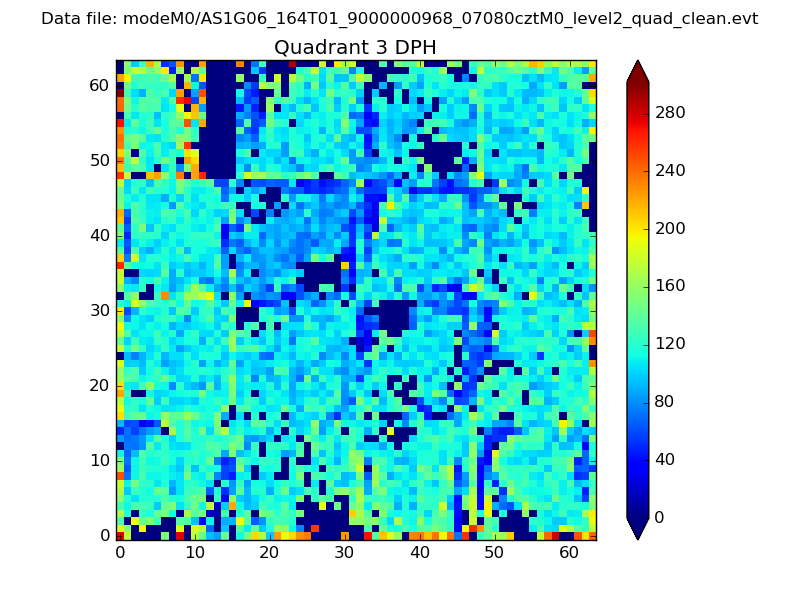 |
 |
Quadrant C |
| Plot type | Count rate plots | Images |
|---|---|---|
| Comparison with Poisson distribution Blue bars denote a histogram of data divided into 1 sec bins. Red curve is a Poisson curve with rate = median count rate of data. |
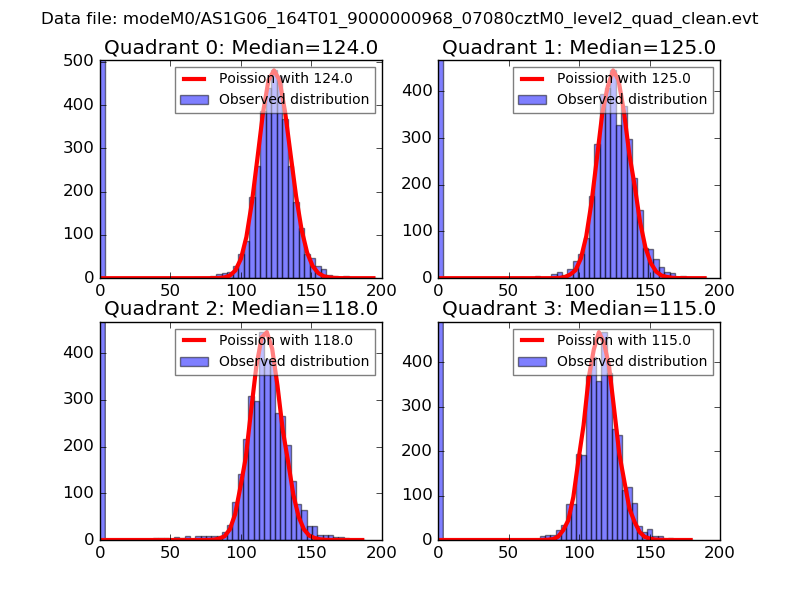 |
 |
| Quadrant-wise count rates Data is divided into 100 sec bins |
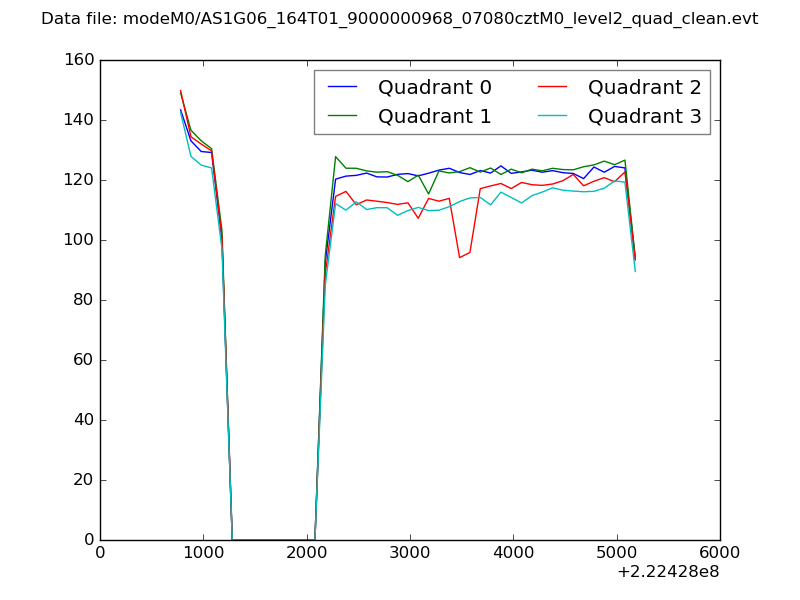 |
|
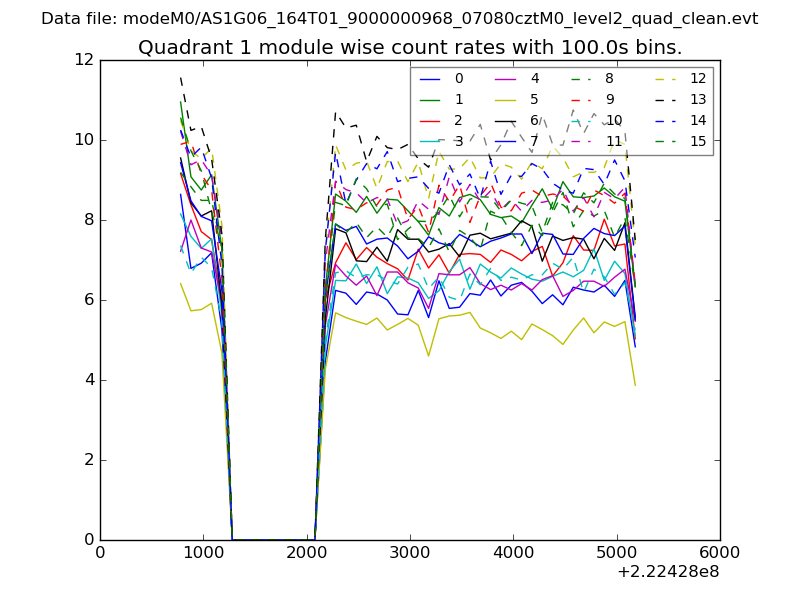
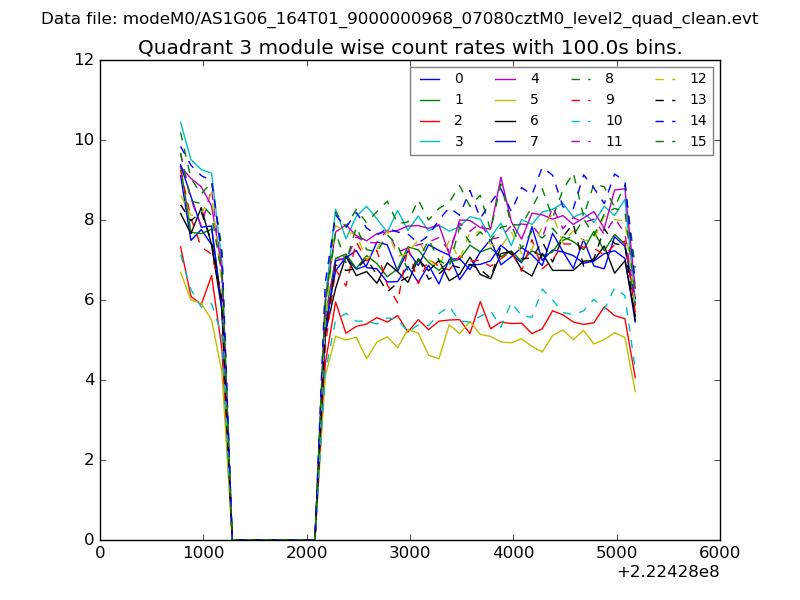
| Module-wise count rates for Quadrant A Data is divided into 100 sec bins |
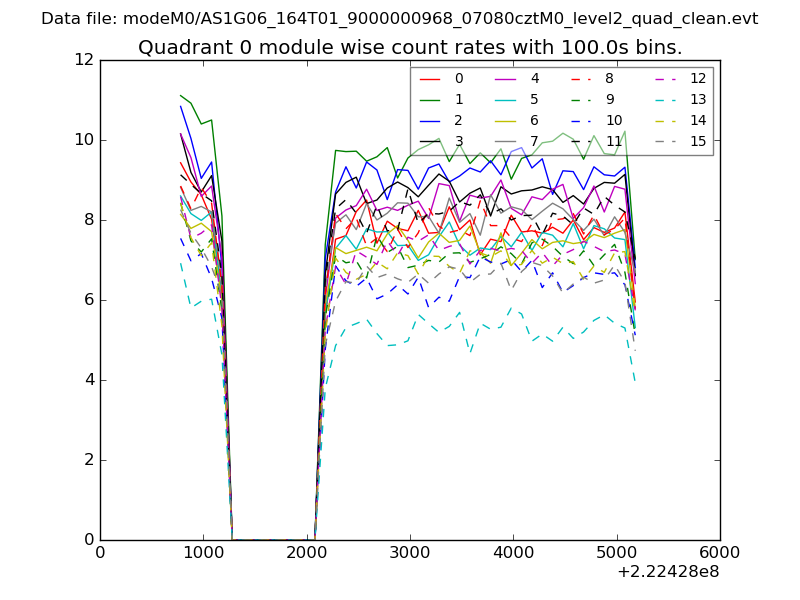 |
 |
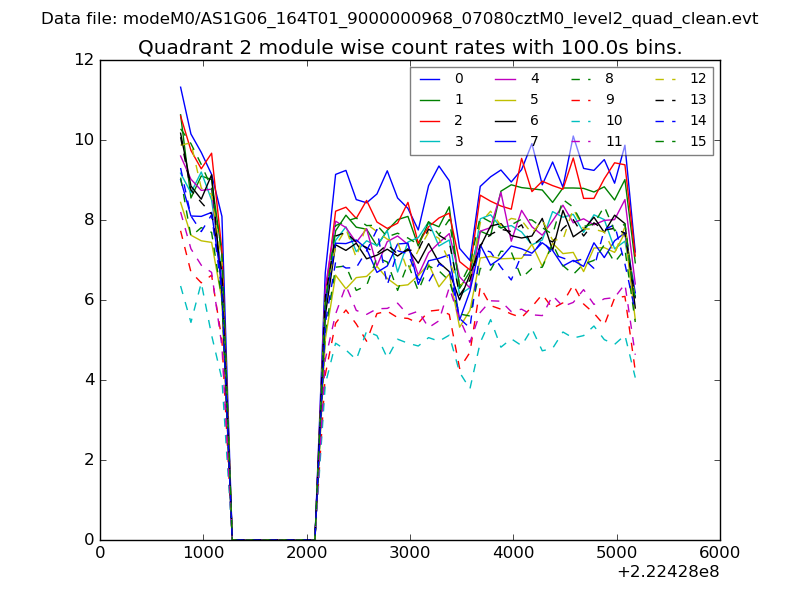
| Module-wise count rates for Quadrant B Data is divided into 100 sec bins |
 |
 |
| Module-wise count rates for Quadrant C Data is divided into 100 sec bins |
 |
 |
| Module-wise count rates for Quadrant D Data is divided into 100 sec bins |
 |
 |
| Parameter | Plot |
|---|---|
| CZT HV Monitor | 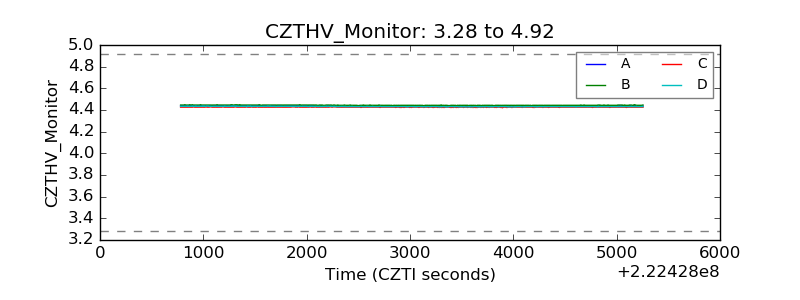 |
| D_VDD | 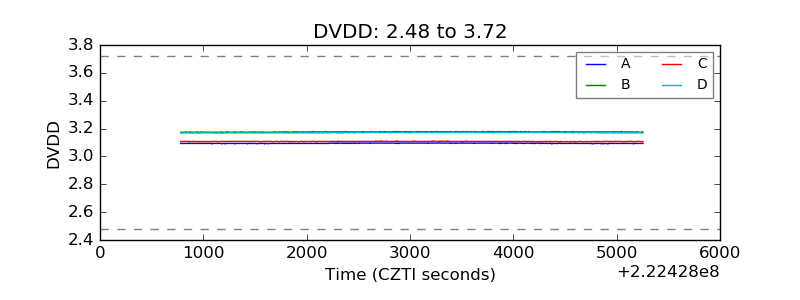 |
| Temperature 1 | 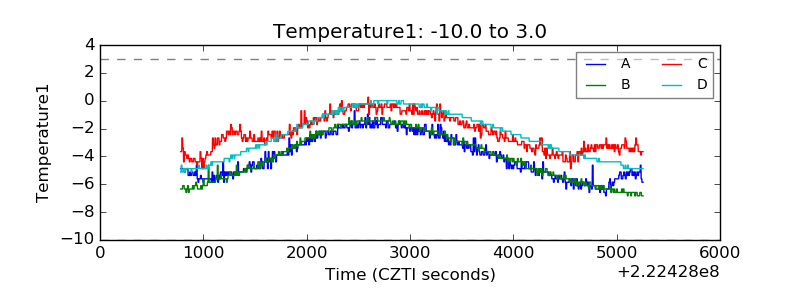 |
| Veto HV Monitor | 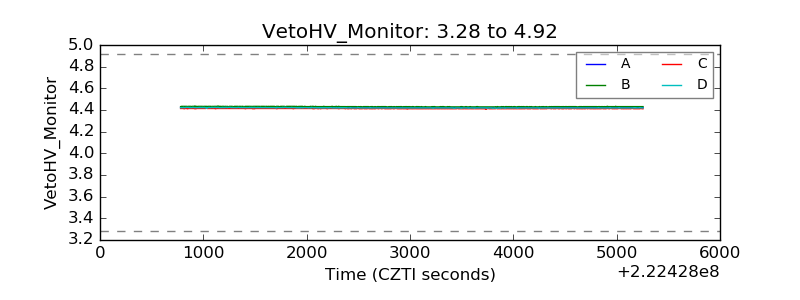 |
| Veto LLD | 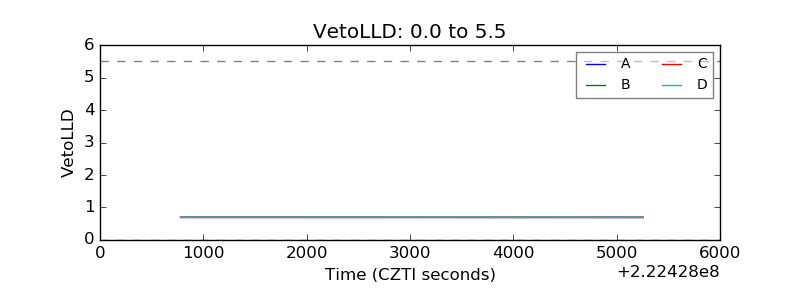 |
| Alpha Counter | 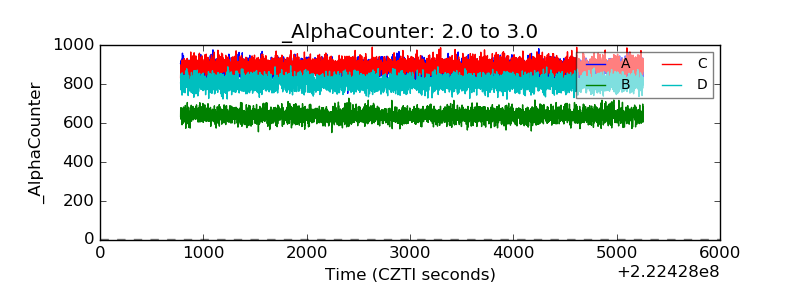 |
| _CPM_Rate | 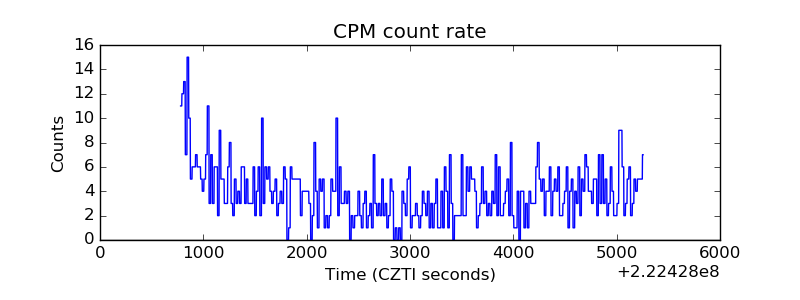 |
| CZT Counter | 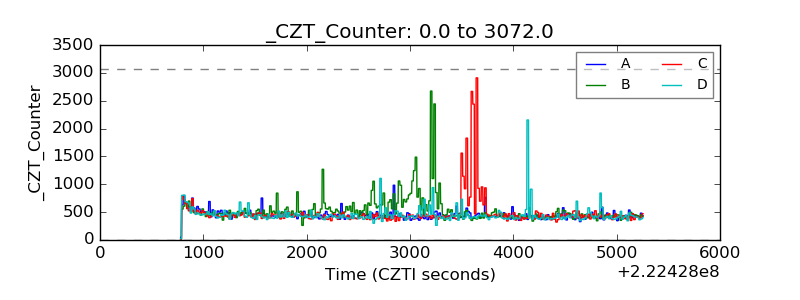 |
| +2.5 Volts monitor |  |
| +5 Volts monitor |  |
| _ROLL_ROT | 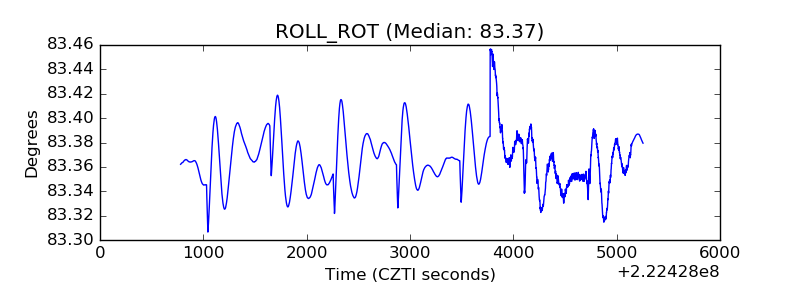 |
| _Roll_DEC | 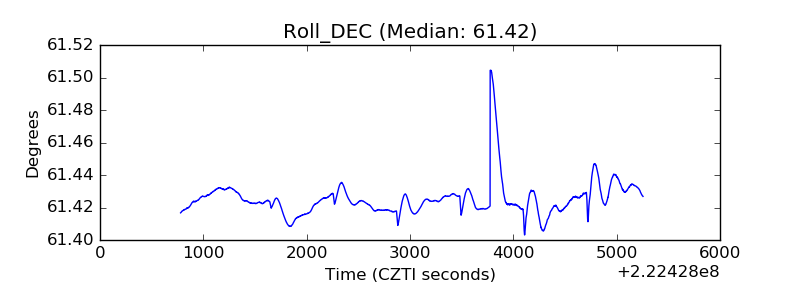 |
| _Roll_RA | 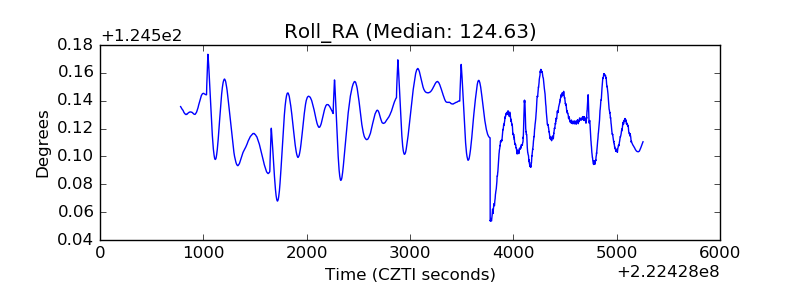 |
| Veto Counter | 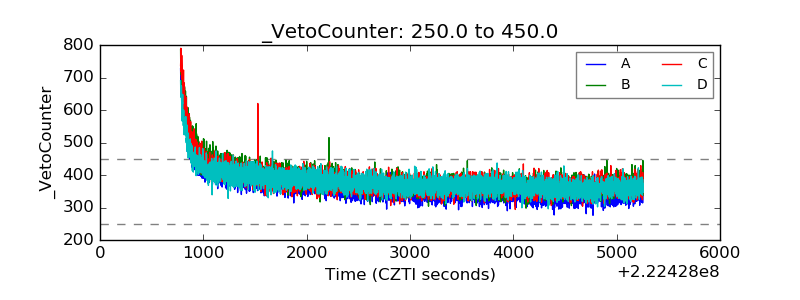 |