| Param | Original file | Final file |
|---|---|---|
| Filename | modeM0/AS1G06_164T01_9000000968_07081cztM0_level2.evt | modeM0/AS1G06_164T01_9000000968_07081cztM0_level2_quad_clean.evt |
| Size (bytes) | 337,976,640 | 77,912,640 |
| Size | 322.3 MB | 74.3 MB |
| Events in quadrant A | 2,307,280 | 513,697 |
| Events in quadrant B | 2,621,672 | 523,177 |
| Events in quadrant C | 2,221,109 | 496,811 |
| Events in quadrant D | 2,747,416 | 477,643 |
| Mode M9 | |||
|---|---|---|---|
| Quadrant | BADHDUFLAG | Total packets | Discarded packets |
| A | 0 | 13 | 0 |
| B | 0 | 13 | 0 |
| C | 0 | 13 | 0 |
| D | 0 | 13 | 0 |
| Mode SS | |||
|---|---|---|---|
| Quadrant | BADHDUFLAG | Total packets | Discarded packets |
| A | 0 | 102 | 0 |
| B | 0 | 102 | 0 |
| C | 0 | 102 | 0 |
| D | 0 | 102 | 0 |
| Mode M0 | |||
|---|---|---|---|
| Quadrant | BADHDUFLAG | Total packets | Discarded packets |
| A | 0 | 10088 | 2 |
| B | 0 | 10921 | 1 |
| C | 0 | 10087 | 1 |
| D | 0 | 11321 | 1 |
| Quadrant | Total seconds | Saturated seconds | Saturation percentage |
|---|---|---|---|
| A | 4961 | 23 | 0.463616% |
| B | 4961 | 49 | 0.987704% |
| C | 4961 | 15 | 0.302358% |
| D | 4961 | 49 | 0.987704% |
Noise dominated data is calculated using 1-second bins in cleaned event files. If a bin has >2000 counts, and if more than 50% of those come from <1% of pixels, then it is considered to be noise-dominated and hence unusable.
| Quadrant | # 1 sec bins | Bins with >0 counts | Bins with >2000 counts | High rate bins dominated by noise | Noise dominated (total time) | Noise dominated (detector-on time) | Marked lightcurve |
|---|---|---|---|---|---|---|---|
| A | 6260 | 4961 | 0 | 0 | 0.00% | 0.00% | 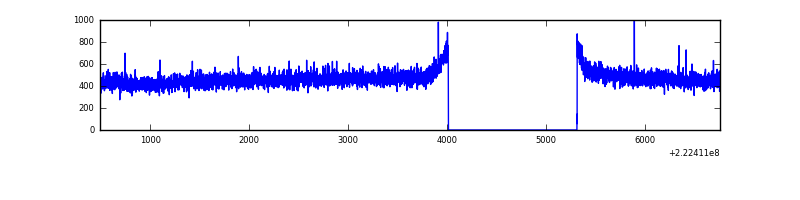 |
| B | 6260 | 4961 | 6 | 6 | 0.10% | 0.12% | 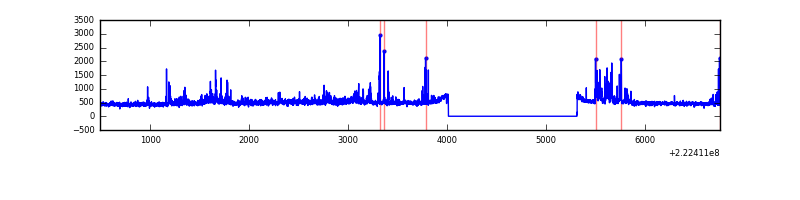 |
| C | 6260 | 4961 | 0 | 0 | 0.00% | 0.00% | 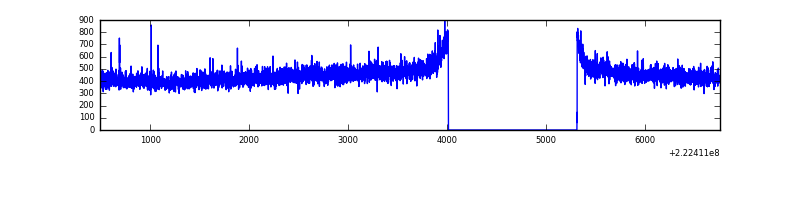 |
| D | 6260 | 4961 | 29 | 29 | 0.46% | 0.58% | 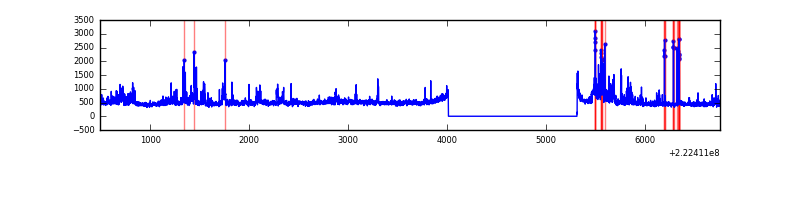 |
Top three noisy pixels from each quadrant. If the there are fewer than three noisy pixels in the level2.evt file, extra rows are filled as -1
| Pixel properties | Quadrant properties | ||||||
|---|---|---|---|---|---|---|---|
| Quadrant | DetID | PixID | Counts | Sigma | Mean | Median | Sigma |
| A | 8 | 15 | 8616 | 66.55 | 595 | 584 | 120.7 |
| A | 13 | 14 | 7326 | 55.86 | 595 | 584 | 120.7 |
| A | 0 | 226 | 5850 | 43.63 | 595 | 584 | 120.7 |
| B | 0 | 219 | 245209 | 2169.4 | 597 | 584 | 112.8 |
| B | 0 | 214 | 54816 | 480.94 | 597 | 584 | 112.8 |
| B | 12 | 111 | 10728 | 89.96 | 597 | 584 | 112.8 |
| C | 1 | 3 | 4569 | 30.75 | 567 | 568 | 130.1 |
| C | 13 | 61 | 4518 | 30.36 | 567 | 568 | 130.1 |
| C | 4 | 254 | 3442 | 22.09 | 567 | 568 | 130.1 |
| D | 1 | 83 | 311043 | 2244.2 | 566 | 547 | 138.4 |
| D | 8 | 195 | 147124 | 1059.43 | 566 | 547 | 138.4 |
| D | 2 | 136 | 61797 | 442.7 | 566 | 547 | 138.4 |
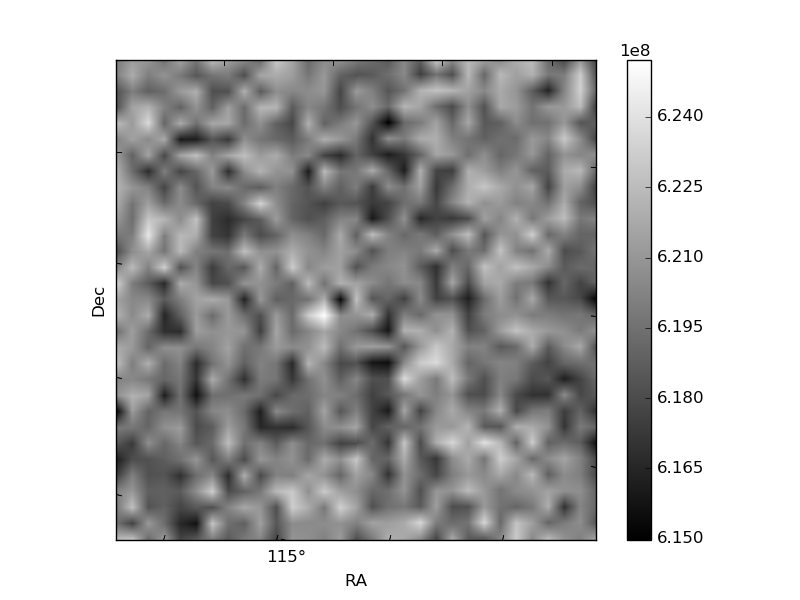
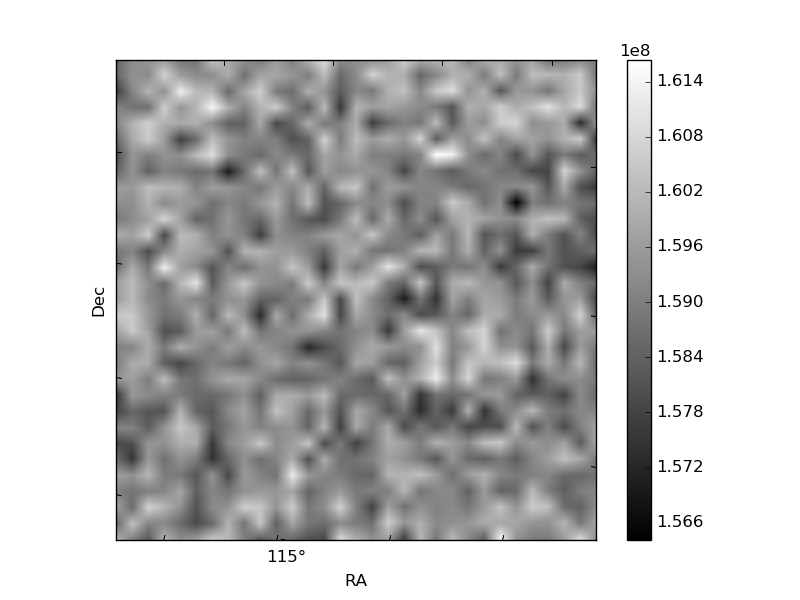
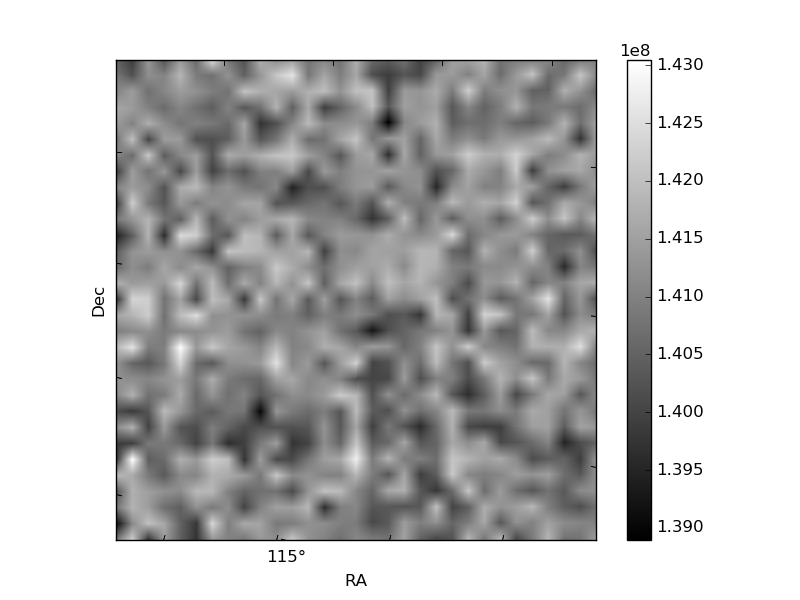
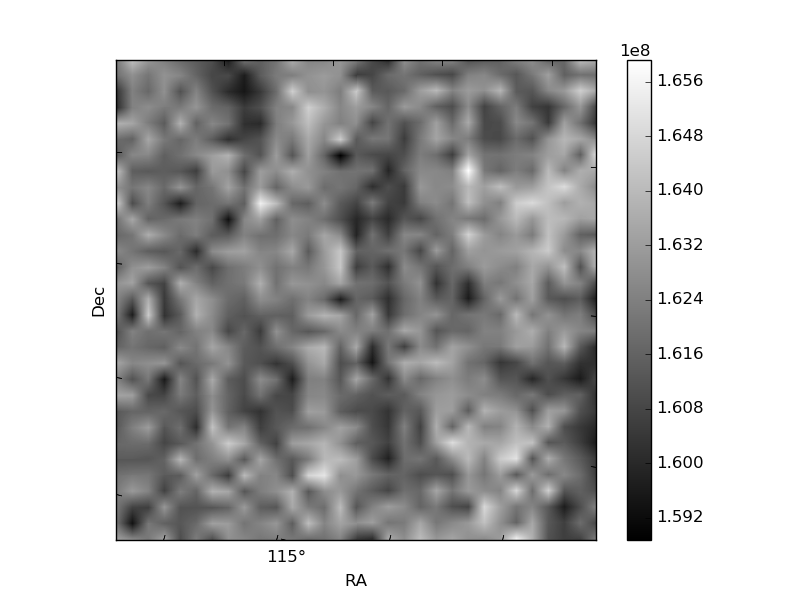
Histogram calculated using DETX and DETY for each event in the final _common_clean file
| Quadrant A | 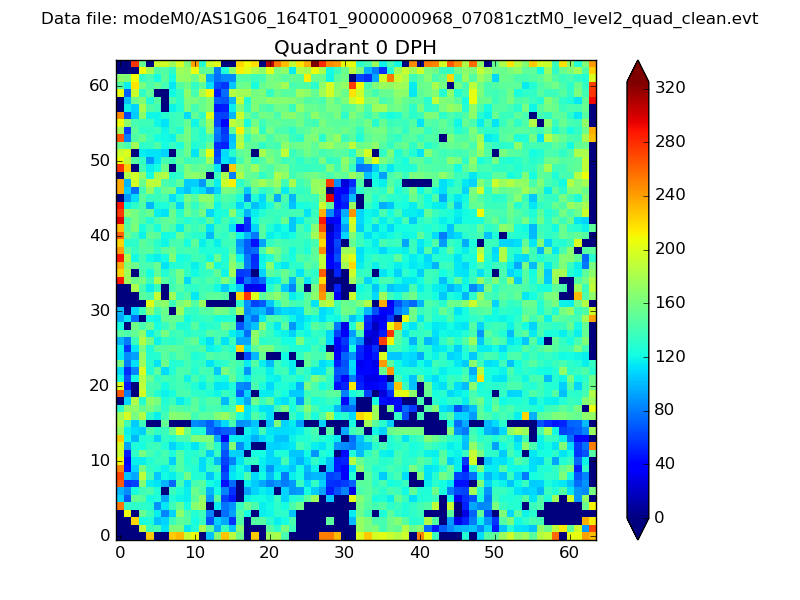 |
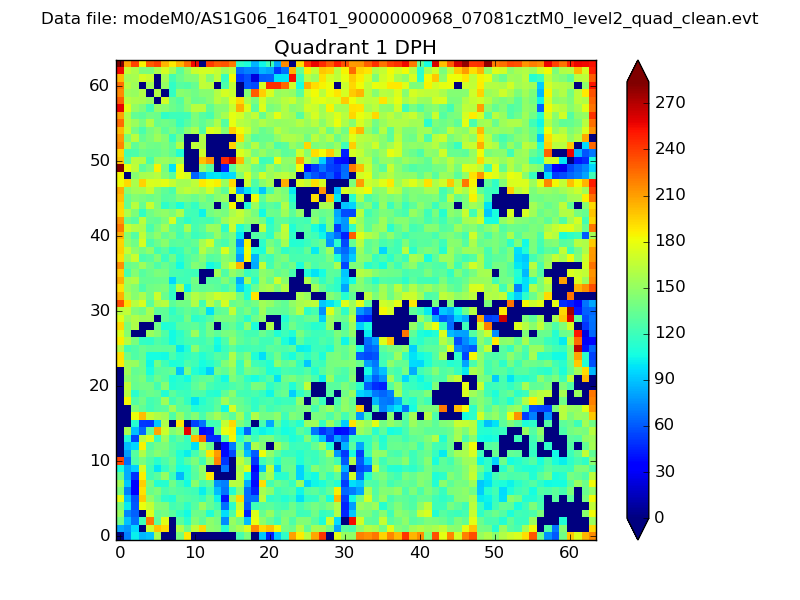 |
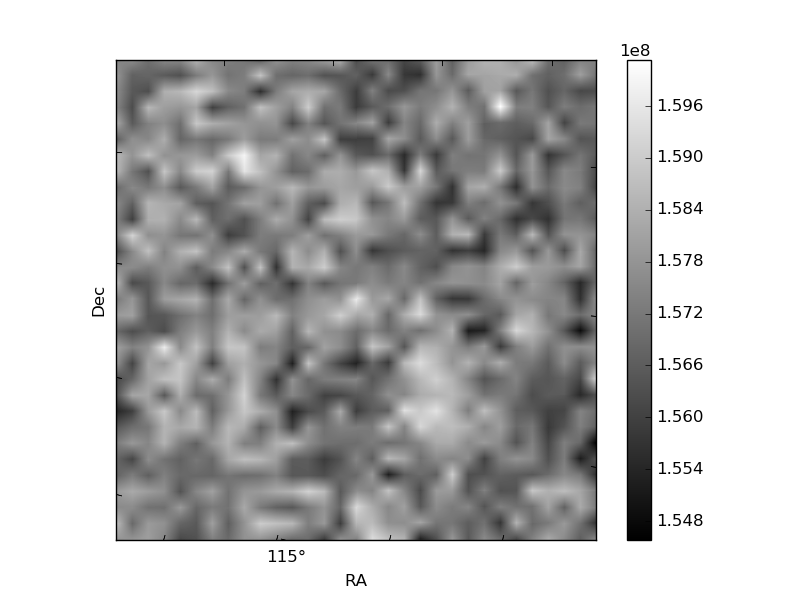
Quadrant B |
|---|---|---|---|
| Quadrant D | 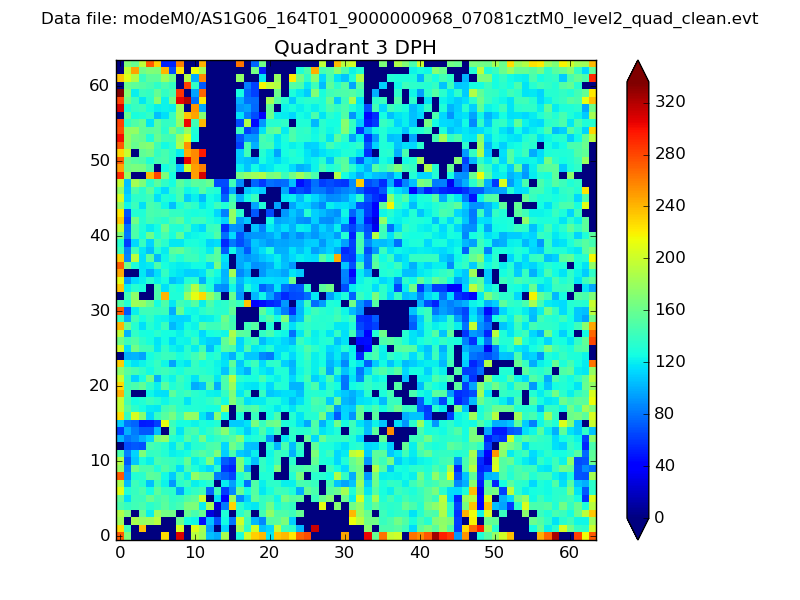 |
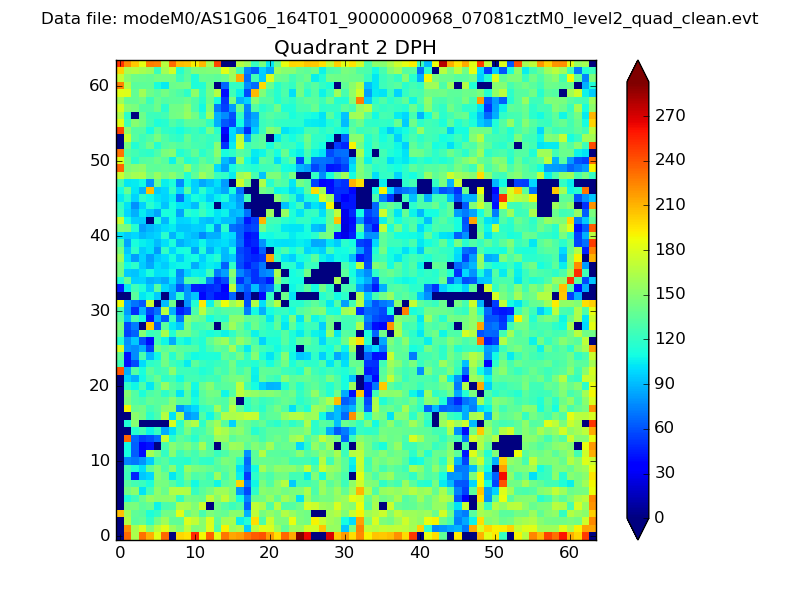 |
Quadrant C |
| Plot type | Count rate plots | Images |
|---|---|---|
| Comparison with Poisson distribution Blue bars denote a histogram of data divided into 1 sec bins. Red curve is a Poisson curve with rate = median count rate of data. |
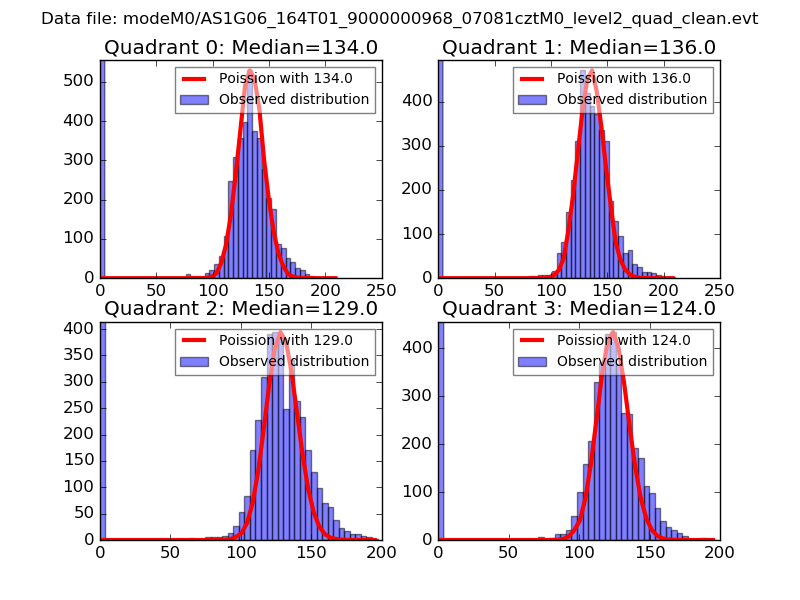 |
 |
| Quadrant-wise count rates Data is divided into 100 sec bins |
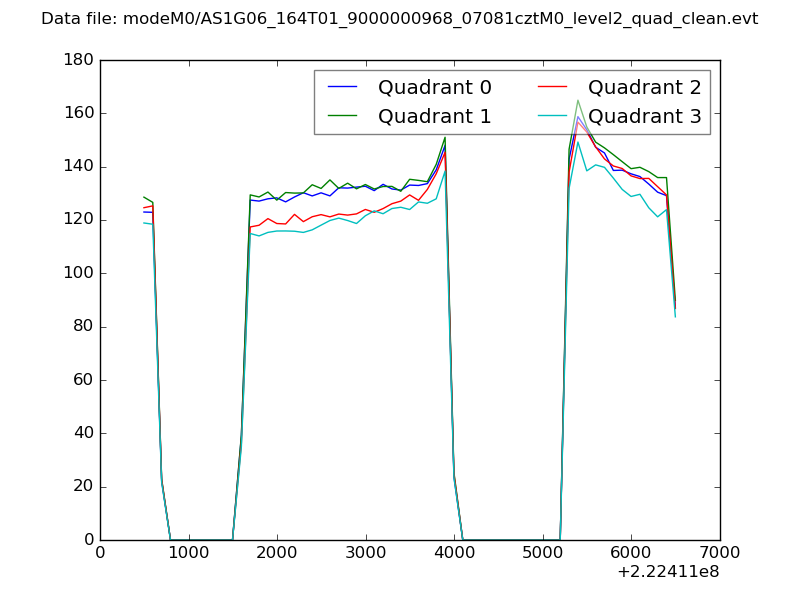 |
|
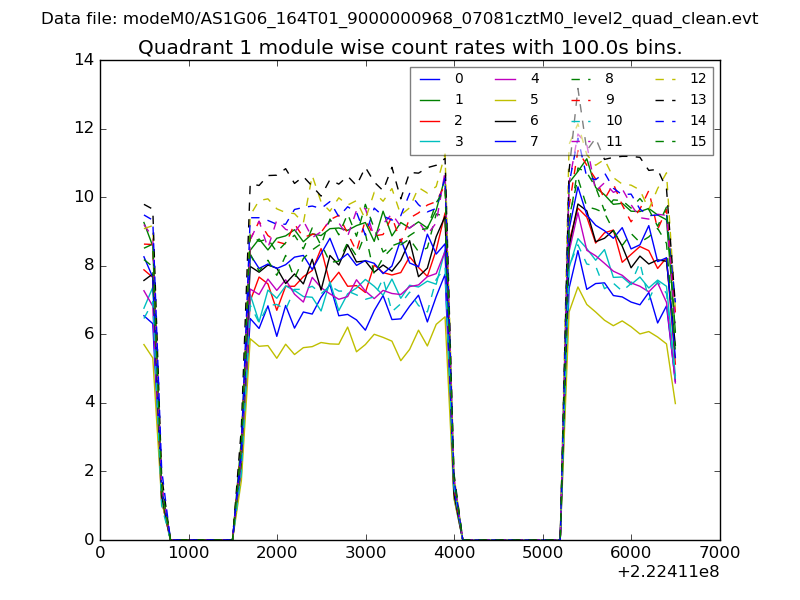
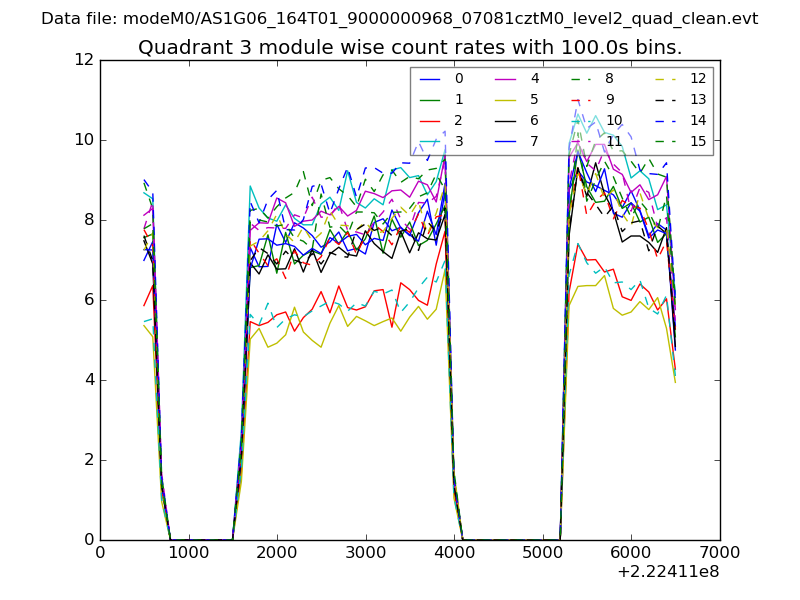
| Module-wise count rates for Quadrant A Data is divided into 100 sec bins |
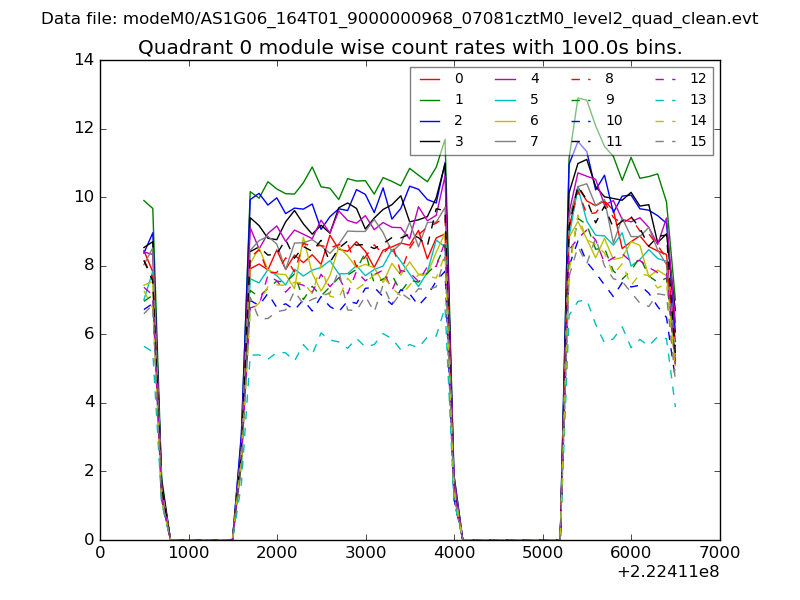 |
 |
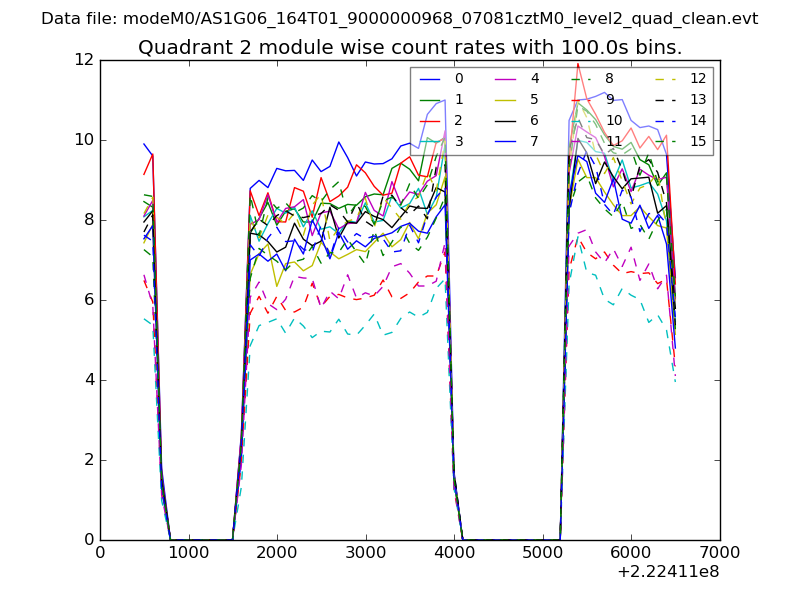
| Module-wise count rates for Quadrant B Data is divided into 100 sec bins |
 |
 |
| Module-wise count rates for Quadrant C Data is divided into 100 sec bins |
 |
 |
| Module-wise count rates for Quadrant D Data is divided into 100 sec bins |
 |
 |
| Parameter | Plot |
|---|---|
| CZT HV Monitor | 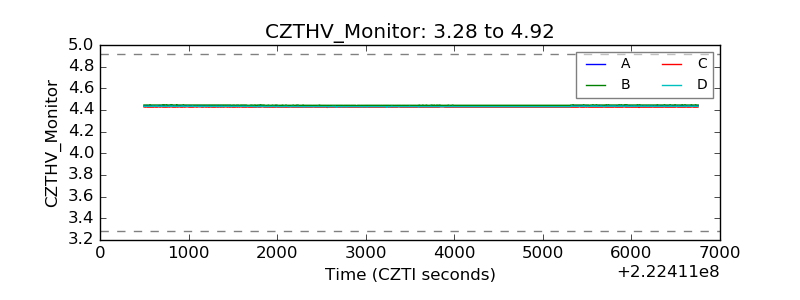 |
| D_VDD | 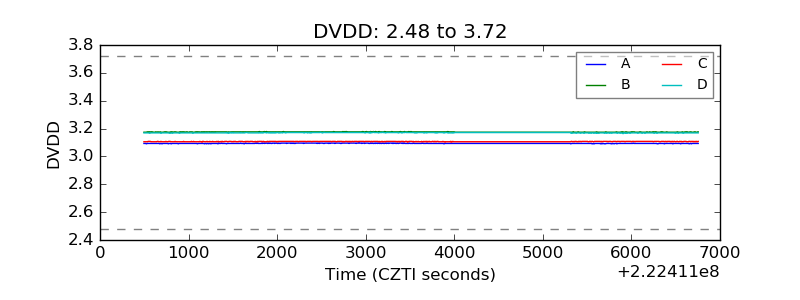 |
| Temperature 1 | 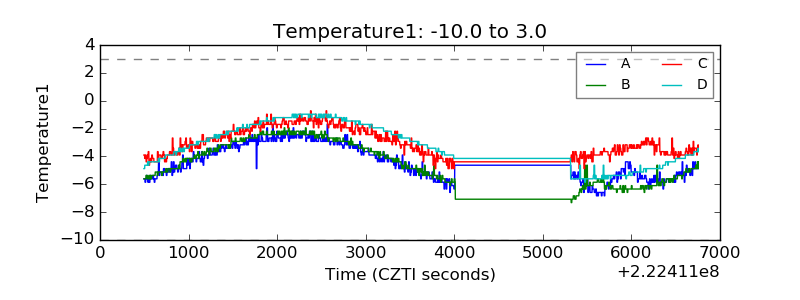 |
| Veto HV Monitor | 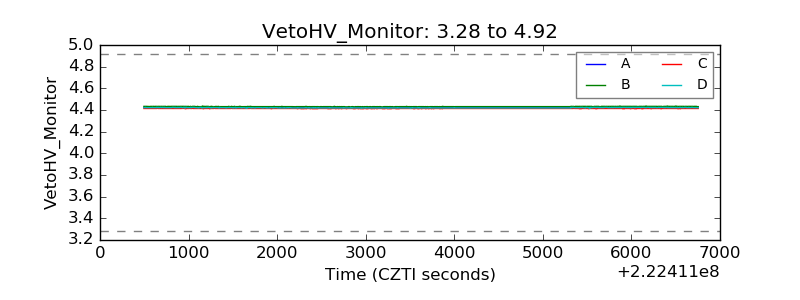 |
| Veto LLD | 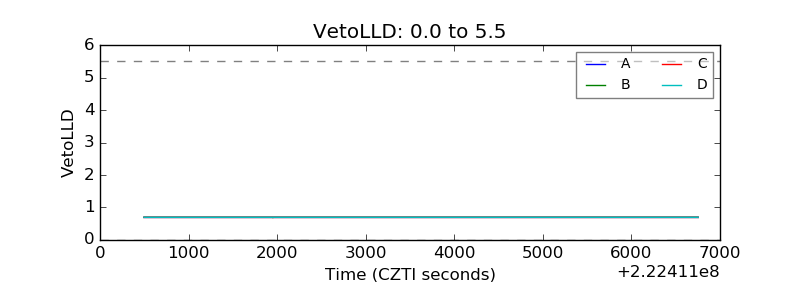 |
| Alpha Counter | 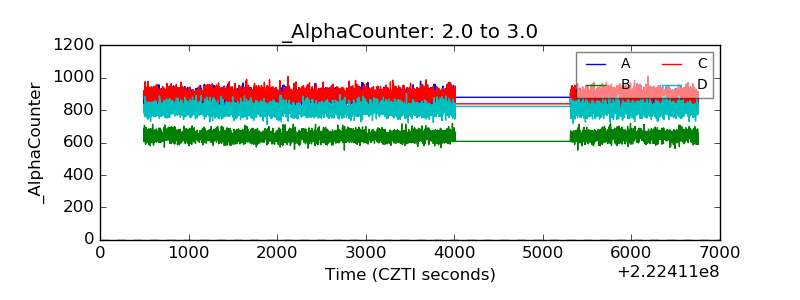 |
| _CPM_Rate | 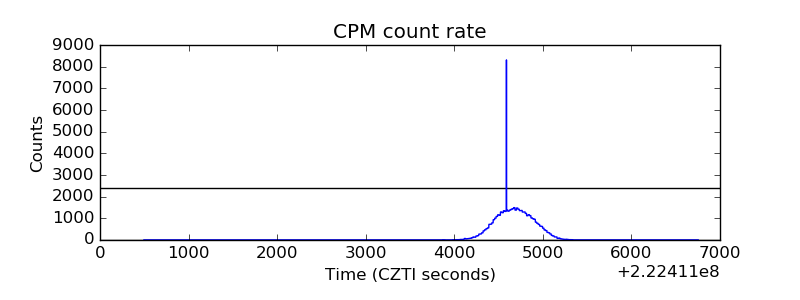 |
| CZT Counter | 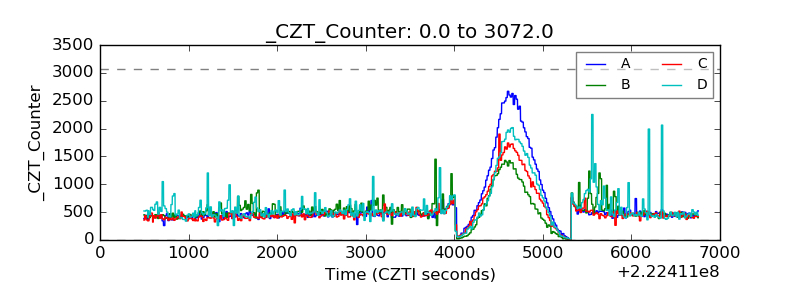 |
| +2.5 Volts monitor | 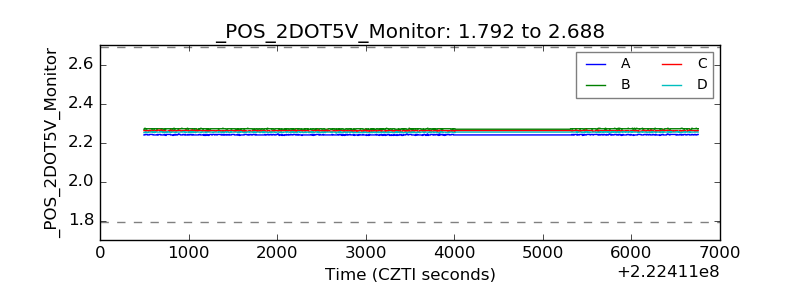 |
| +5 Volts monitor | 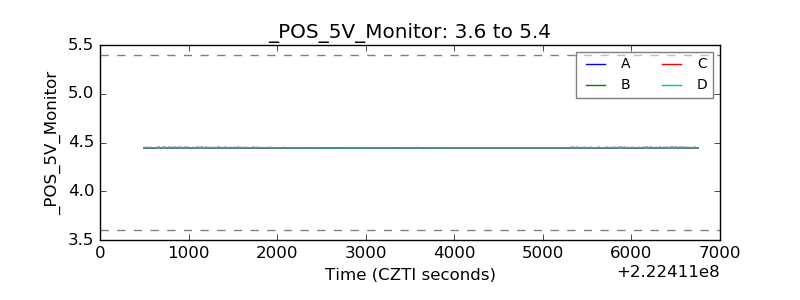 |
| _ROLL_ROT | 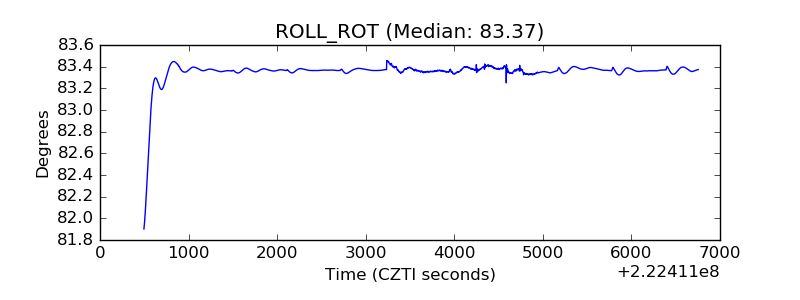 |
| _Roll_DEC | 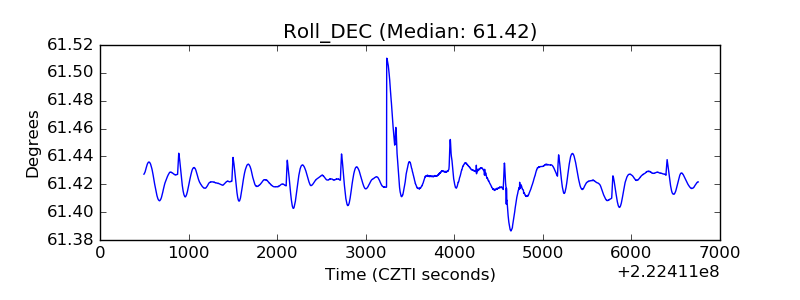 |
| _Roll_RA | 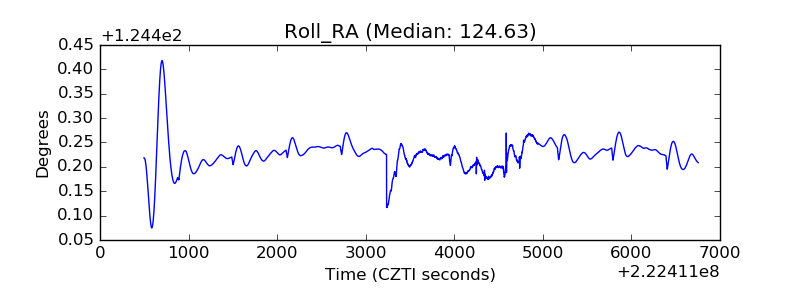 |
| Veto Counter | 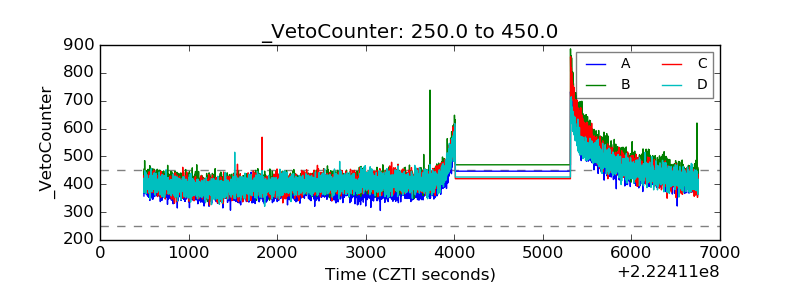 |