| Param | Original file | Final file |
|---|---|---|
| Filename | modeM0/AS1A02_090T01_9000000970cztM0_level2.fits | modeM0/AS1A02_090T01_9000000970cztM0_level2_quad_clean.evt |
| Size (bytes) | 1,963,356,480 | 1,986,318,720 |
| Size | 1.8 GB | 1.8 GB |
| Events in quadrant A | 11,858,488 | 11,983,444 |
| Events in quadrant B | 11,534,280 | 11,989,097 |
| Events in quadrant C | 11,679,496 | 11,477,010 |
| Events in quadrant D | 9,981,196 | 10,306,110 |
| Mode M0 | |||
|---|---|---|---|
| Quadrant | BADHDUFLAG | Total packets | Discarded packets |
| A | 0 | 436231 | 0 |
| B | 0 | 454586 | 0 |
| C | 0 | 436556 | 0 |
| D | 0 | 490964 | 0 |
| Mode M9 | |||
|---|---|---|---|
| Quadrant | BADHDUFLAG | Total packets | Discarded packets |
| A | 0 | 317 | 0 |
| B | 0 | 317 | 0 |
| C | 0 | 317 | 0 |
| D | 0 | 317 | 0 |
| Mode SS | |||
|---|---|---|---|
| Quadrant | BADHDUFLAG | Total packets | Discarded packets |
| A | 0 | 4286 | 0 |
| B | 0 | 4286 | 0 |
| C | 0 | 4286 | 0 |
| D | 0 | 4286 | 0 |
| Quadrant | Total seconds | Saturated seconds | Saturation percentage |
|---|---|---|---|
| A | 210292 | 3236 | 1.538813% |
| B | 210292 | 3877 | 1.843627% |
| C | 210292 | 2108 | 1.002416% |
| D | 210292 | 5031 | 2.392388% |
Noise dominated data is calculated using 1-second bins in cleaned event files. If a bin has >2000 counts, and if more than 50% of those come from <1% of pixels, then it is considered to be noise-dominated and hence unusable.
| Quadrant | # 1 sec bins | Bins with >0 counts | Bins with >2000 counts | High rate bins dominated by noise | Noise dominated (total time) | Noise dominated (detector-on time) | Marked lightcurve |
|---|---|---|---|---|---|---|---|
| A | 242028 | 210264 | 0 | 0 | 0.00% | 0.00% |  |
| B | 242028 | 210259 | 0 | 0 | 0.00% | 0.00% |  |
| C | 242028 | 210268 | 0 | 0 | 0.00% | 0.00% |  |
| D | 242028 | 210217 | 0 | 0 | 0.00% | 0.00% | 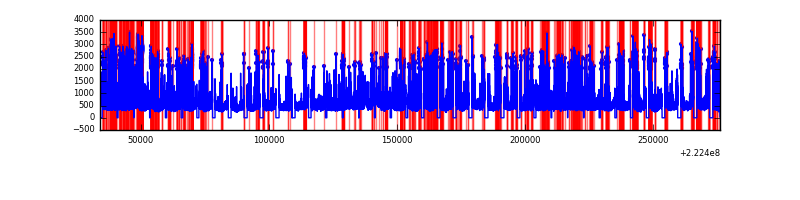 |
Top three noisy pixels from each quadrant. If the there are fewer than three noisy pixels in the level2.evt file, extra rows are filled as -1
| Pixel properties | Quadrant properties | ||||||
|---|---|---|---|---|---|---|---|
| Quadrant | DetID | PixID | Counts | Sigma | Mean | Median | Sigma |
| A | 14 | 188 | 12404 | 12.27 | 3076 | 2870 | 776.8 |
| A | 0 | 29 | 11708 | 11.38 | 3076 | 2870 | 776.8 |
| A | 14 | 204 | 10475 | 9.79 | 3076 | 2870 | 776.8 |
| B | 2 | 9 | 9884 | 11.51 | 3038 | 2884 | 608.3 |
| B | 12 | 226 | 7928 | 8.29 | 3038 | 2884 | 608.3 |
| B | 14 | 254 | 7916 | 8.27 | 3038 | 2884 | 608.3 |
| C | 1 | 81 | 9282 | 7.83 | 3083 | 2854 | 820.9 |
| C | 1 | 80 | 9083 | 7.59 | 3083 | 2854 | 820.9 |
| C | 12 | 241 | 8304 | 6.64 | 3083 | 2854 | 820.9 |
| D | 6 | 231 | 7253 | 6.1 | 2846 | 2571 | 767.9 |
| D | 11 | 82 | 7250 | 6.09 | 2846 | 2571 | 767.9 |
| D | 15 | 47 | 7181 | 6.0 | 2846 | 2571 | 767.9 |
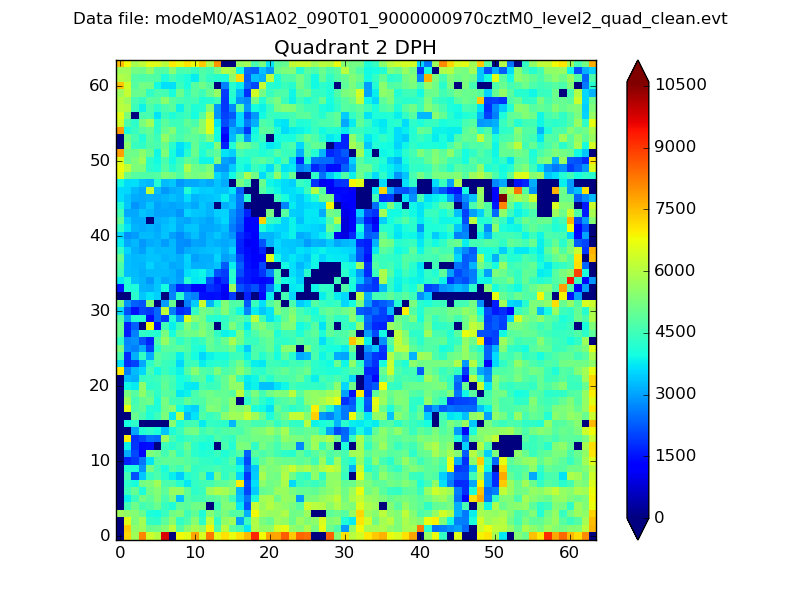
Histogram calculated using DETX and DETY for each event in the final _common_clean file
| Quadrant A | 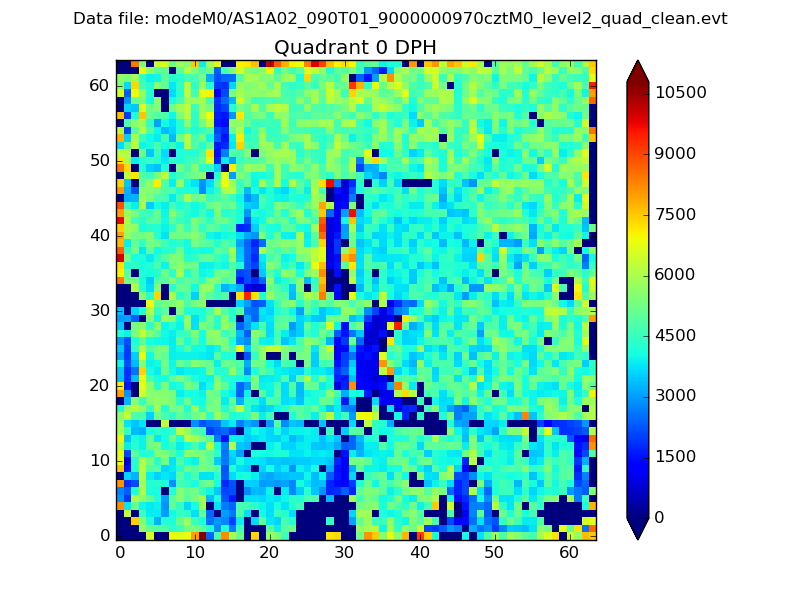 |
 |
Quadrant B |
|---|---|---|---|
| Quadrant D | 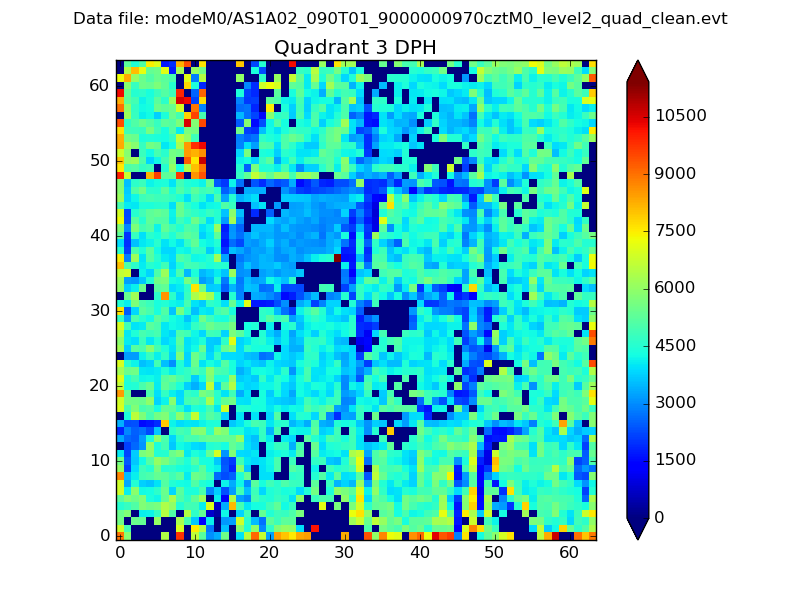 |
 |
Quadrant C |
| Plot type | Count rate plots | Images |
|---|---|---|
| Comparison with Poisson distribution Blue bars denote a histogram of data divided into 1 sec bins. Red curve is a Poisson curve with rate = median count rate of data. |
 |
 |
| Quadrant-wise count rates Data is divided into 100 sec bins |
 |
|
| Module-wise count rates for Quadrant A Data is divided into 100 sec bins |
 |
 |
| Module-wise count rates for Quadrant B Data is divided into 100 sec bins |
 |
 |
| Module-wise count rates for Quadrant C Data is divided into 100 sec bins |
 |
 |
| Module-wise count rates for Quadrant D Data is divided into 100 sec bins |
 |
 |
| Parameter | Plot |
|---|---|
| CZT HV Monitor |  |
| D_VDD | 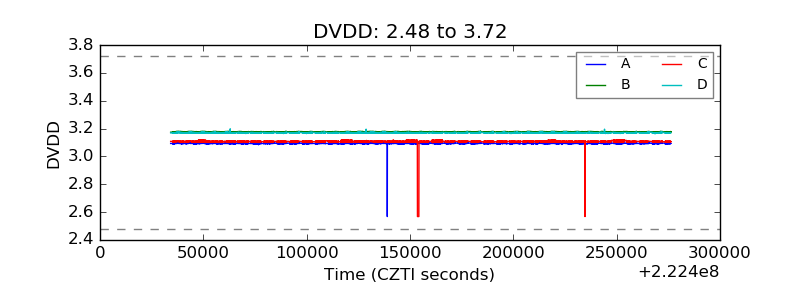 |
| Temperature 1 |  |
| Veto HV Monitor |  |
| Veto LLD |  |
| Alpha Counter |  |
| _CPM_Rate |  |
| CZT Counter |  |
| +2.5 Volts monitor |  |
| +5 Volts monitor |  |
| _ROLL_ROT |  |
| _Roll_DEC |  |
| _Roll_RA |  |
| Veto Counter |  |