| Param | Original file | Final file |
|---|---|---|
| Filename | modeM0/AS1A02_090T01_9000000970_07081cztM0_level2.evt | modeM0/AS1A02_090T01_9000000970_07081cztM0_level2_quad_clean.evt |
| Size (bytes) | 526,098,240 | 95,307,840 |
| Size | 501.7 MB | 90.9 MB |
| Events in quadrant A | 4,024,932 | 595,896 |
| Events in quadrant B | 3,780,126 | 609,690 |
| Events in quadrant C | 3,392,567 | 606,804 |
| Events in quadrant D | 4,241,590 | 567,783 |
| Mode M0 | |||
|---|---|---|---|
| Quadrant | BADHDUFLAG | Total packets | Discarded packets |
| A | 0 | 16558 | 3 |
| B | 0 | 15734 | 2 |
| C | 0 | 14955 | 2 |
| D | 0 | 17584 | 2 |
| Mode M9 | |||
|---|---|---|---|
| Quadrant | BADHDUFLAG | Total packets | Discarded packets |
| A | 0 | 13 | 0 |
| B | 0 | 13 | 0 |
| C | 0 | 13 | 0 |
| D | 0 | 13 | 0 |
| Mode SS | |||
|---|---|---|---|
| Quadrant | BADHDUFLAG | Total packets | Discarded packets |
| A | 0 | 146 | 0 |
| B | 0 | 146 | 0 |
| C | 0 | 146 | 0 |
| D | 0 | 146 | 0 |
| Quadrant | Total seconds | Saturated seconds | Saturation percentage |
|---|---|---|---|
| A | 7275 | 278 | 3.821306% |
| B | 7275 | 179 | 2.460481% |
| C | 7275 | 76 | 1.044674% |
| D | 7275 | 255 | 3.505155% |
Noise dominated data is calculated using 1-second bins in cleaned event files. If a bin has >2000 counts, and if more than 50% of those come from <1% of pixels, then it is considered to be noise-dominated and hence unusable.
| Quadrant | # 1 sec bins | Bins with >0 counts | Bins with >2000 counts | High rate bins dominated by noise | Noise dominated (total time) | Noise dominated (detector-on time) | Marked lightcurve |
|---|---|---|---|---|---|---|---|
| A | 7715 | 7276 | 126 | 126 | 1.63% | 1.73% | 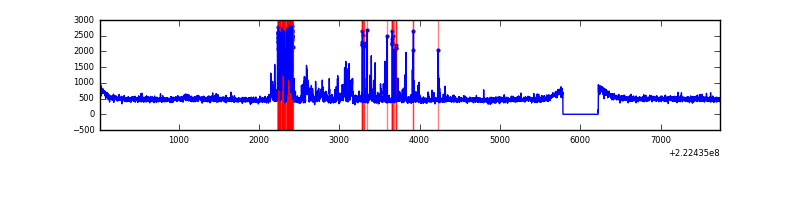 |
| B | 7715 | 7276 | 5 | 5 | 0.06% | 0.07% | 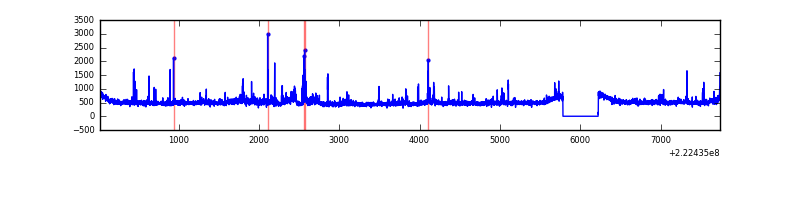 |
| C | 7715 | 7276 | 0 | 0 | 0.00% | 0.00% | 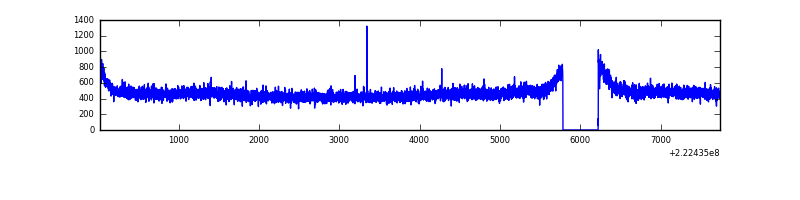 |
| D | 7715 | 7276 | 158 | 158 | 2.05% | 2.17% | 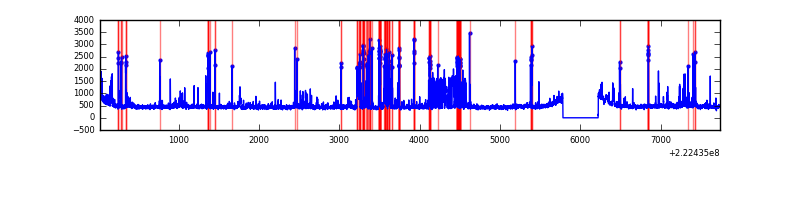 |
Top three noisy pixels from each quadrant. If the there are fewer than three noisy pixels in the level2.evt file, extra rows are filled as -1
| Pixel properties | Quadrant properties | ||||||
|---|---|---|---|---|---|---|---|
| Quadrant | DetID | PixID | Counts | Sigma | Mean | Median | Sigma |
| A | 8 | 15 | 593810 | 3235.39 | 889 | 870 | 183.3 |
| A | 0 | 226 | 8577 | 42.05 | 889 | 870 | 183.3 |
| A | 12 | 194 | 8090 | 39.4 | 889 | 870 | 183.3 |
| B | 0 | 219 | 161315 | 933.26 | 896 | 874 | 171.9 |
| B | 0 | 214 | 86743 | 499.49 | 896 | 874 | 171.9 |
| B | 4 | 48 | 49877 | 285.04 | 896 | 874 | 171.9 |
| C | 13 | 61 | 6844 | 29.46 | 867 | 874 | 202.7 |
| C | 1 | 3 | 3342 | 12.18 | 867 | 874 | 202.7 |
| C | 9 | 68 | 3112 | 11.04 | 867 | 874 | 202.7 |
| D | 1 | 20 | 330972 | 1543.2 | 862 | 836 | 213.9 |
| D | 13 | 169 | 197845 | 920.9 | 862 | 836 | 213.9 |
| D | 14 | 34 | 181448 | 844.26 | 862 | 836 | 213.9 |
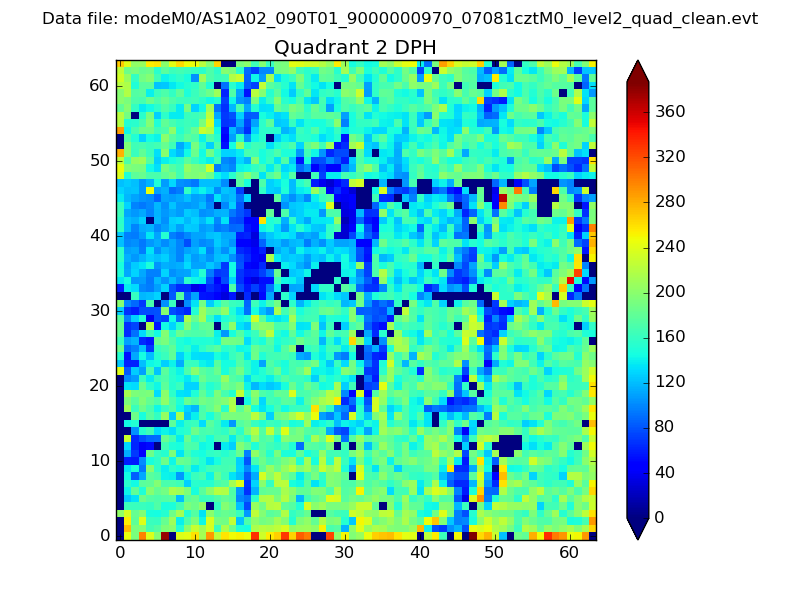
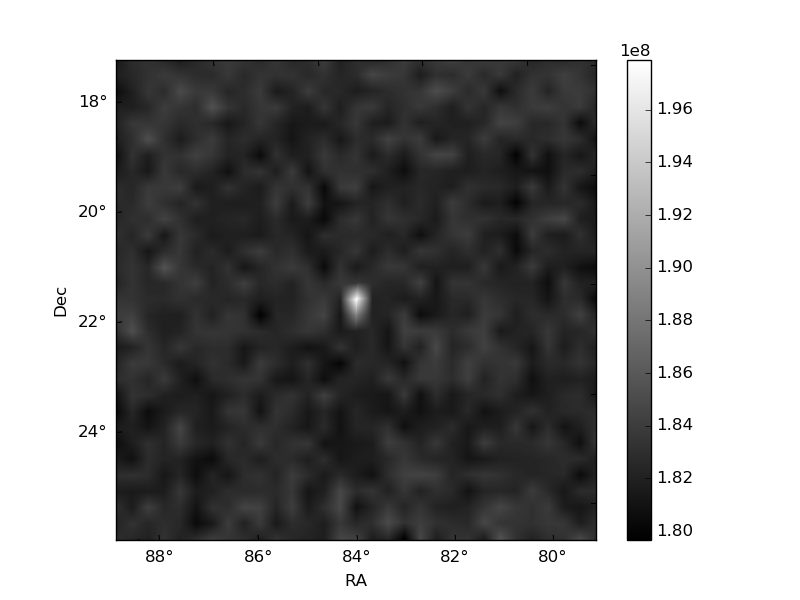
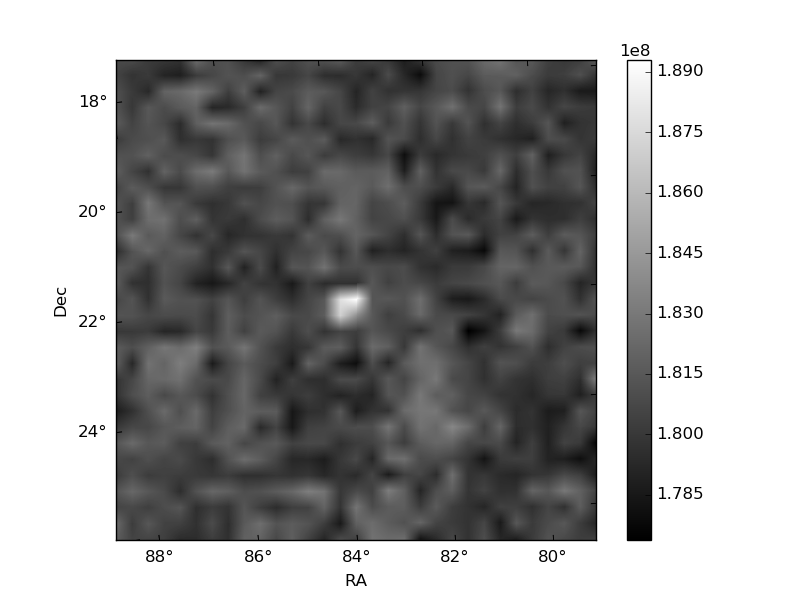
Histogram calculated using DETX and DETY for each event in the final _common_clean file
| Quadrant A | 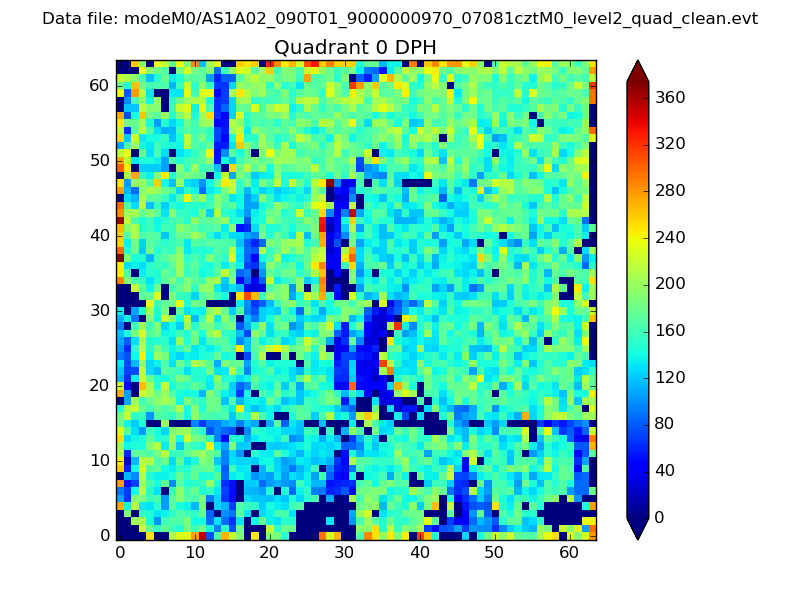 |
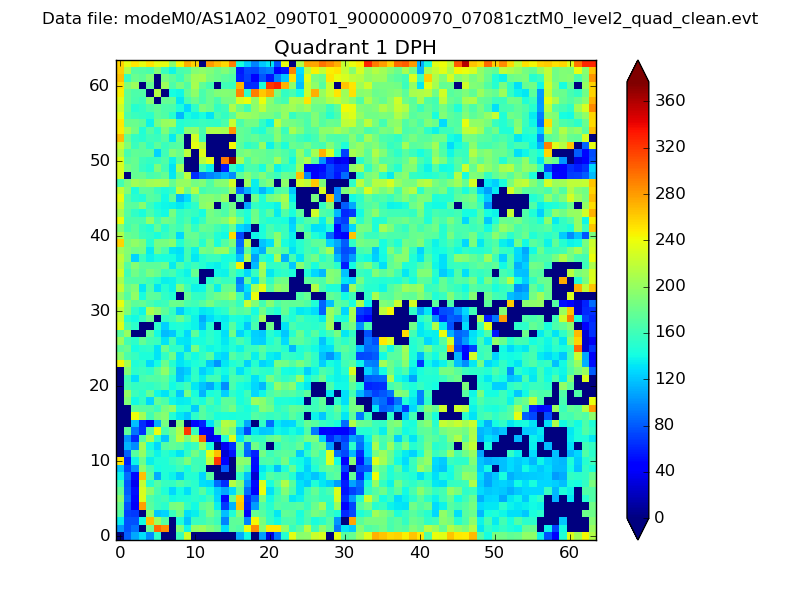 |
Quadrant B |
|---|---|---|---|
| Quadrant D | 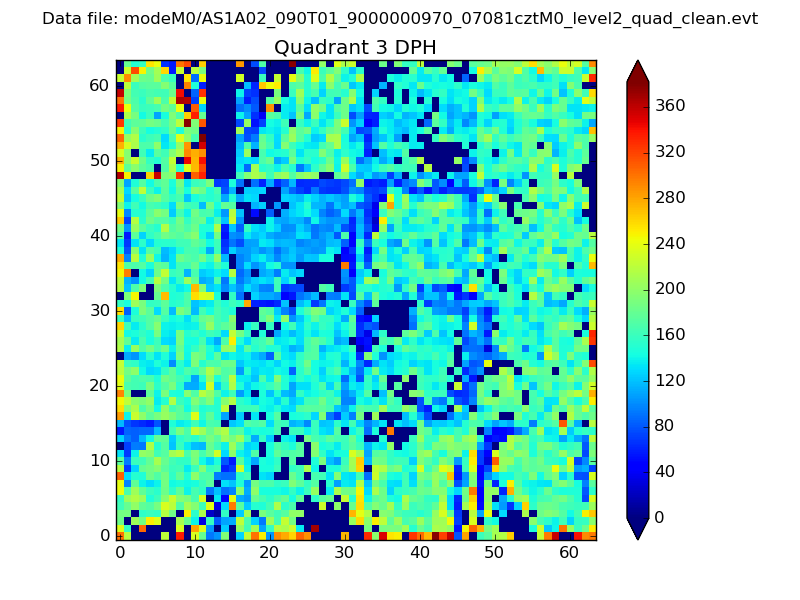 |
 |
Quadrant C |
| Plot type | Count rate plots | Images |
|---|---|---|
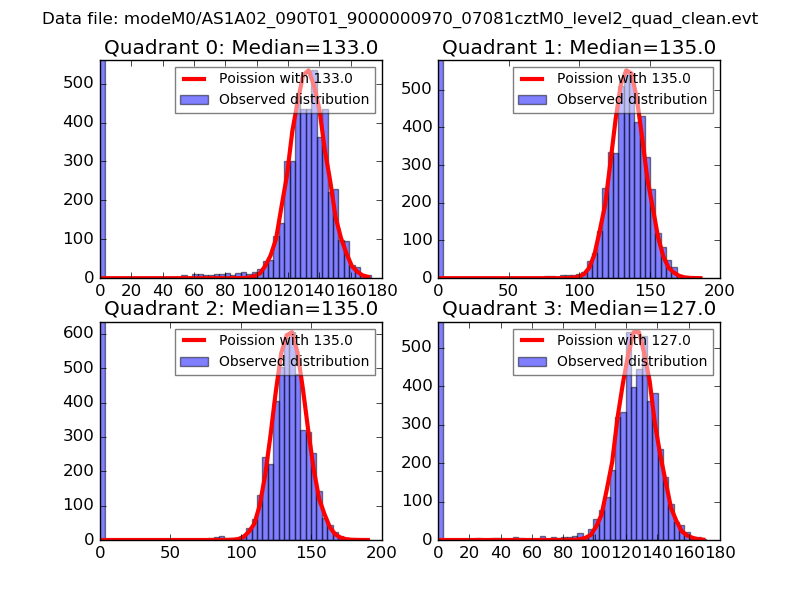
| Comparison with Poisson distribution Blue bars denote a histogram of data divided into 1 sec bins. Red curve is a Poisson curve with rate = median count rate of data. |
 |
 |
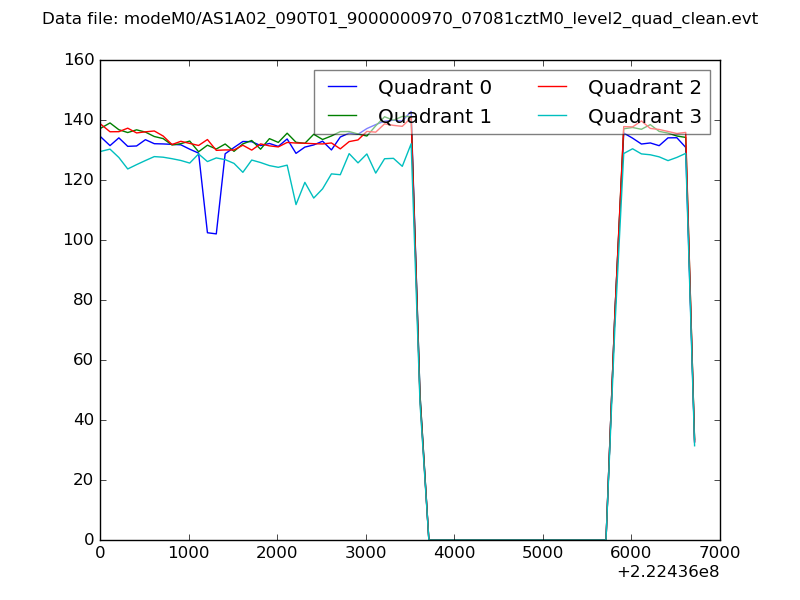
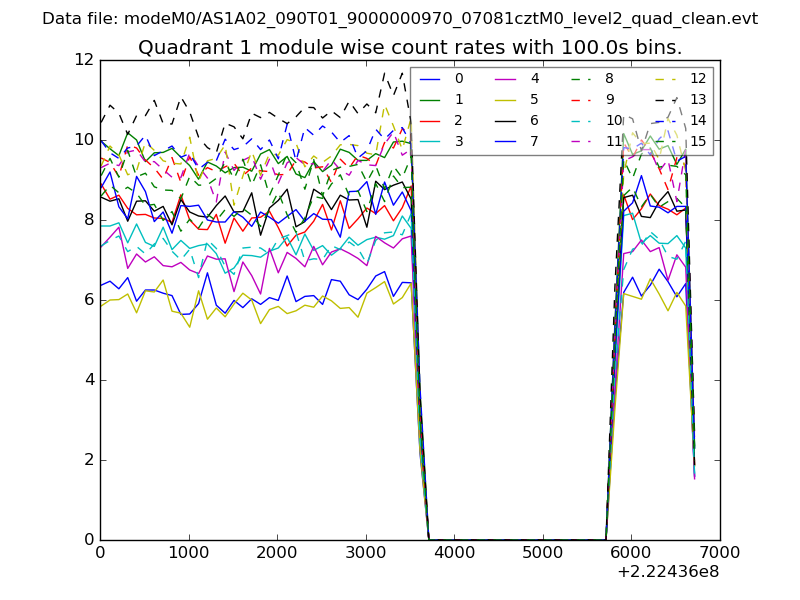
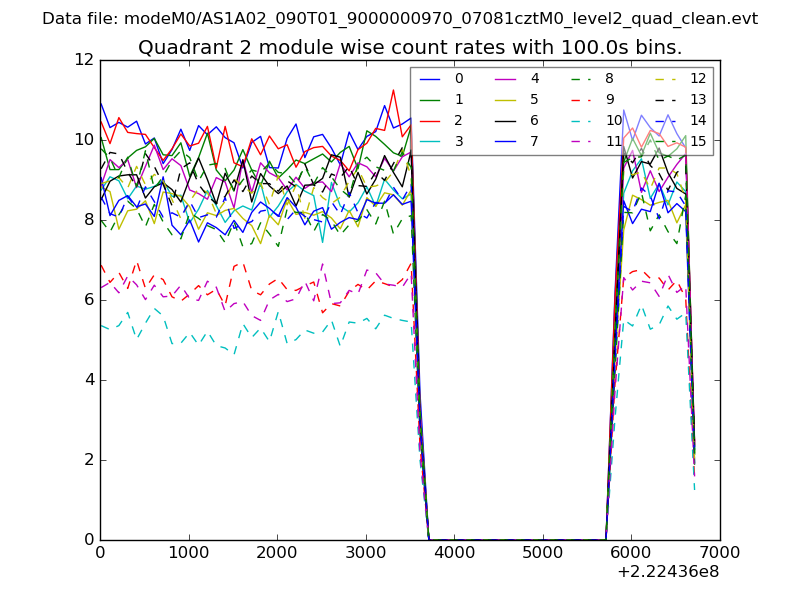
| Quadrant-wise count rates Data is divided into 100 sec bins |
 |
|
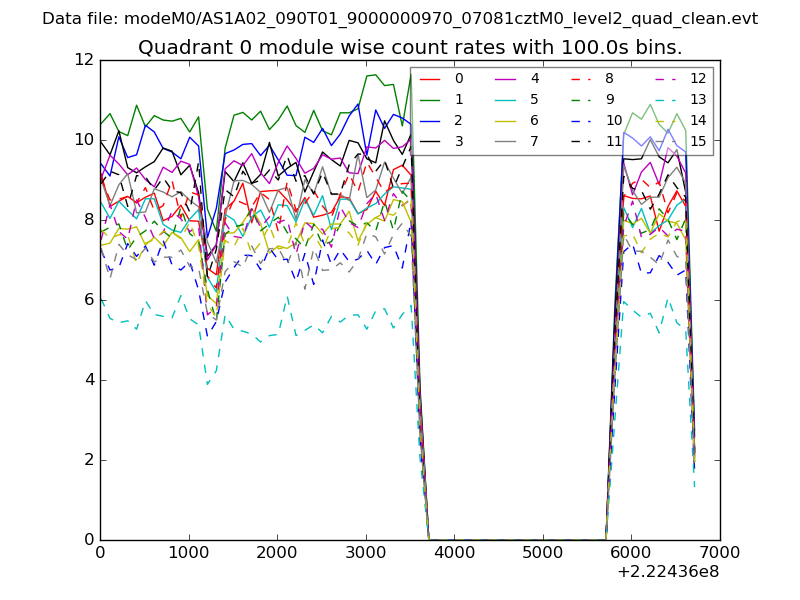
| Module-wise count rates for Quadrant A Data is divided into 100 sec bins |
 |
 |
| Module-wise count rates for Quadrant B Data is divided into 100 sec bins |
 |
 |
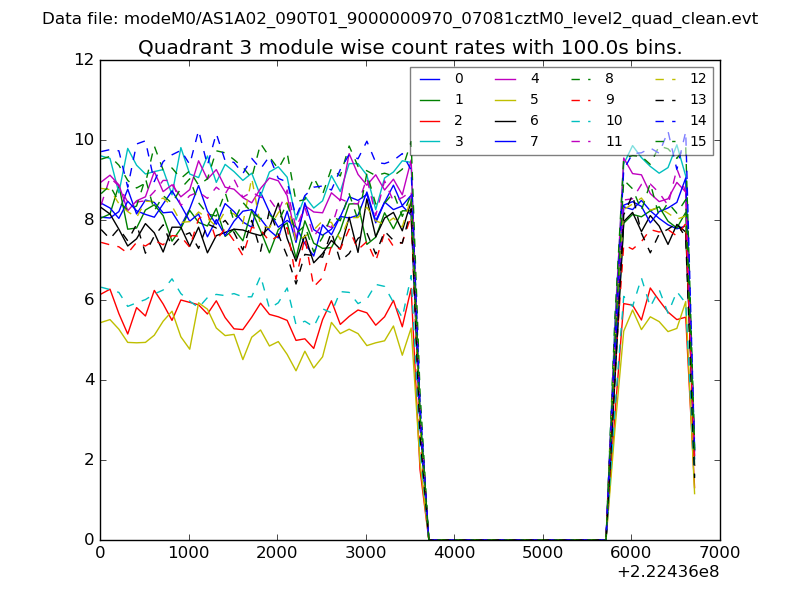
| Module-wise count rates for Quadrant C Data is divided into 100 sec bins |
 |
 |
| Module-wise count rates for Quadrant D Data is divided into 100 sec bins |
 |
 |
| Parameter | Plot |
|---|---|
| CZT HV Monitor | 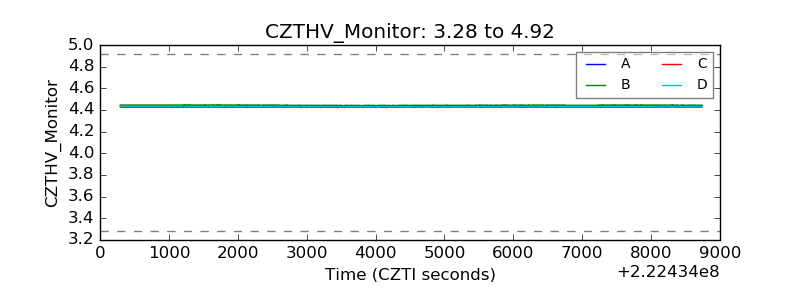 |
| D_VDD | 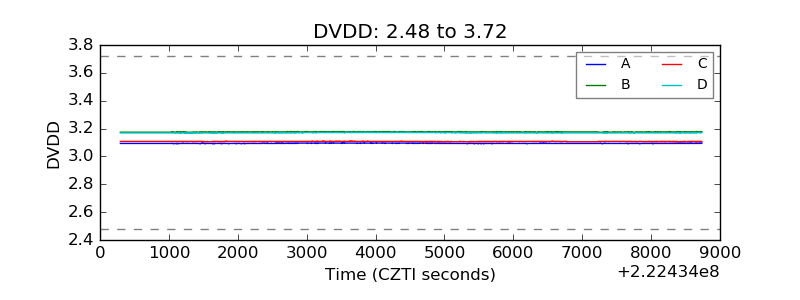 |
| Temperature 1 | 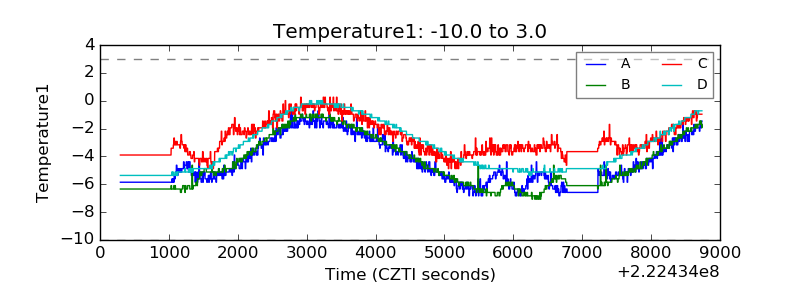 |
| Veto HV Monitor | 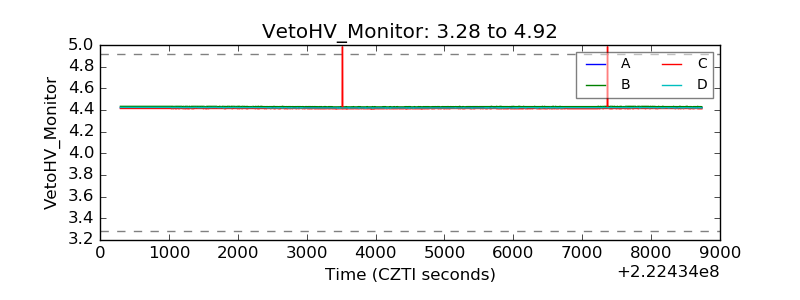 |
| Veto LLD | 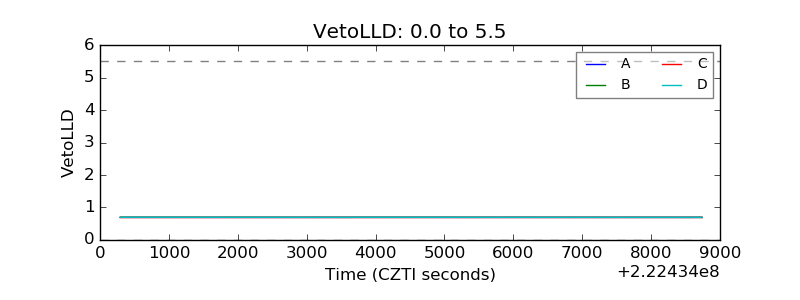 |
| Alpha Counter | 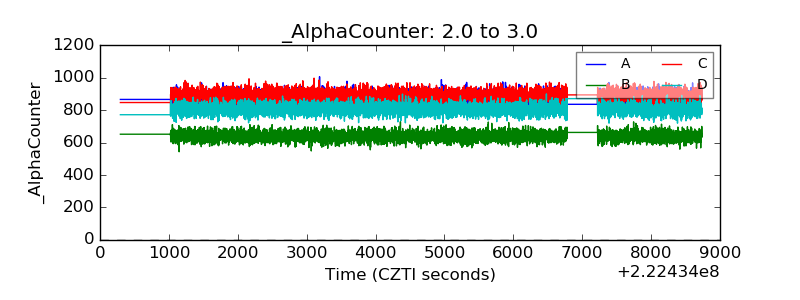 |
| _CPM_Rate | 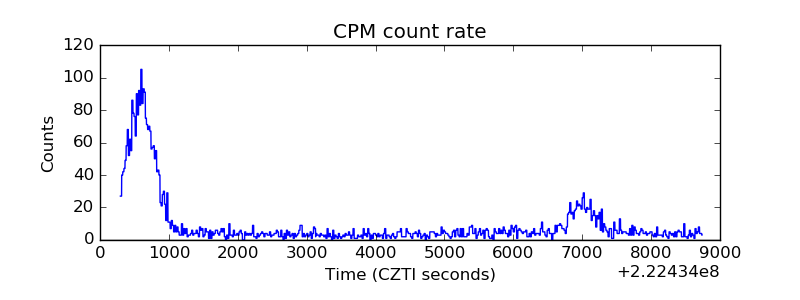 |
| CZT Counter | 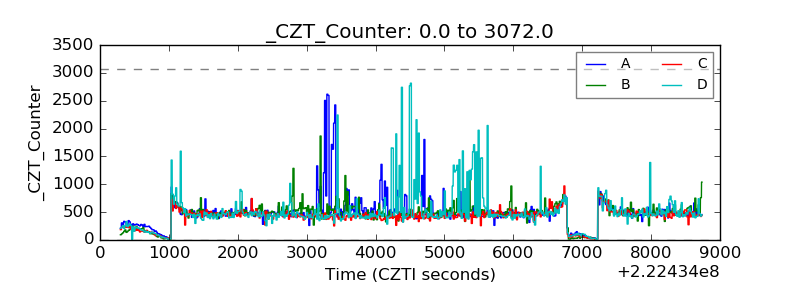 |
| +2.5 Volts monitor | 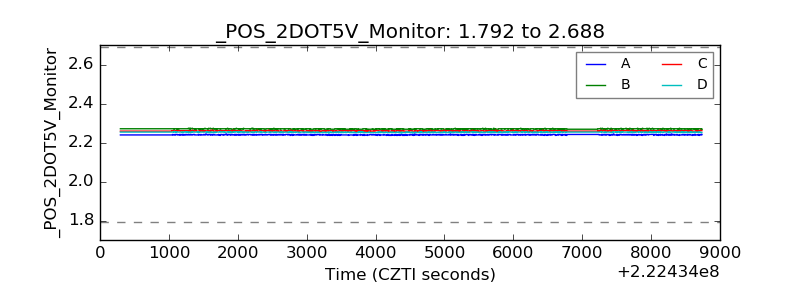 |
| +5 Volts monitor |  |
| _ROLL_ROT | 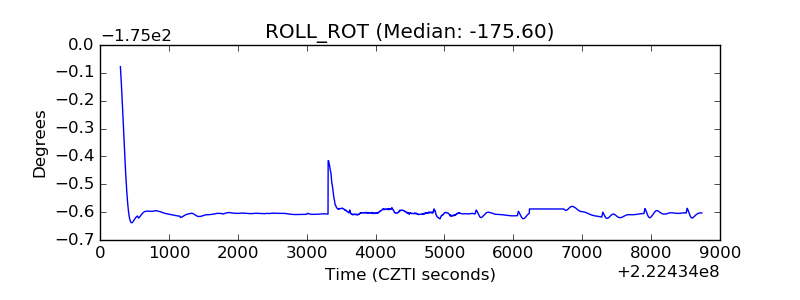 |
| _Roll_DEC | 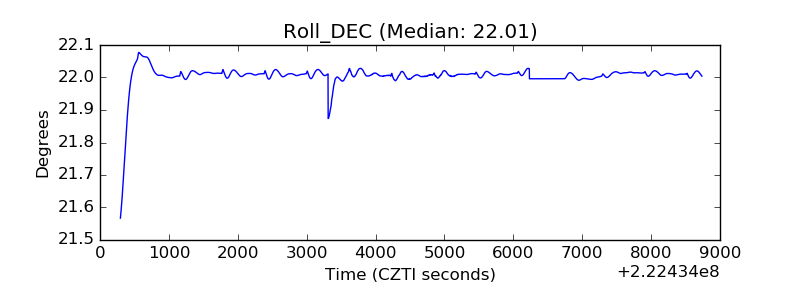 |
| _Roll_RA | 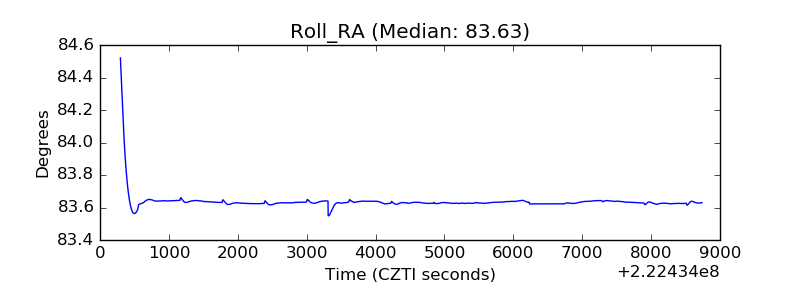 |
| Veto Counter | 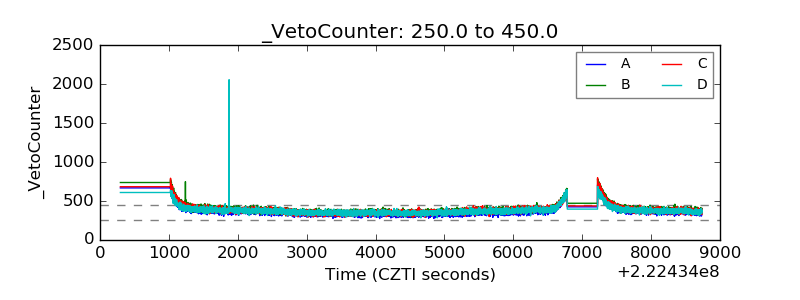 |