| Param | Original file | Final file |
|---|---|---|
| Filename | modeM0/AS1A02_090T01_9000000970_07082cztM0_level2.evt | modeM0/AS1A02_090T01_9000000970_07082cztM0_level2_quad_clean.evt |
| Size (bytes) | 508,498,560 | 95,794,560 |
| Size | 484.9 MB | 91.4 MB |
| Events in quadrant A | 3,277,599 | 620,098 |
| Events in quadrant B | 3,875,446 | 619,882 |
| Events in quadrant C | 3,189,661 | 619,235 |
| Events in quadrant D | 4,597,915 | 570,652 |
| Mode M0 | |||
|---|---|---|---|
| Quadrant | BADHDUFLAG | Total packets | Discarded packets |
| A | 0 | 14116 | 2 |
| B | 0 | 15806 | 1 |
| C | 0 | 14072 | 1 |
| D | 0 | 18140 | 1 |
| Mode M9 | |||
|---|---|---|---|
| Quadrant | BADHDUFLAG | Total packets | Discarded packets |
| A | 0 | 1 | 0 |
| B | 0 | 1 | 0 |
| C | 0 | 1 | 0 |
| D | 0 | 1 | 0 |
| Mode SS | |||
|---|---|---|---|
| Quadrant | BADHDUFLAG | Total packets | Discarded packets |
| A | 0 | 136 | 0 |
| B | 0 | 136 | 0 |
| C | 0 | 136 | 0 |
| D | 0 | 136 | 0 |
| Quadrant | Total seconds | Saturated seconds | Saturation percentage |
|---|---|---|---|
| A | 6764 | 231 | 3.415139% |
| B | 6764 | 290 | 4.287404% |
| C | 6764 | 133 | 1.966292% |
| D | 6764 | 496 | 7.332939% |
Noise dominated data is calculated using 1-second bins in cleaned event files. If a bin has >2000 counts, and if more than 50% of those come from <1% of pixels, then it is considered to be noise-dominated and hence unusable.
| Quadrant | # 1 sec bins | Bins with >0 counts | Bins with >2000 counts | High rate bins dominated by noise | Noise dominated (total time) | Noise dominated (detector-on time) | Marked lightcurve |
|---|---|---|---|---|---|---|---|
| A | 6869 | 6765 | 0 | 0 | 0.00% | 0.00% | 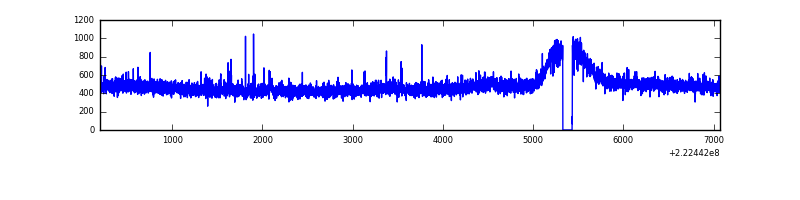 |
| B | 6869 | 6765 | 40 | 40 | 0.58% | 0.59% | 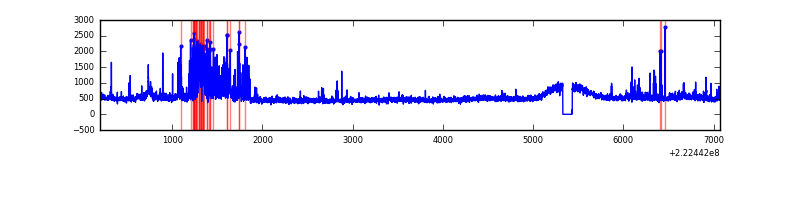 |
| C | 6869 | 6765 | 0 | 0 | 0.00% | 0.00% | 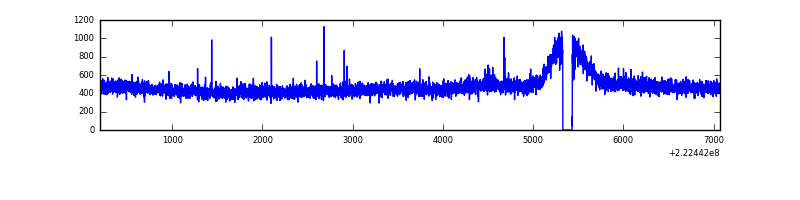 |
| D | 6869 | 6765 | 287 | 287 | 4.18% | 4.24% | 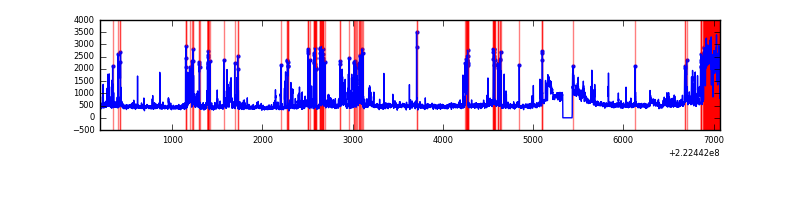 |
Top three noisy pixels from each quadrant. If the there are fewer than three noisy pixels in the level2.evt file, extra rows are filled as -1
| Pixel properties | Quadrant properties | ||||||
|---|---|---|---|---|---|---|---|
| Quadrant | DetID | PixID | Counts | Sigma | Mean | Median | Sigma |
| A | 8 | 15 | 16529 | 90.71 | 840 | 822 | 173.2 |
| A | 13 | 14 | 15271 | 83.44 | 840 | 822 | 173.2 |
| A | 3 | 1 | 8671 | 45.33 | 840 | 822 | 173.2 |
| B | 0 | 219 | 373636 | 2285.38 | 839 | 818 | 163.1 |
| B | 0 | 214 | 133097 | 810.87 | 839 | 818 | 163.1 |
| B | 4 | 239 | 102371 | 622.52 | 839 | 818 | 163.1 |
| C | 13 | 61 | 6435 | 29.51 | 813 | 820 | 190.3 |
| C | 1 | 3 | 5789 | 26.12 | 813 | 820 | 190.3 |
| C | 8 | 128 | 4845 | 21.15 | 813 | 820 | 190.3 |
| D | 14 | 34 | 734419 | 3637.49 | 804 | 779 | 201.7 |
| D | 2 | 14 | 247896 | 1225.24 | 804 | 779 | 201.7 |
| D | 1 | 83 | 165055 | 814.5 | 804 | 779 | 201.7 |
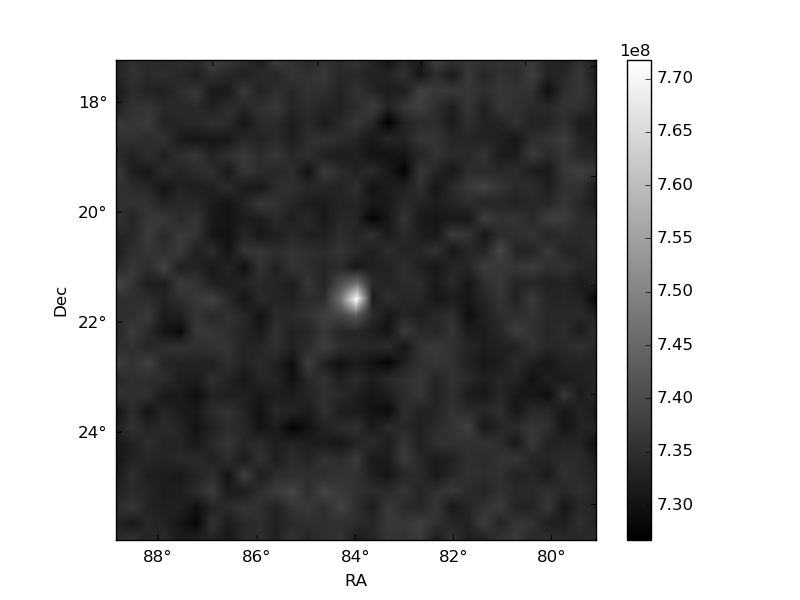
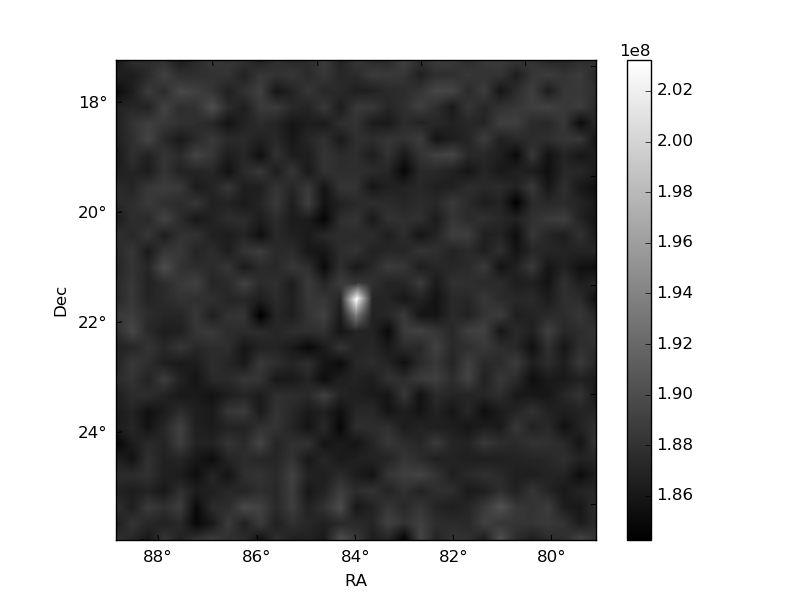
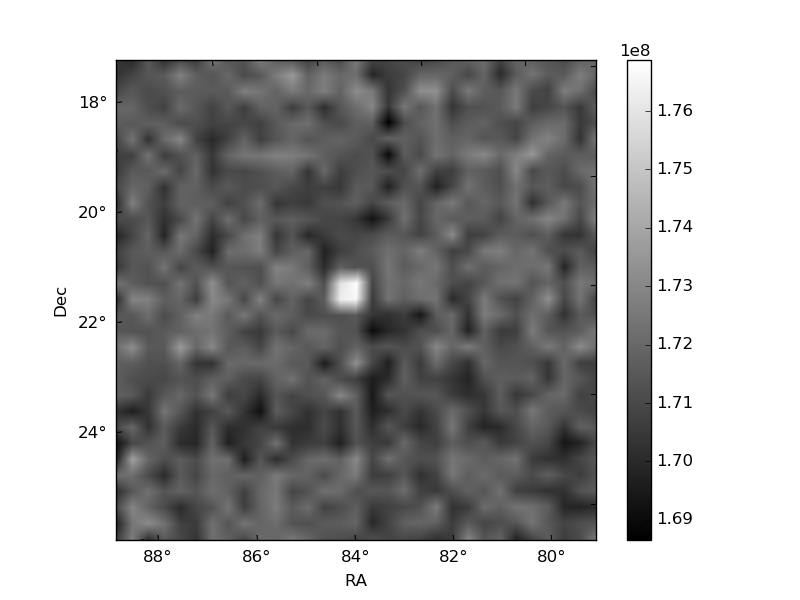
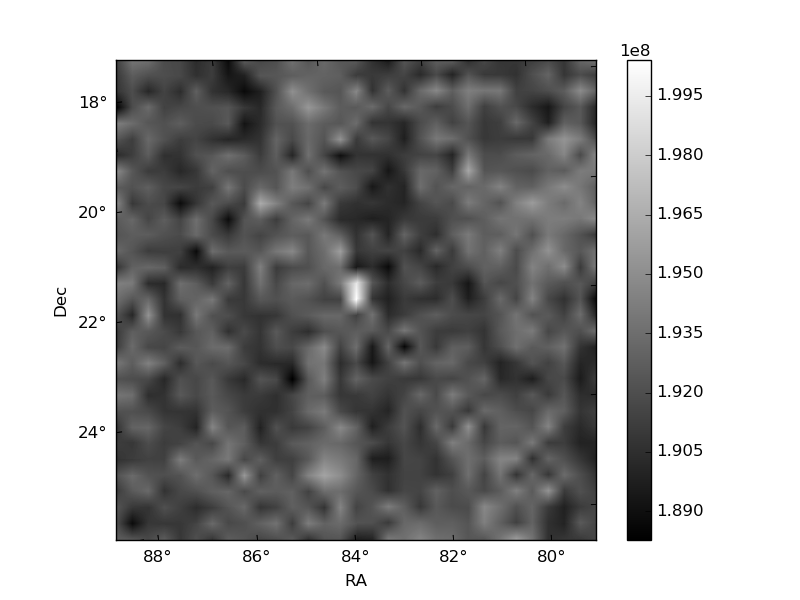
Histogram calculated using DETX and DETY for each event in the final _common_clean file
| Quadrant A | 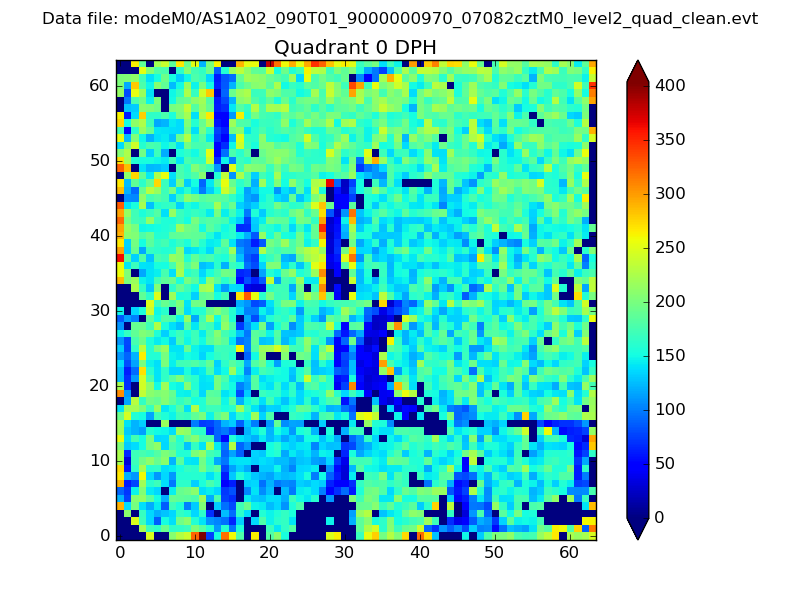 |
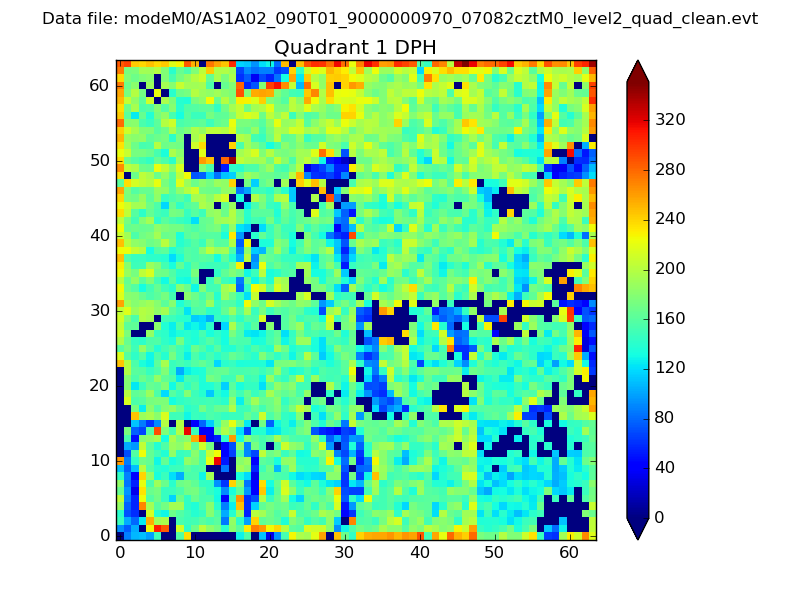 |
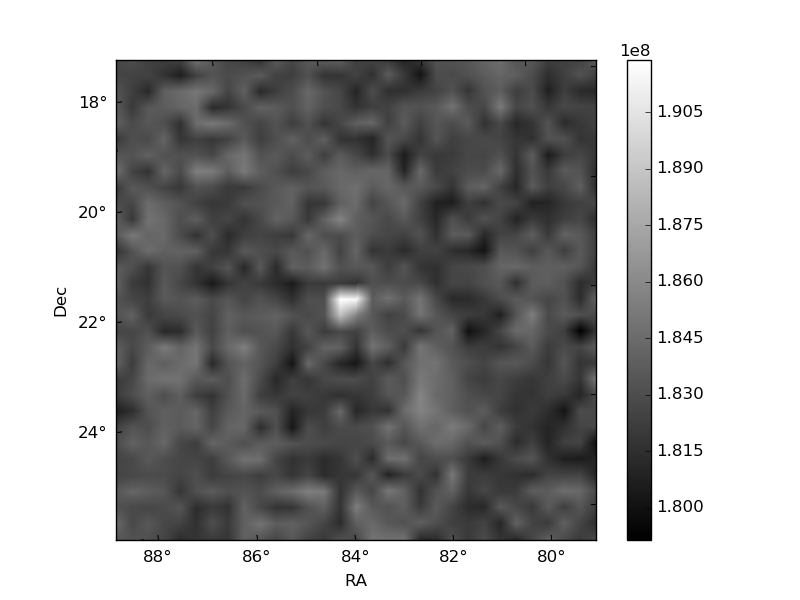
Quadrant B |
|---|---|---|---|
| Quadrant D | 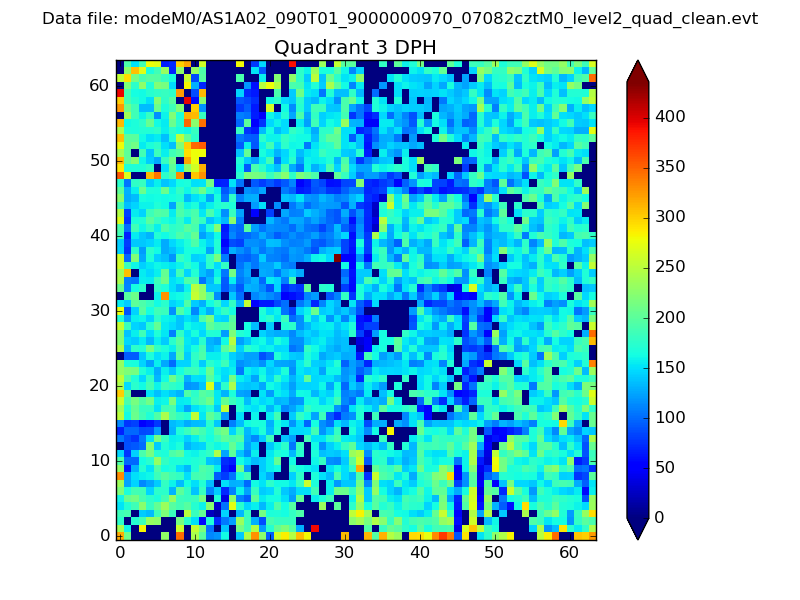 |
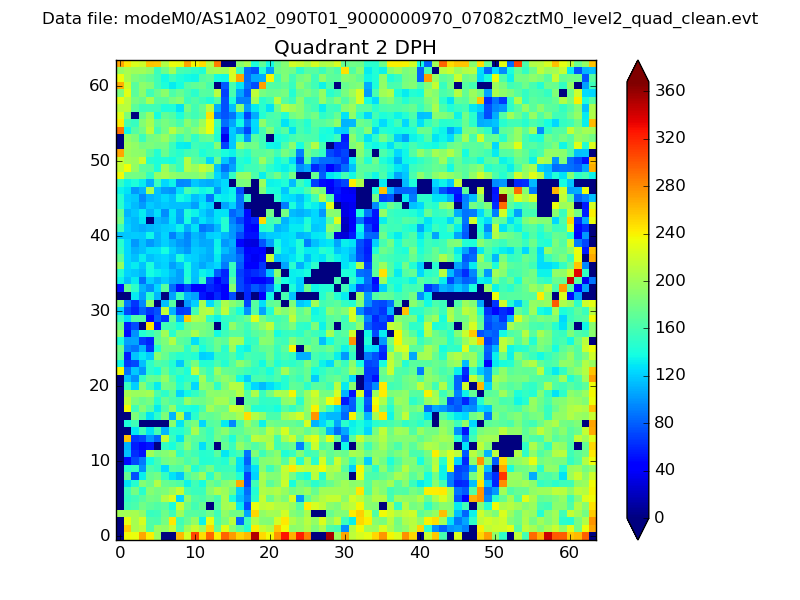 |
Quadrant C |
| Plot type | Count rate plots | Images |
|---|---|---|
| Comparison with Poisson distribution Blue bars denote a histogram of data divided into 1 sec bins. Red curve is a Poisson curve with rate = median count rate of data. |
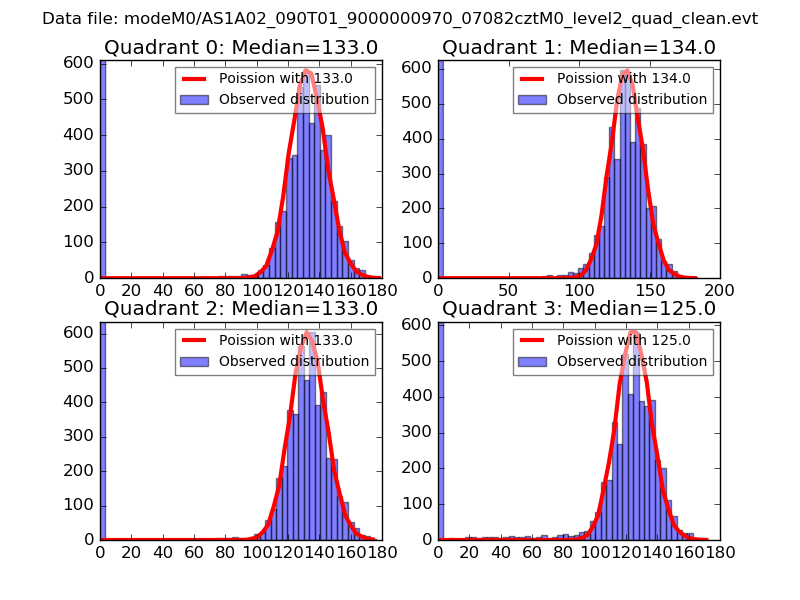 |
 |
| Quadrant-wise count rates Data is divided into 100 sec bins |
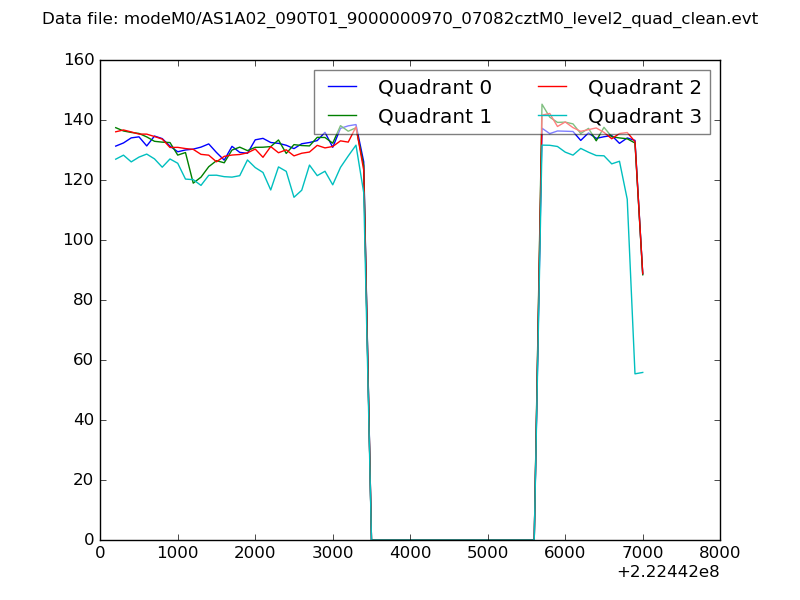 |
|
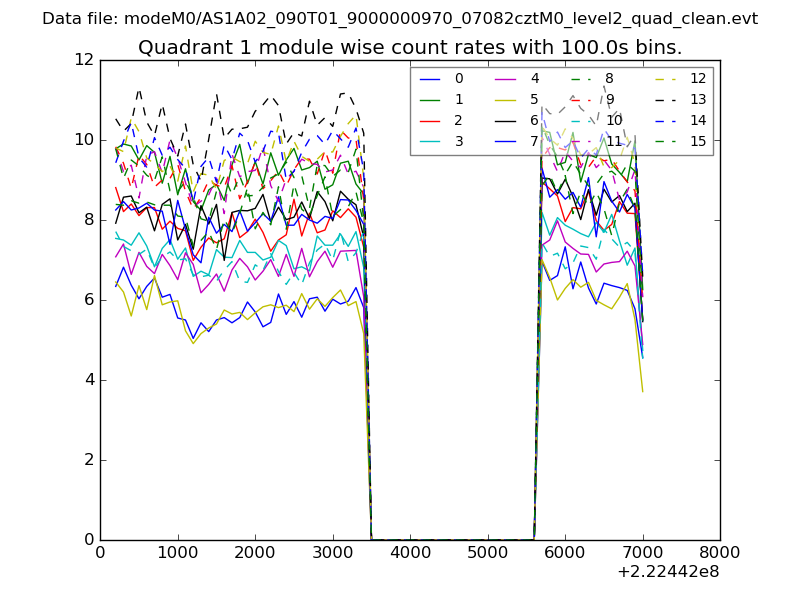
| Module-wise count rates for Quadrant A Data is divided into 100 sec bins |
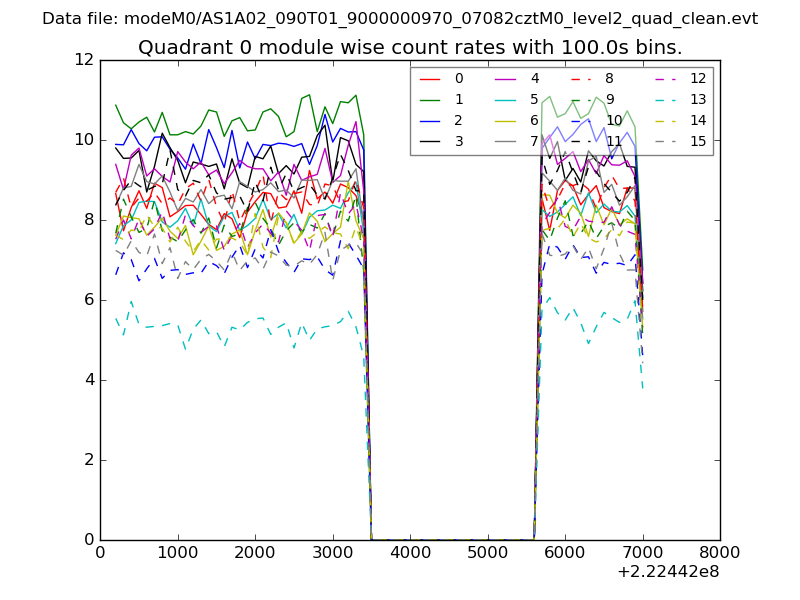 |
 |
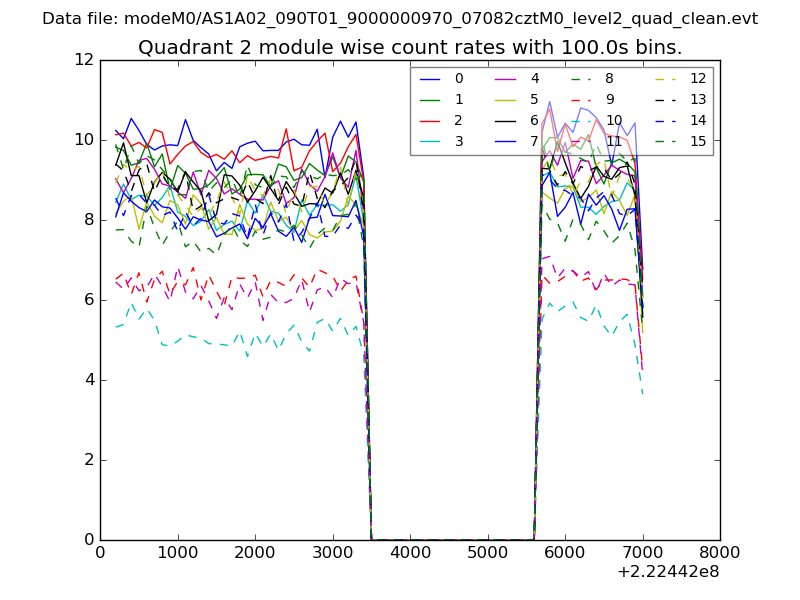
| Module-wise count rates for Quadrant B Data is divided into 100 sec bins |
 |
 |
| Module-wise count rates for Quadrant C Data is divided into 100 sec bins |
 |
 |
| Module-wise count rates for Quadrant D Data is divided into 100 sec bins |
 |
 |
| Parameter | Plot |
|---|---|
| CZT HV Monitor | 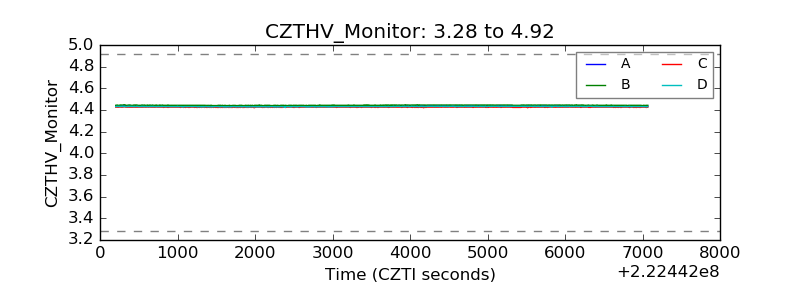 |
| D_VDD | 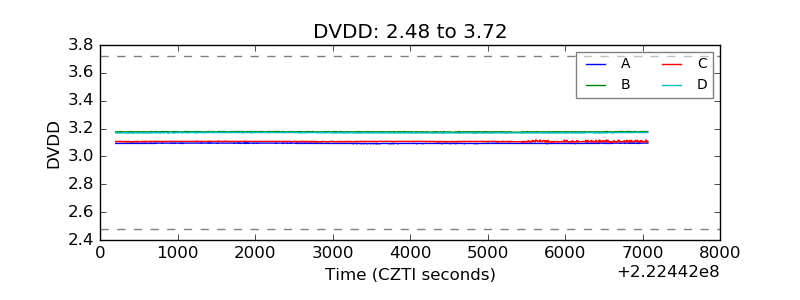 |
| Temperature 1 | 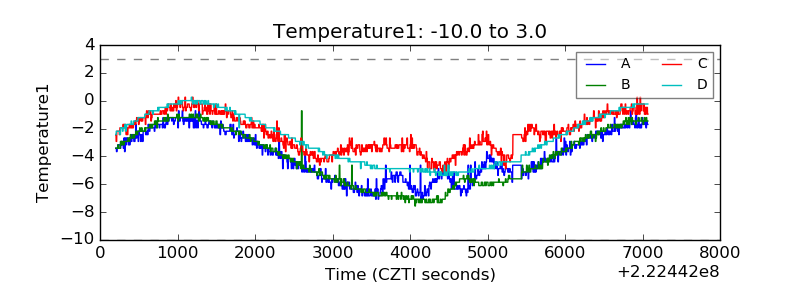 |
| Veto HV Monitor | 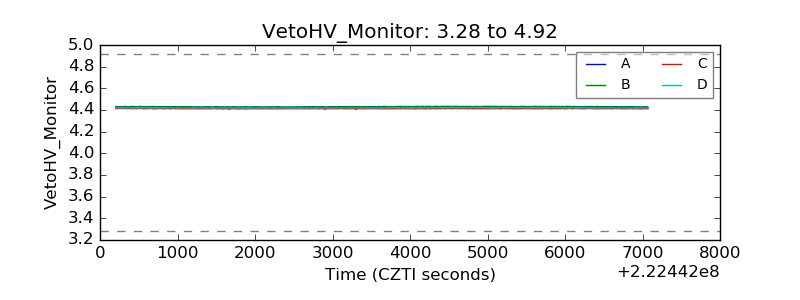 |
| Veto LLD | 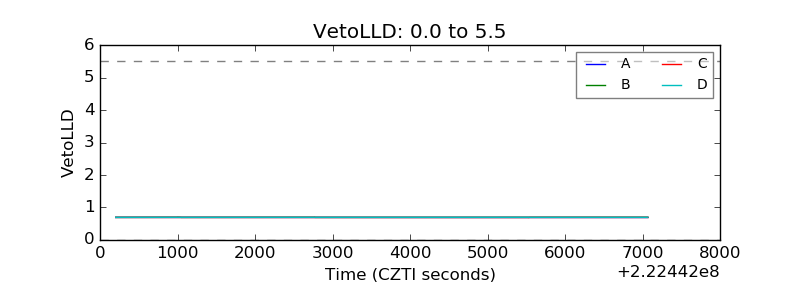 |
| Alpha Counter | 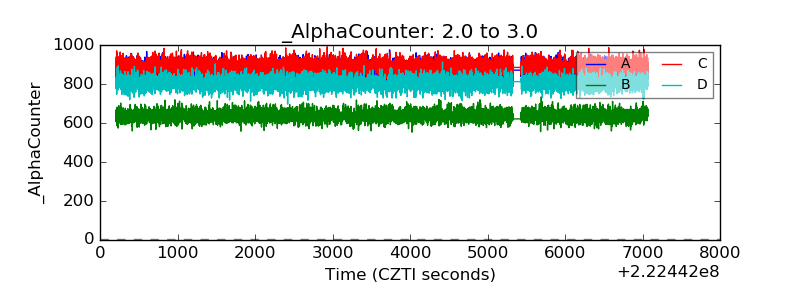 |
| _CPM_Rate | 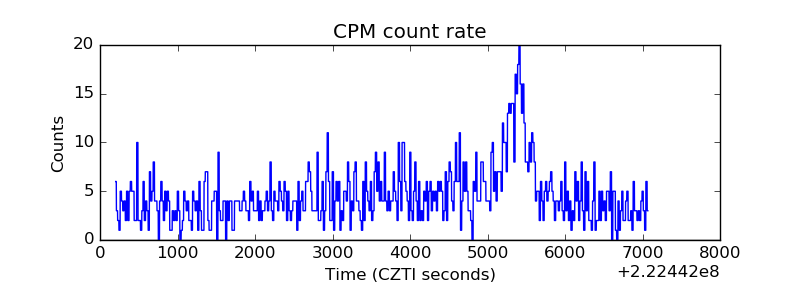 |
| CZT Counter | 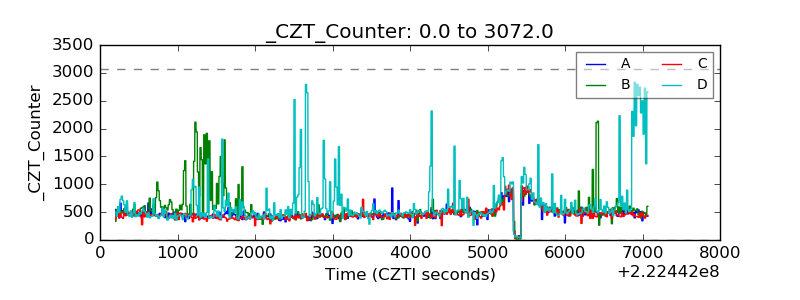 |
| +2.5 Volts monitor |  |
| +5 Volts monitor |  |
| _ROLL_ROT | 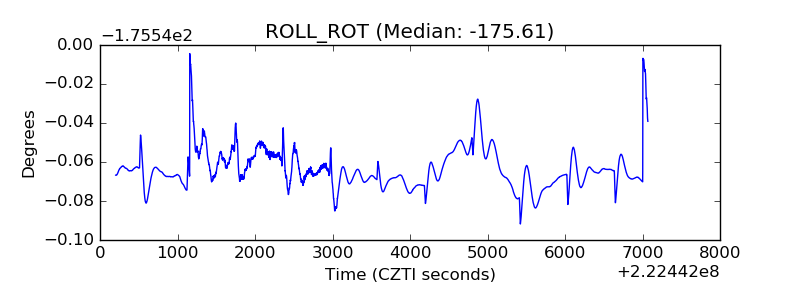 |
| _Roll_DEC | 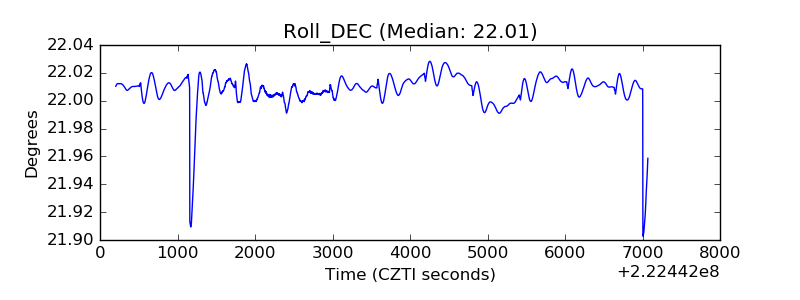 |
| _Roll_RA | 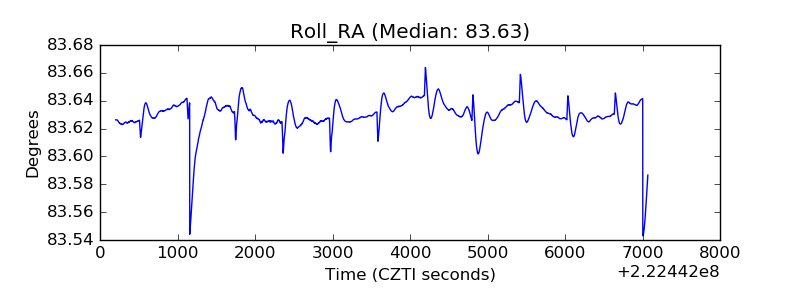 |
| Veto Counter | 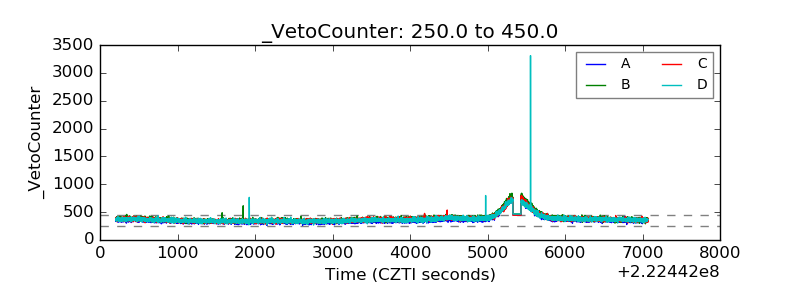 |