| Param | Original file | Final file |
|---|---|---|
| Filename | modeM0/AS1A02_090T01_9000000970_07083cztM0_level2.evt | modeM0/AS1A02_090T01_9000000970_07083cztM0_level2_quad_clean.evt |
| Size (bytes) | 518,924,160 | 95,351,040 |
| Size | 494.9 MB | 90.9 MB |
| Events in quadrant A | 3,230,464 | 622,759 |
| Events in quadrant B | 3,723,347 | 623,692 |
| Events in quadrant C | 3,165,164 | 619,300 |
| Events in quadrant D | 5,131,605 | 544,323 |
| Mode M0 | |||
|---|---|---|---|
| Quadrant | BADHDUFLAG | Total packets | Discarded packets |
| A | 0 | 14158 | 2 |
| B | 0 | 15552 | 1 |
| C | 0 | 14093 | 1 |
| D | 0 | 19988 | 1 |
| Mode M9 | |||
|---|---|---|---|
| Quadrant | BADHDUFLAG | Total packets | Discarded packets |
| A | 0 | 2 | 0 |
| B | 0 | 2 | 0 |
| C | 0 | 2 | 0 |
| D | 0 | 2 | 0 |
| Mode SS | |||
|---|---|---|---|
| Quadrant | BADHDUFLAG | Total packets | Discarded packets |
| A | 0 | 140 | 0 |
| B | 0 | 140 | 0 |
| C | 0 | 140 | 0 |
| D | 0 | 140 | 0 |
| Quadrant | Total seconds | Saturated seconds | Saturation percentage |
|---|---|---|---|
| A | 6846 | 116 | 1.694420% |
| B | 6846 | 135 | 1.971954% |
| C | 6846 | 50 | 0.730353% |
| D | 6846 | 630 | 9.202454% |
Noise dominated data is calculated using 1-second bins in cleaned event files. If a bin has >2000 counts, and if more than 50% of those come from <1% of pixels, then it is considered to be noise-dominated and hence unusable.
| Quadrant | # 1 sec bins | Bins with >0 counts | Bins with >2000 counts | High rate bins dominated by noise | Noise dominated (total time) | Noise dominated (detector-on time) | Marked lightcurve |
|---|---|---|---|---|---|---|---|
| A | 7121 | 6847 | 0 | 0 | 0.00% | 0.00% | 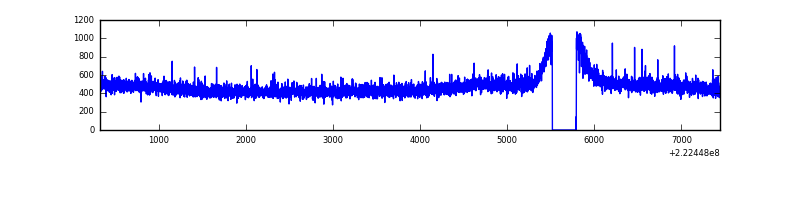 |
| B | 7121 | 6846 | 7 | 7 | 0.10% | 0.10% | 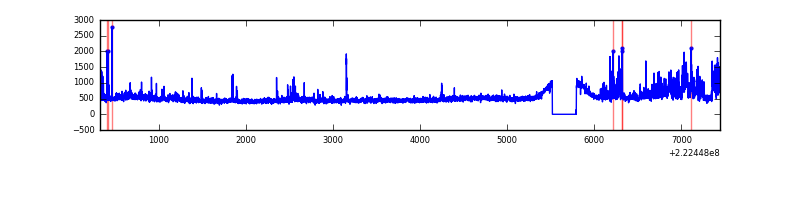 |
| C | 7121 | 6846 | 0 | 0 | 0.00% | 0.00% | 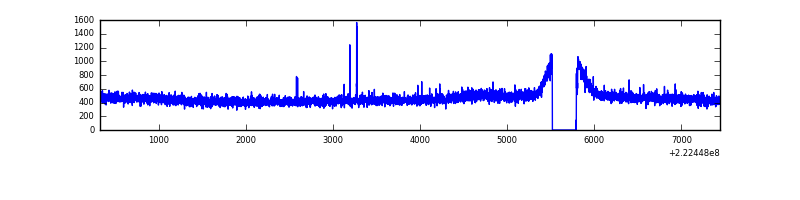 |
| D | 7121 | 6846 | 559 | 559 | 7.85% | 8.17% | 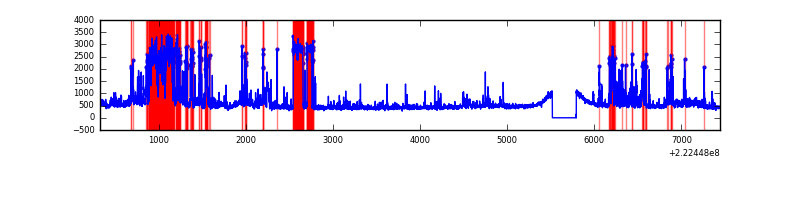 |
Top three noisy pixels from each quadrant. If the there are fewer than three noisy pixels in the level2.evt file, extra rows are filled as -1
| Pixel properties | Quadrant properties | ||||||
|---|---|---|---|---|---|---|---|
| Quadrant | DetID | PixID | Counts | Sigma | Mean | Median | Sigma |
| A | 8 | 15 | 8773 | 46.44 | 833 | 819 | 171.3 |
| A | 0 | 226 | 7888 | 41.27 | 833 | 819 | 171.3 |
| A | 12 | 194 | 7571 | 39.42 | 833 | 819 | 171.3 |
| B | 0 | 219 | 299319 | 1852.97 | 833 | 816 | 161.1 |
| B | 0 | 214 | 168872 | 1043.22 | 833 | 816 | 161.1 |
| B | 12 | 111 | 15388 | 90.46 | 833 | 816 | 161.1 |
| C | 13 | 61 | 6290 | 29.12 | 806 | 811 | 188.1 |
| C | 4 | 254 | 5759 | 26.3 | 806 | 811 | 188.1 |
| C | 8 | 128 | 5322 | 23.98 | 806 | 811 | 188.1 |
| D | 14 | 34 | 1080207 | 5559.58 | 776 | 752 | 194.2 |
| D | 1 | 20 | 576952 | 2967.64 | 776 | 752 | 194.2 |
| D | 12 | 233 | 285424 | 1466.16 | 776 | 752 | 194.2 |
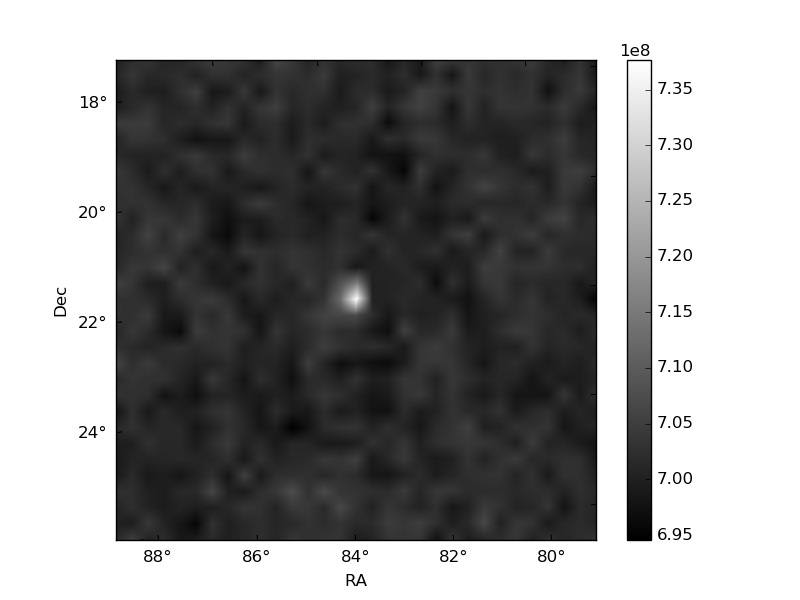
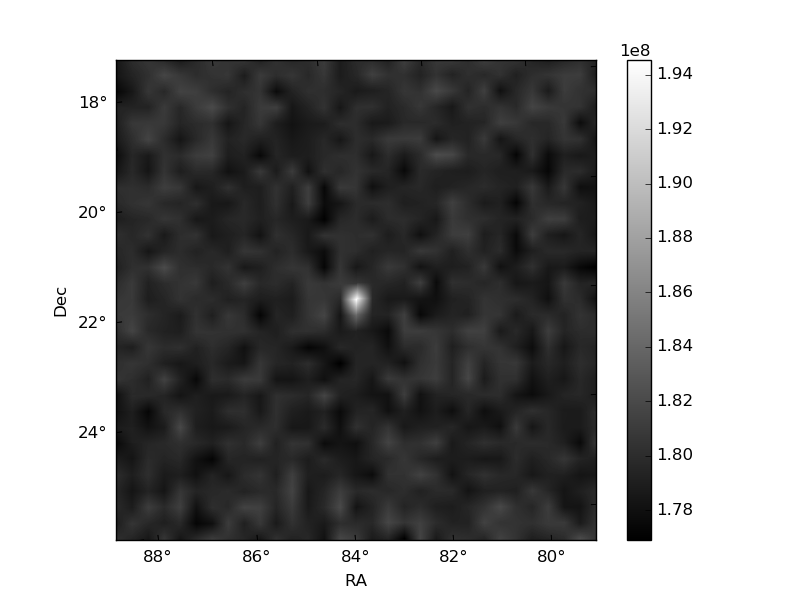
Histogram calculated using DETX and DETY for each event in the final _common_clean file
| Quadrant A | 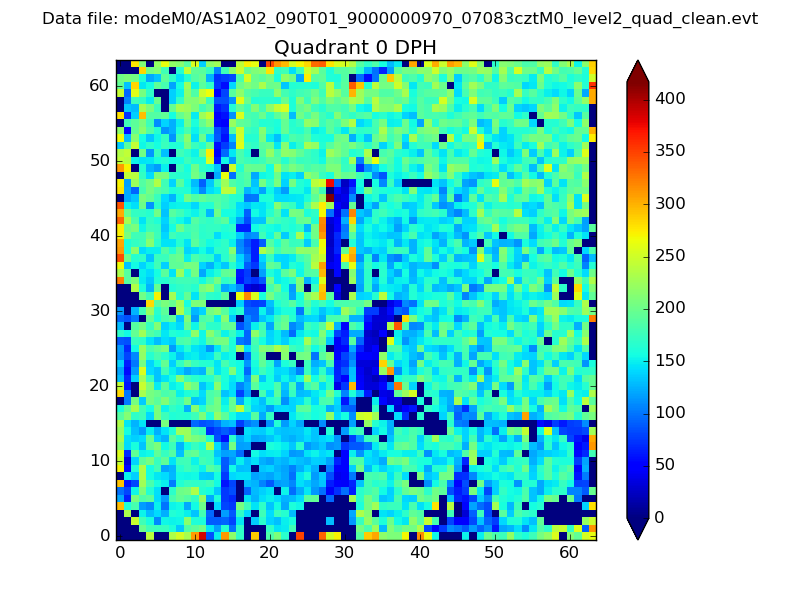 |
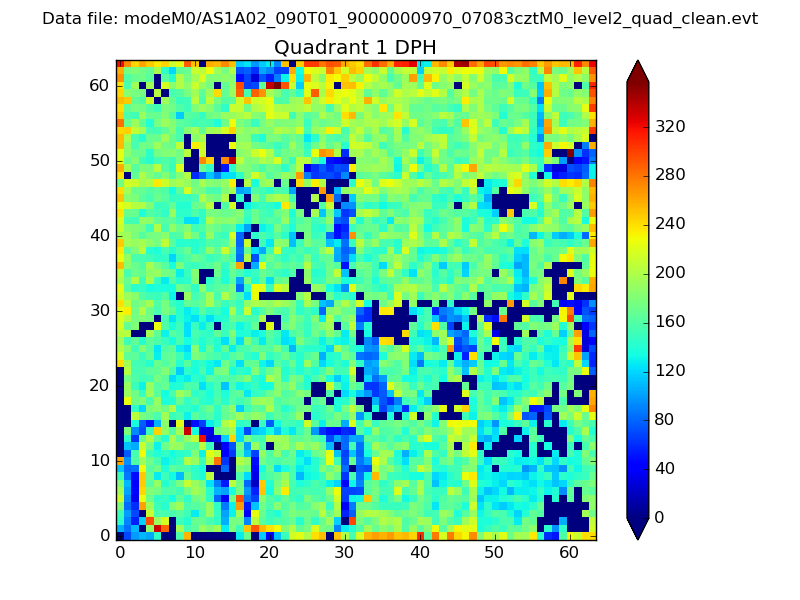 |
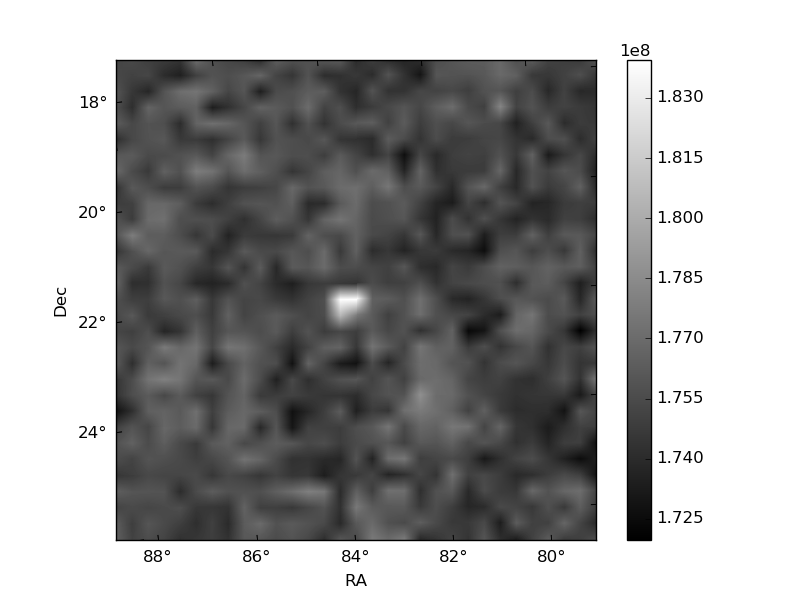
Quadrant B |
|---|---|---|---|
| Quadrant D | 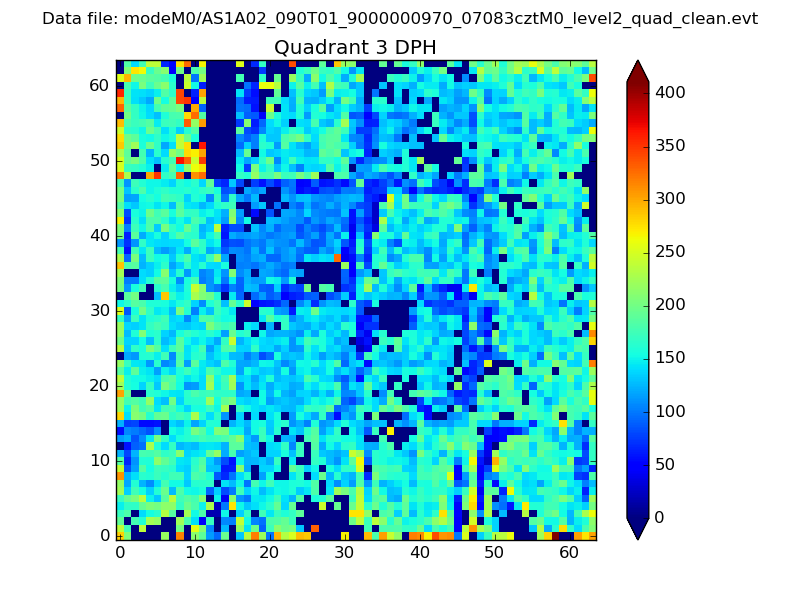 |
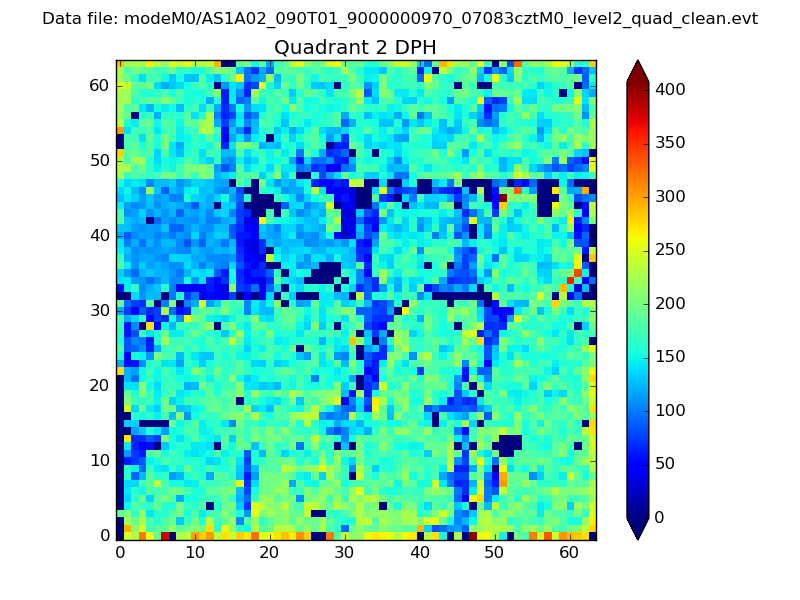 |
Quadrant C |
| Plot type | Count rate plots | Images |
|---|---|---|
| Comparison with Poisson distribution Blue bars denote a histogram of data divided into 1 sec bins. Red curve is a Poisson curve with rate = median count rate of data. |
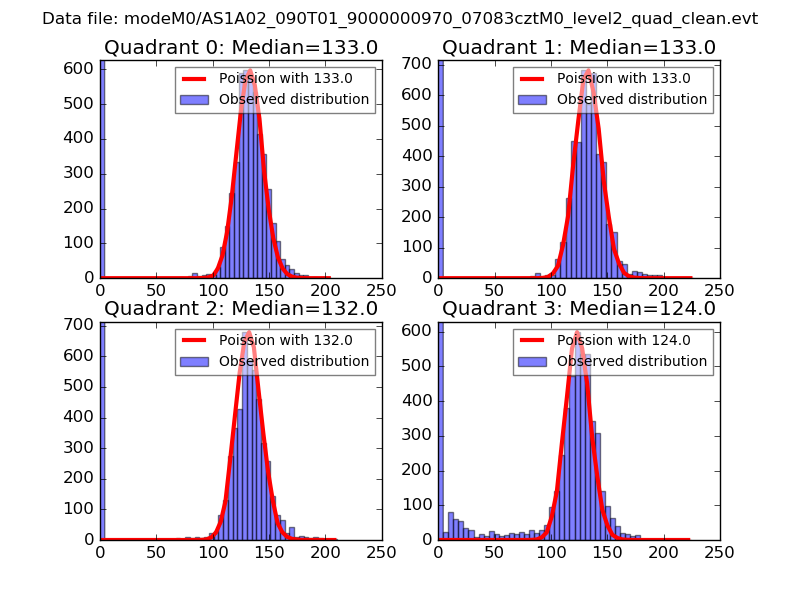 |
 |
| Quadrant-wise count rates Data is divided into 100 sec bins |
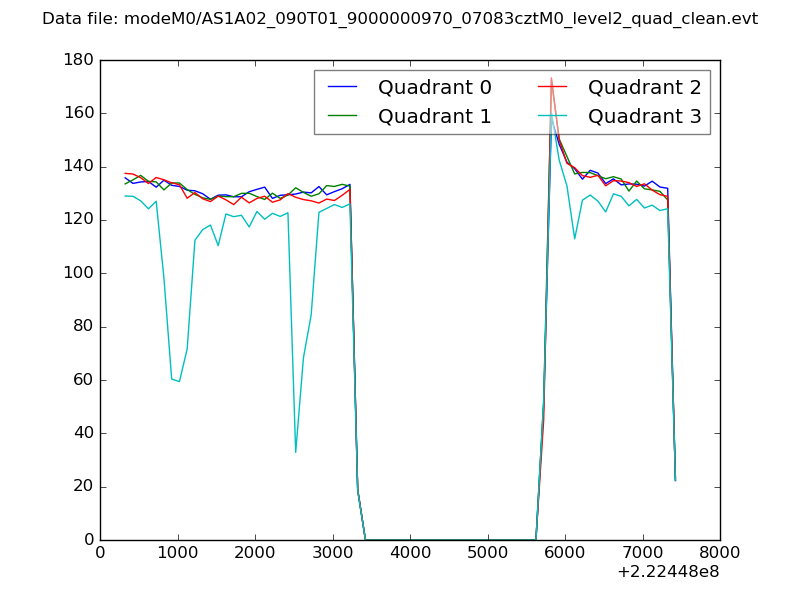 |
|
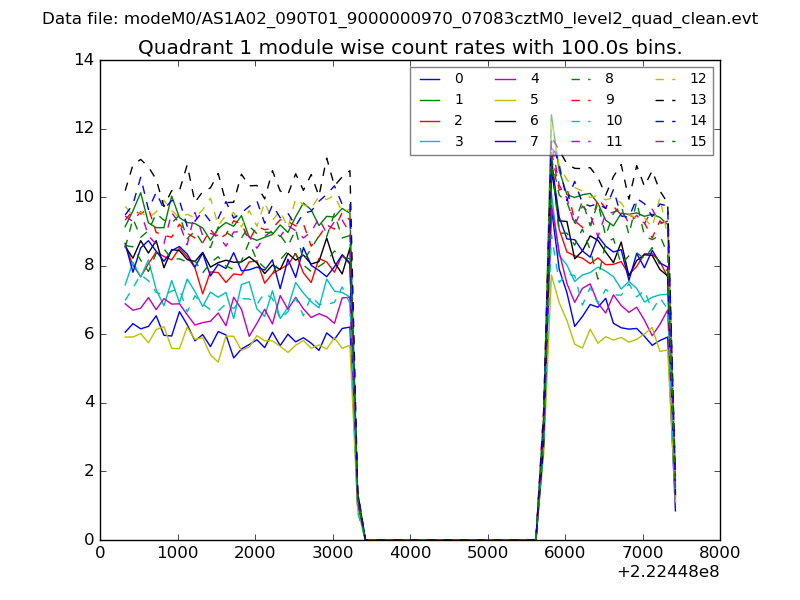
| Module-wise count rates for Quadrant A Data is divided into 100 sec bins |
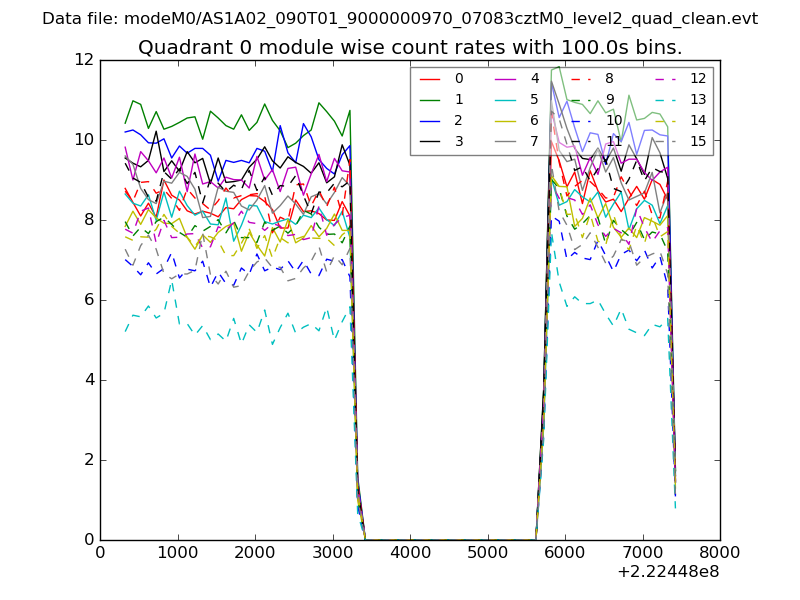 |
 |
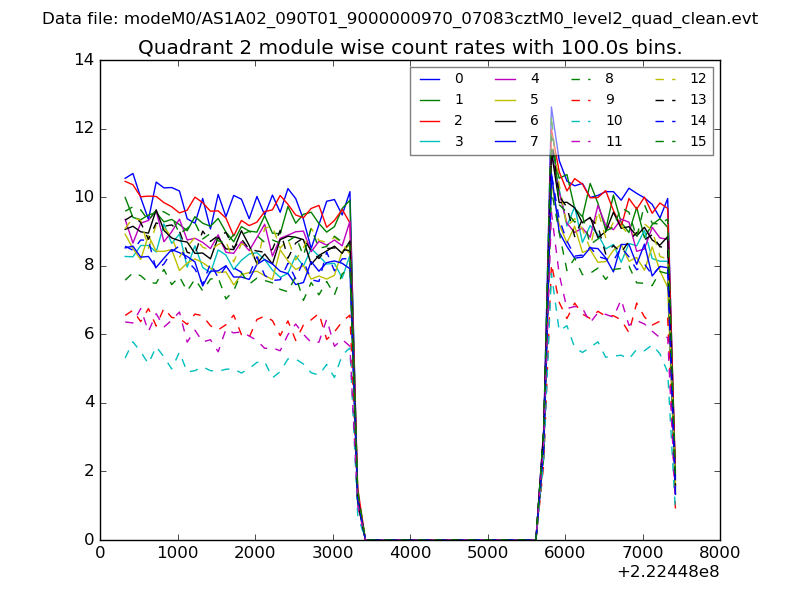
| Module-wise count rates for Quadrant B Data is divided into 100 sec bins |
 |
 |
| Module-wise count rates for Quadrant C Data is divided into 100 sec bins |
 |
 |
| Module-wise count rates for Quadrant D Data is divided into 100 sec bins |
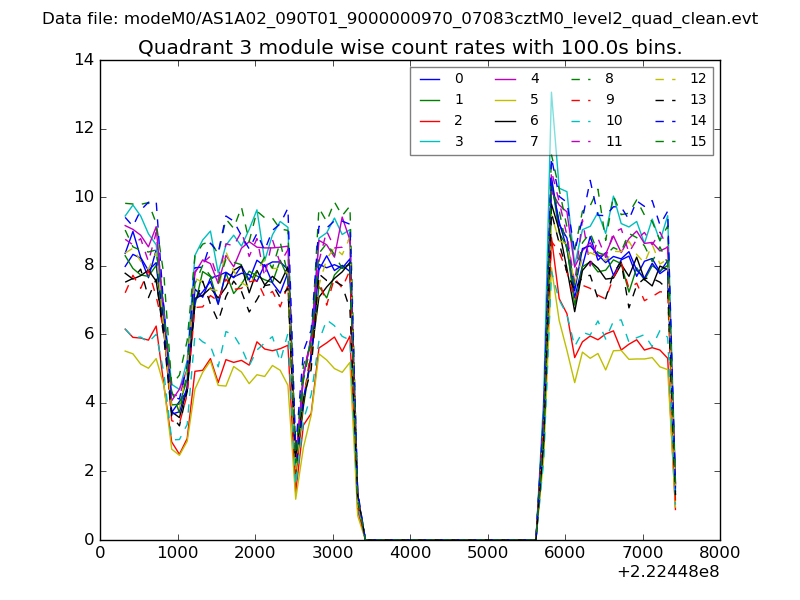 |
 |
| Parameter | Plot |
|---|---|
| CZT HV Monitor | 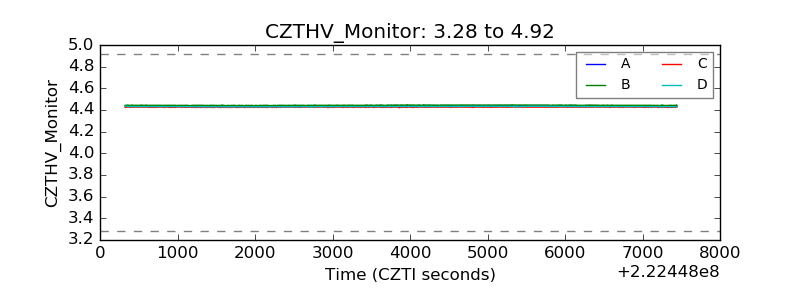 |
| D_VDD | 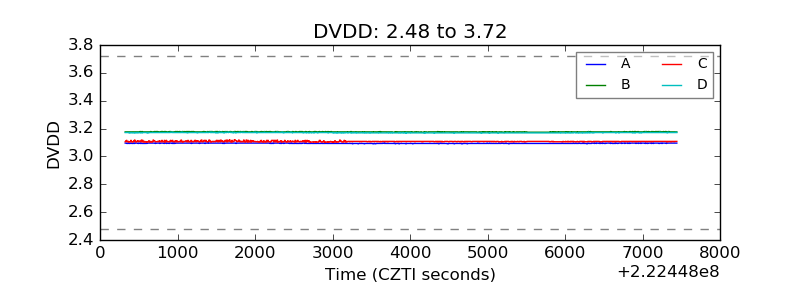 |
| Temperature 1 | 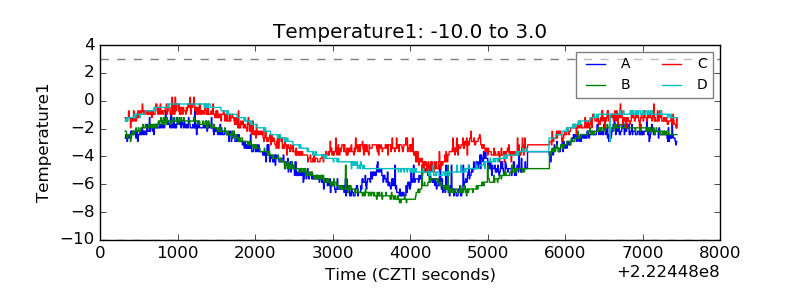 |
| Veto HV Monitor | 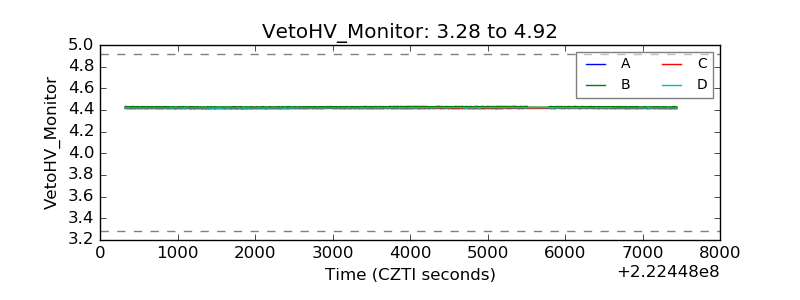 |
| Veto LLD | 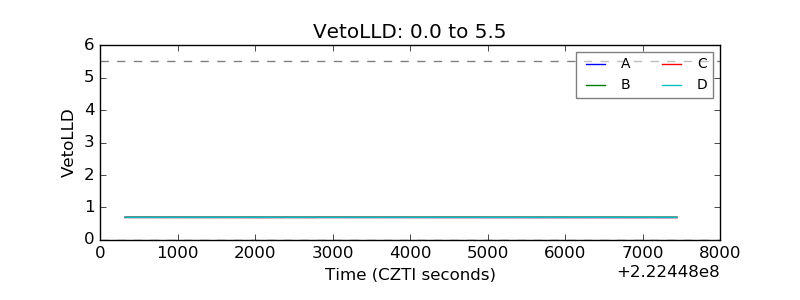 |
| Alpha Counter | 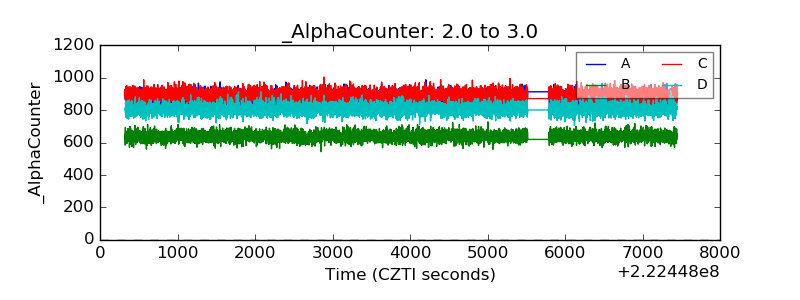 |
| _CPM_Rate | 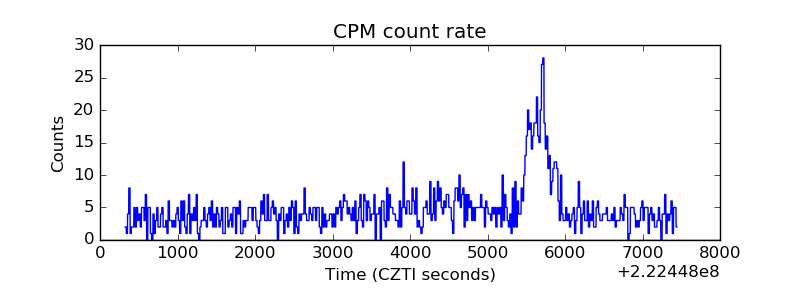 |
| CZT Counter | 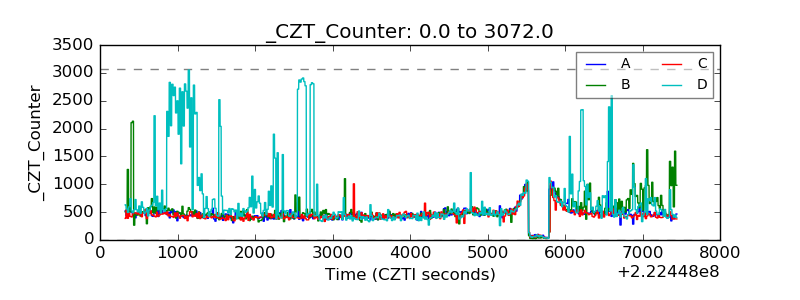 |
| +2.5 Volts monitor |  |
| +5 Volts monitor |  |
| _ROLL_ROT |  |
| _Roll_DEC |  |
| _Roll_RA | 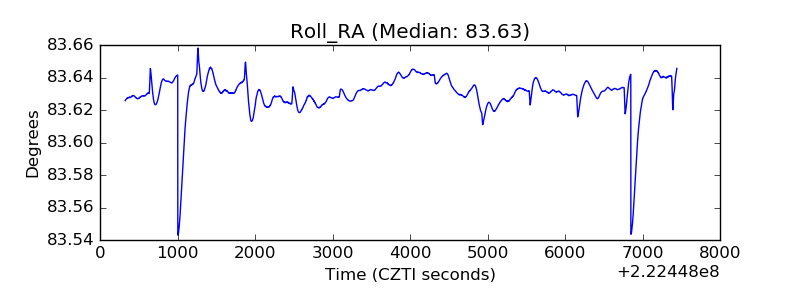 |
| Veto Counter | 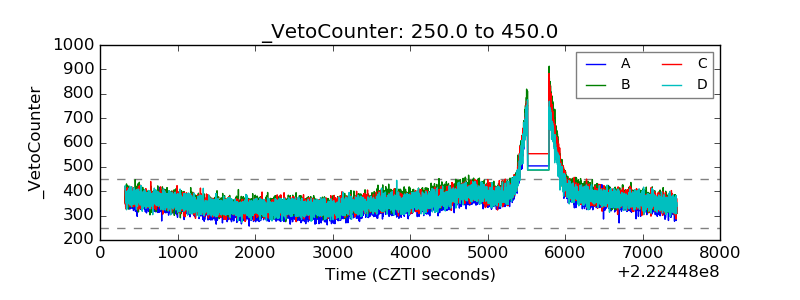 |