| Param | Original file | Final file |
|---|---|---|
| Filename | modeM0/AS1A02_090T01_9000000970_07086cztM0_level2.evt | modeM0/AS1A02_090T01_9000000970_07086cztM0_level2_quad_clean.evt |
| Size (bytes) | 1,185,382,080 | 234,420,480 |
| Size | 1.1 GB | 223.6 MB |
| Events in quadrant A | 8,109,531 | 1,489,002 |
| Events in quadrant B | 8,972,294 | 1,494,920 |
| Events in quadrant C | 8,040,444 | 1,484,247 |
| Events in quadrant D | 9,582,012 | 1,414,054 |
| Mode M0 | |||
|---|---|---|---|
| Quadrant | BADHDUFLAG | Total packets | Discarded packets |
| A | 0 | 36244 | 4 |
| B | 0 | 38428 | 3 |
| C | 0 | 36121 | 3 |
| D | 0 | 40874 | 3 |
| Mode M9 | |||
|---|---|---|---|
| Quadrant | BADHDUFLAG | Total packets | Discarded packets |
| A | 0 | 20 | 0 |
| B | 0 | 20 | 0 |
| C | 0 | 20 | 0 |
| D | 0 | 20 | 0 |
| Mode SS | |||
|---|---|---|---|
| Quadrant | BADHDUFLAG | Total packets | Discarded packets |
| A | 0 | 360 | 0 |
| B | 0 | 360 | 0 |
| C | 0 | 360 | 0 |
| D | 0 | 360 | 0 |
| Quadrant | Total seconds | Saturated seconds | Saturation percentage |
|---|---|---|---|
| A | 17667 | 125 | 0.707534% |
| B | 17667 | 185 | 1.047150% |
| C | 17667 | 74 | 0.418860% |
| D | 17667 | 238 | 1.347144% |
Noise dominated data is calculated using 1-second bins in cleaned event files. If a bin has >2000 counts, and if more than 50% of those come from <1% of pixels, then it is considered to be noise-dominated and hence unusable.
| Quadrant | # 1 sec bins | Bins with >0 counts | Bins with >2000 counts | High rate bins dominated by noise | Noise dominated (total time) | Noise dominated (detector-on time) | Marked lightcurve |
|---|---|---|---|---|---|---|---|
| A | 19672 | 17670 | 0 | 0 | 0.00% | 0.00% | 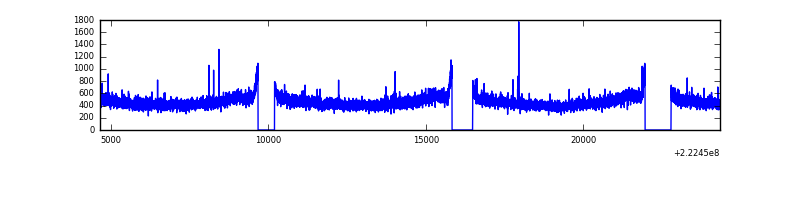 |
| B | 19672 | 17670 | 23 | 23 | 0.12% | 0.13% | 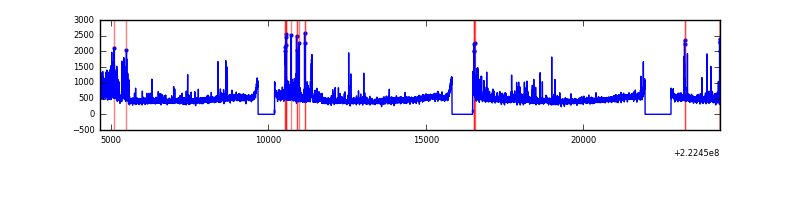 |
| C | 19672 | 17670 | 1 | 1 | 0.01% | 0.01% | 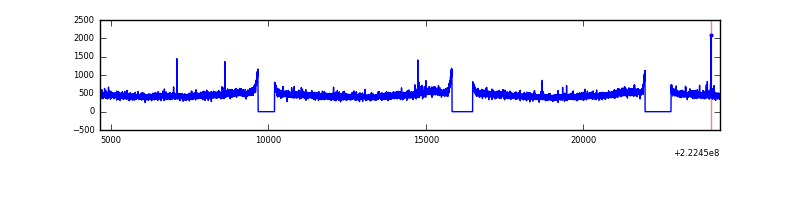 |
| D | 19672 | 17670 | 187 | 187 | 0.95% | 1.06% | 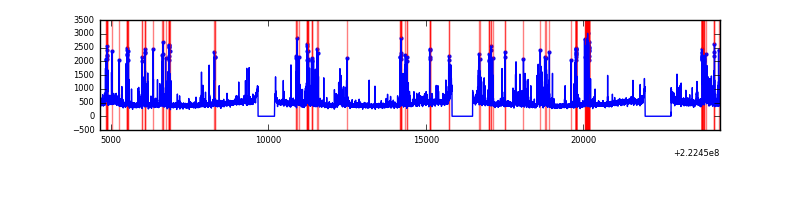 |
Top three noisy pixels from each quadrant. If the there are fewer than three noisy pixels in the level2.evt file, extra rows are filled as -1
| Pixel properties | Quadrant properties | ||||||
|---|---|---|---|---|---|---|---|
| Quadrant | DetID | PixID | Counts | Sigma | Mean | Median | Sigma |
| A | 13 | 14 | 27785 | 60.45 | 2089 | 2047 | 425.7 |
| A | 0 | 226 | 20068 | 42.33 | 2089 | 2047 | 425.7 |
| A | 12 | 194 | 18786 | 39.32 | 2089 | 2047 | 425.7 |
| B | 0 | 219 | 545059 | 1348.31 | 2108 | 2061 | 402.7 |
| B | 0 | 214 | 179832 | 441.42 | 2108 | 2061 | 402.7 |
| B | 12 | 111 | 39809 | 93.73 | 2108 | 2061 | 402.7 |
| C | 14 | 67 | 50995 | 103.57 | 2042 | 2061 | 472.5 |
| C | 1 | 3 | 18121 | 33.99 | 2042 | 2061 | 472.5 |
| C | 13 | 61 | 15947 | 29.39 | 2042 | 2061 | 472.5 |
| D | 1 | 83 | 816263 | 1638.08 | 2030 | 1971 | 497.1 |
| D | 2 | 14 | 390302 | 781.19 | 2030 | 1971 | 497.1 |
| D | 12 | 233 | 353883 | 707.93 | 2030 | 1971 | 497.1 |
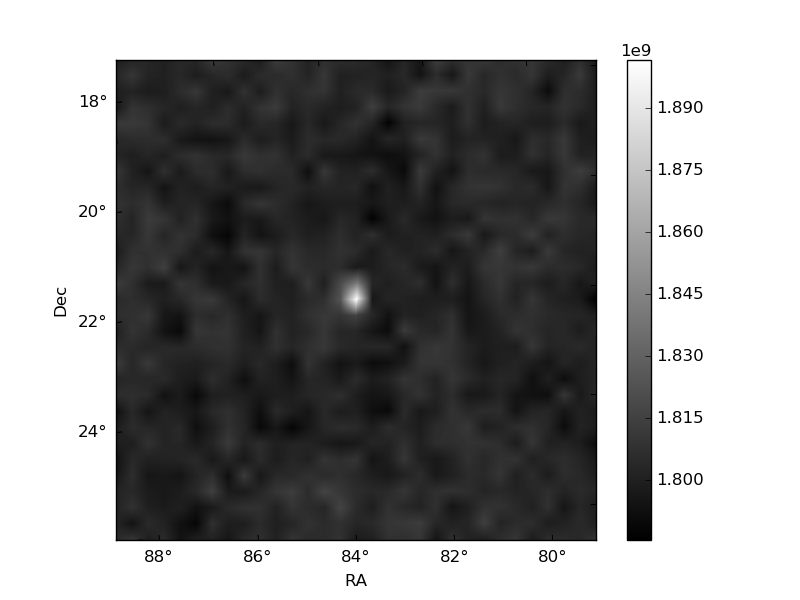
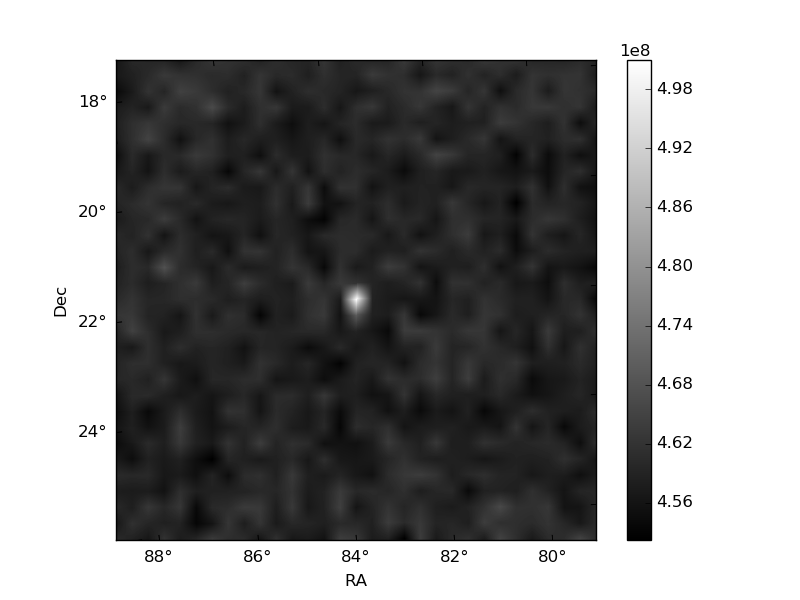
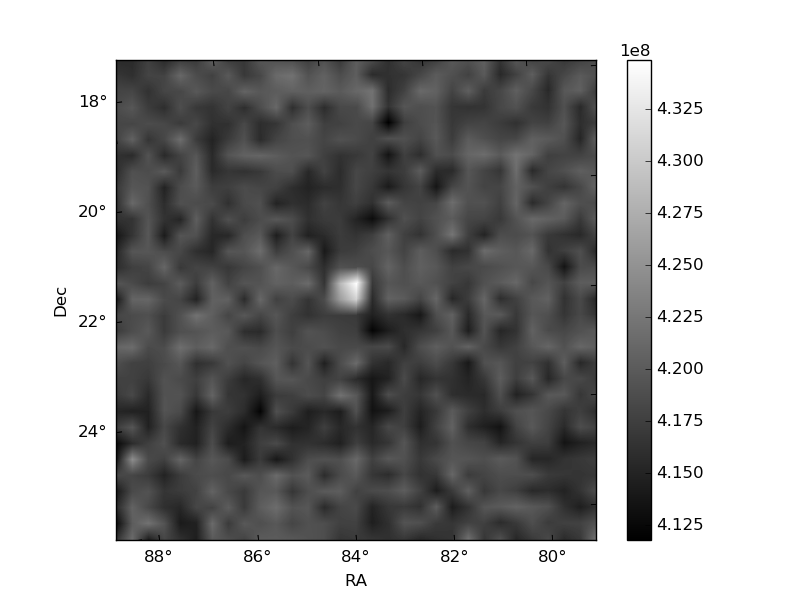
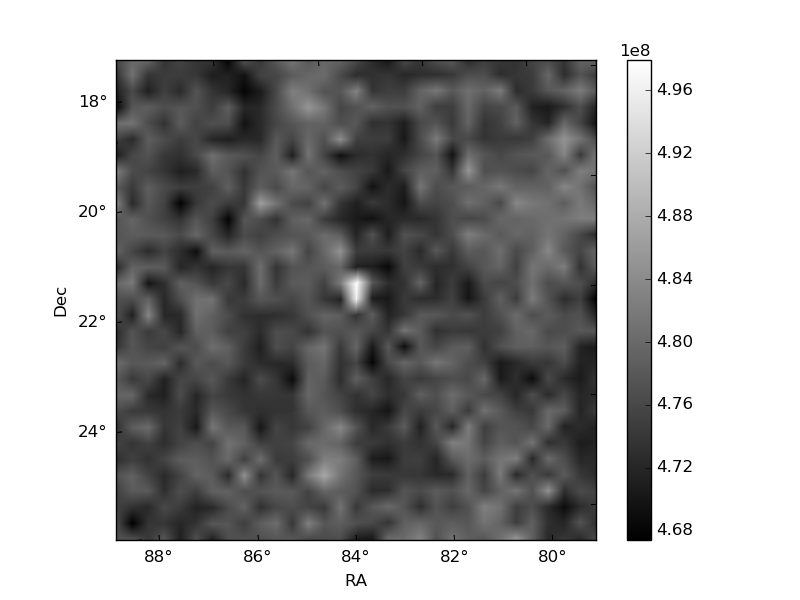
Histogram calculated using DETX and DETY for each event in the final _common_clean file
| Quadrant A | 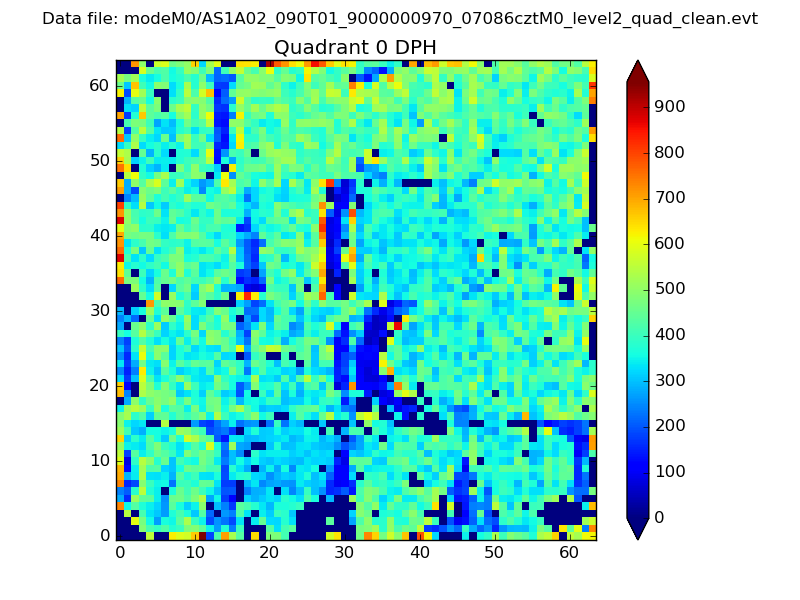 |
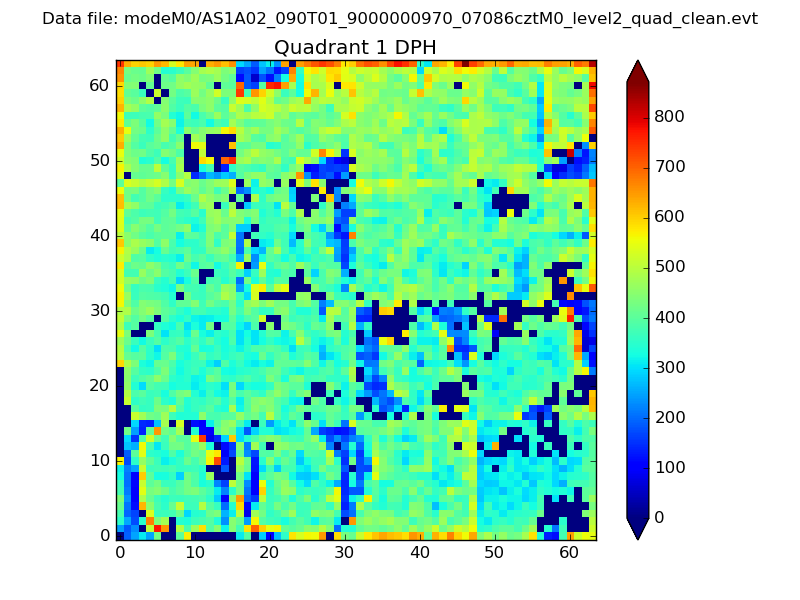 |
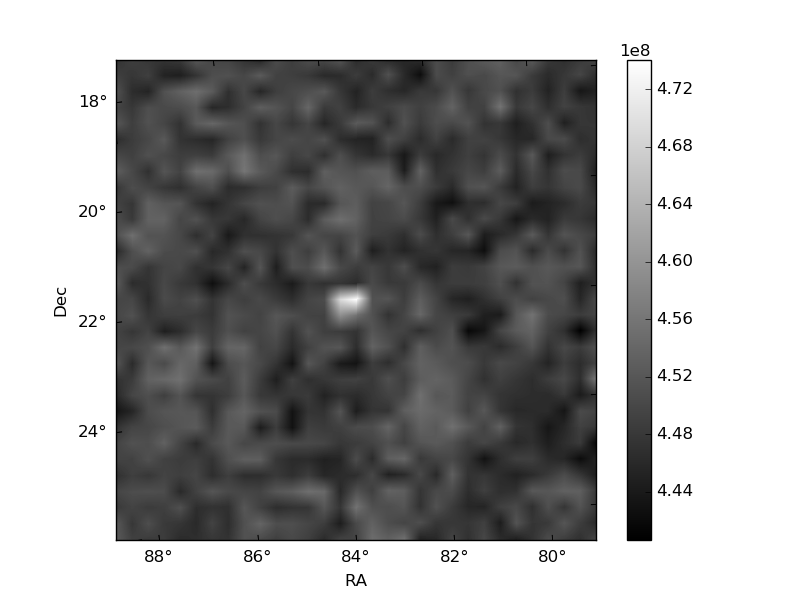
Quadrant B |
|---|---|---|---|
| Quadrant D | 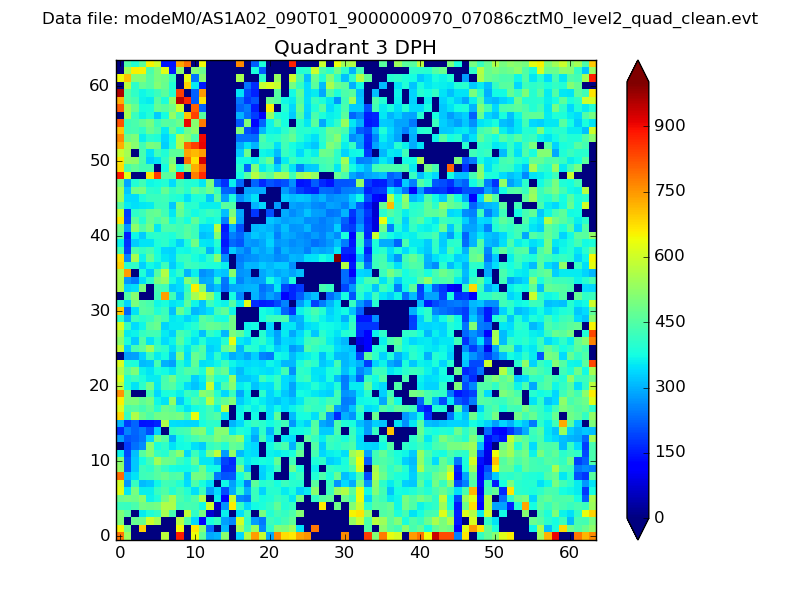 |
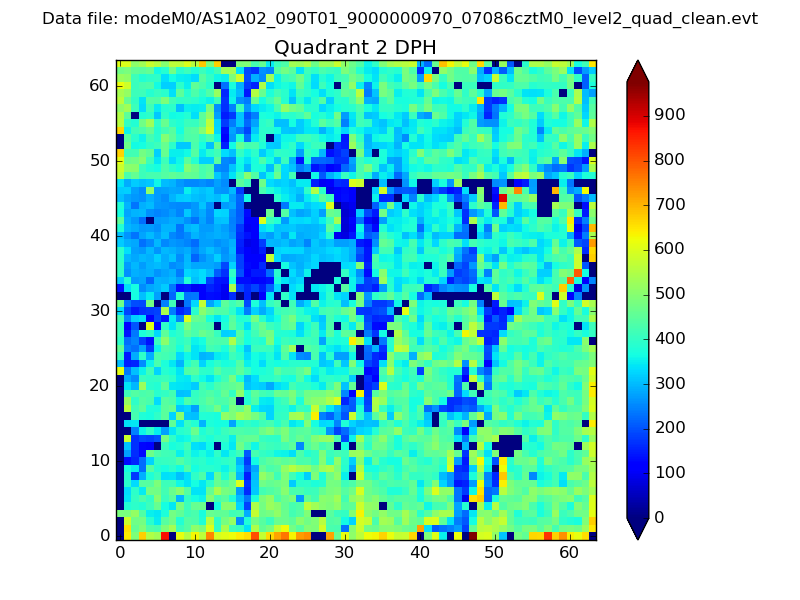 |
Quadrant C |
| Plot type | Count rate plots | Images |
|---|---|---|
| Comparison with Poisson distribution Blue bars denote a histogram of data divided into 1 sec bins. Red curve is a Poisson curve with rate = median count rate of data. |
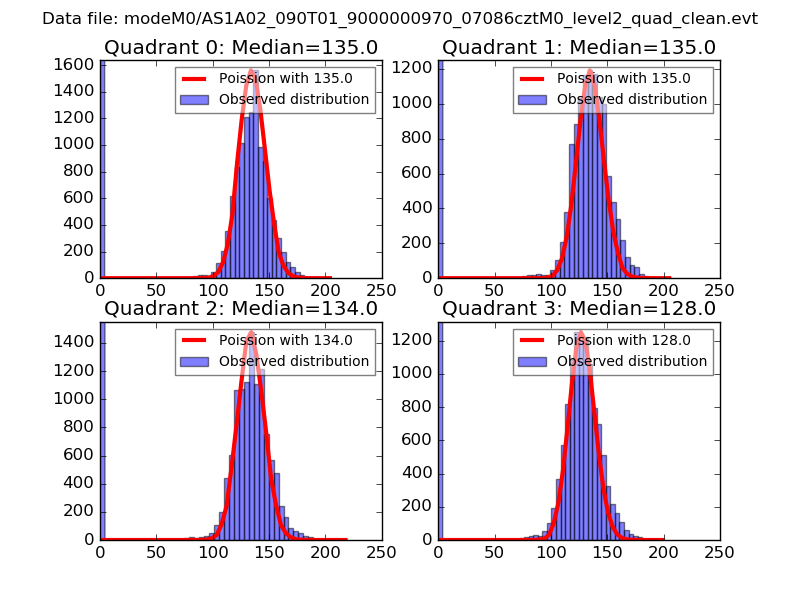 |
 |
| Quadrant-wise count rates Data is divided into 100 sec bins |
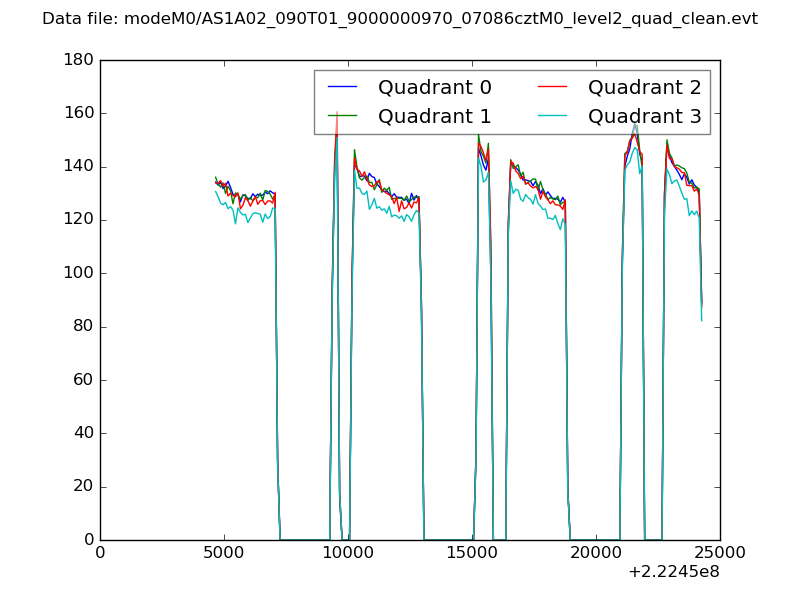 |
|
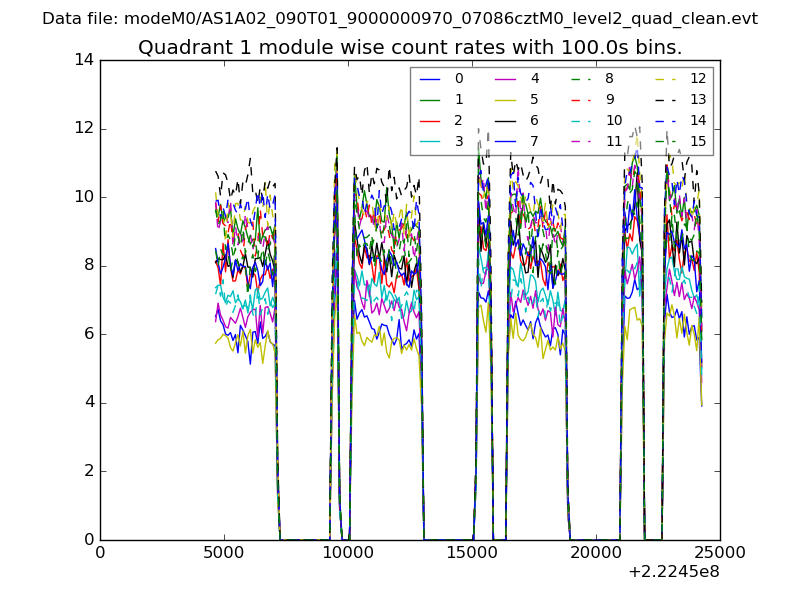
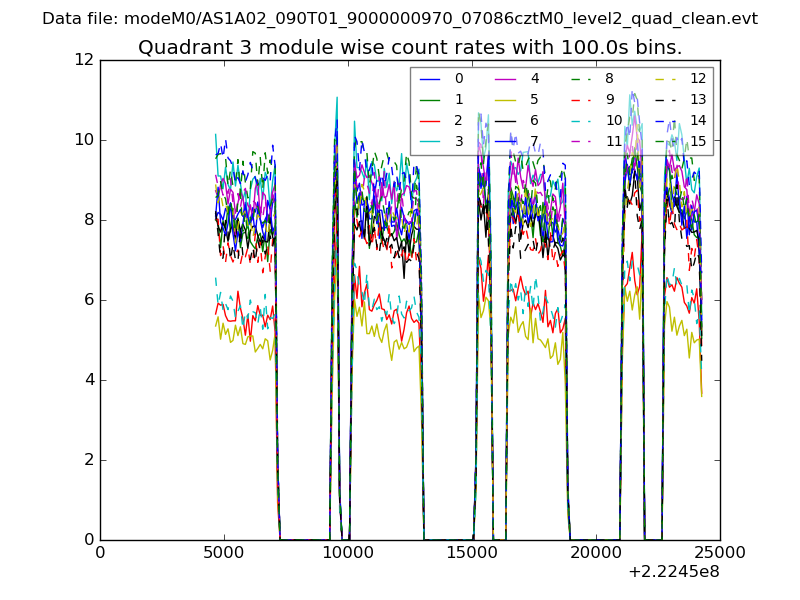
| Module-wise count rates for Quadrant A Data is divided into 100 sec bins |
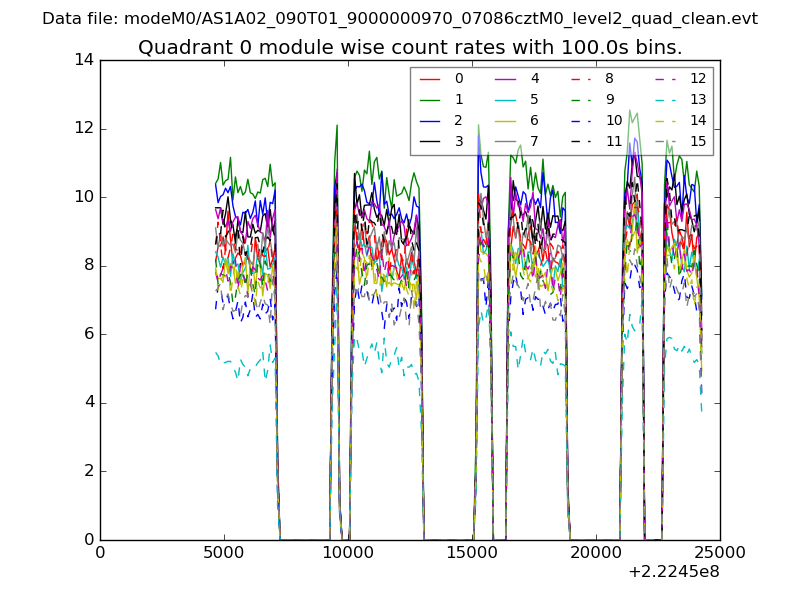 |
 |
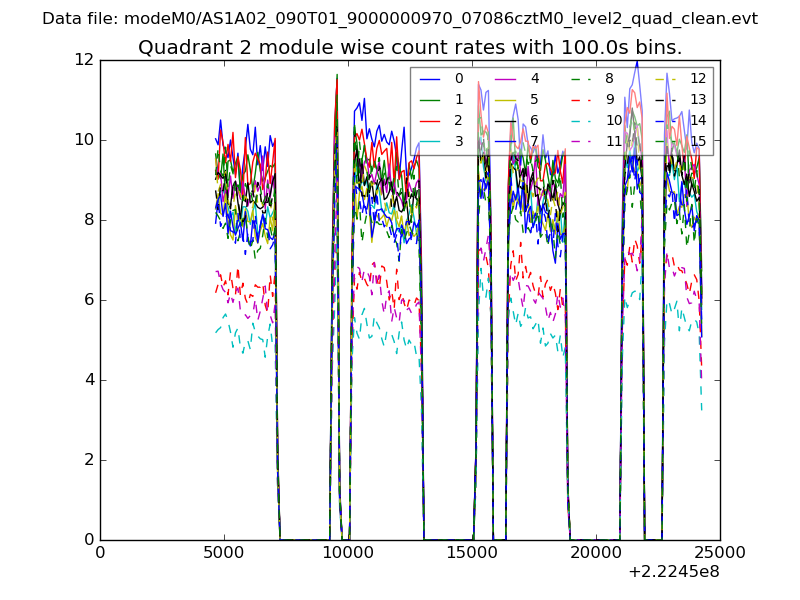
| Module-wise count rates for Quadrant B Data is divided into 100 sec bins |
 |
 |
| Module-wise count rates for Quadrant C Data is divided into 100 sec bins |
 |
 |
| Module-wise count rates for Quadrant D Data is divided into 100 sec bins |
 |
 |
| Parameter | Plot |
|---|---|
| CZT HV Monitor | 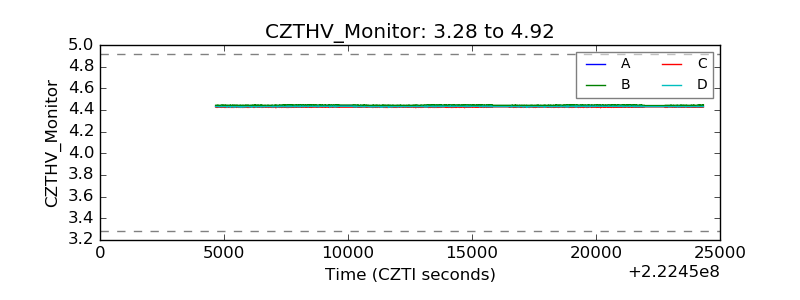 |
| D_VDD | 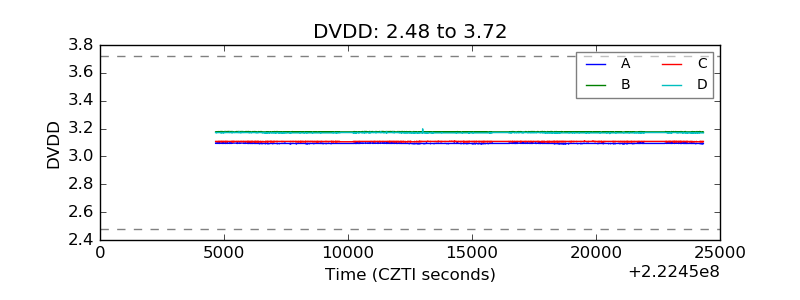 |
| Temperature 1 | 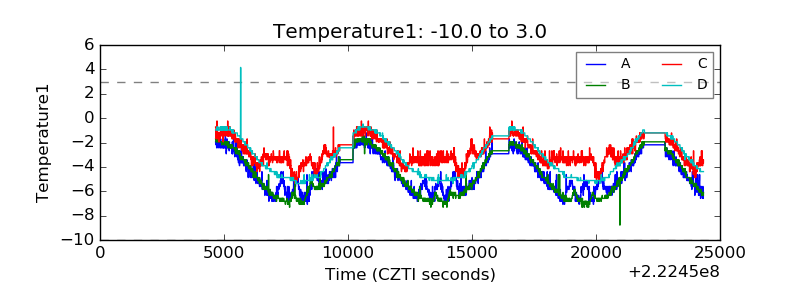 |
| Veto HV Monitor | 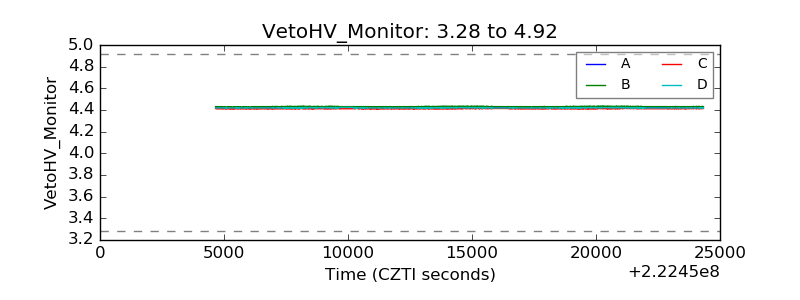 |
| Veto LLD | 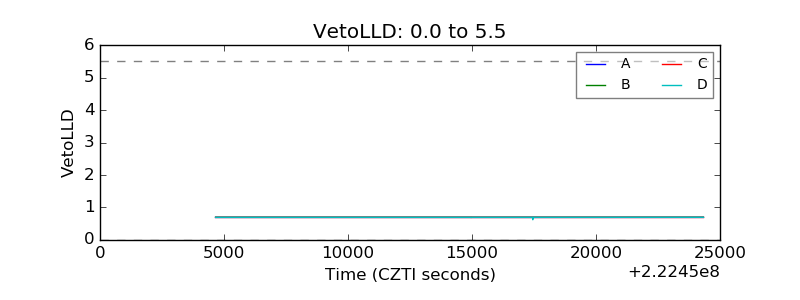 |
| Alpha Counter | 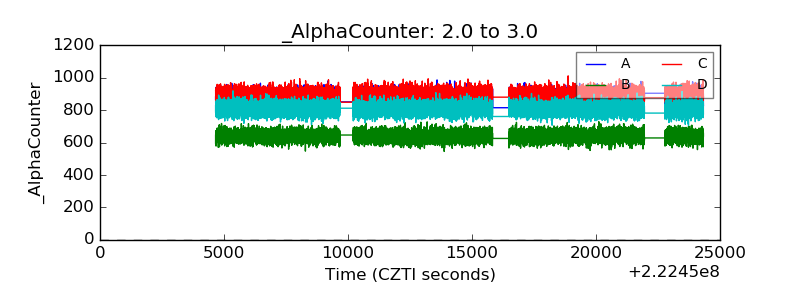 |
| _CPM_Rate | 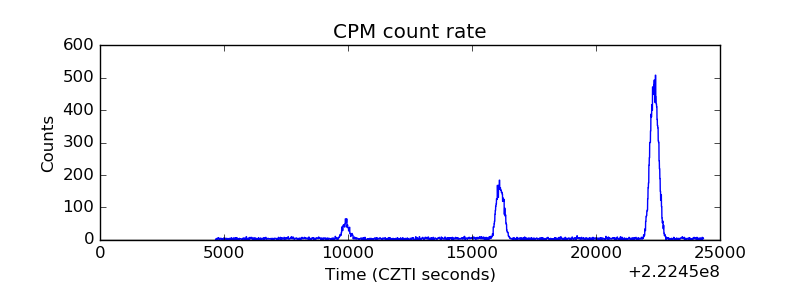 |
| CZT Counter | 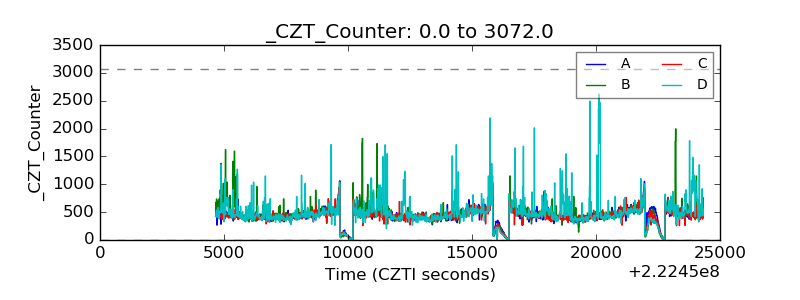 |
| +2.5 Volts monitor |  |
| +5 Volts monitor |  |
| _ROLL_ROT | 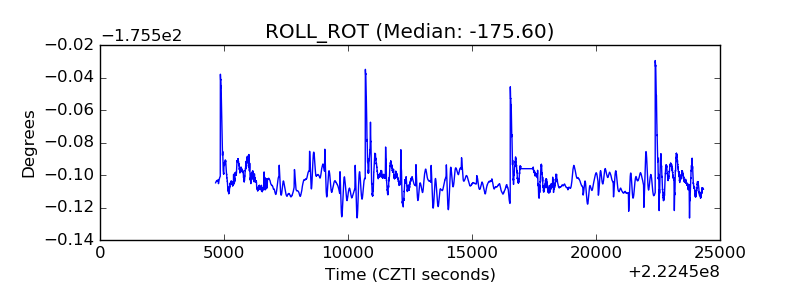 |
| _Roll_DEC | 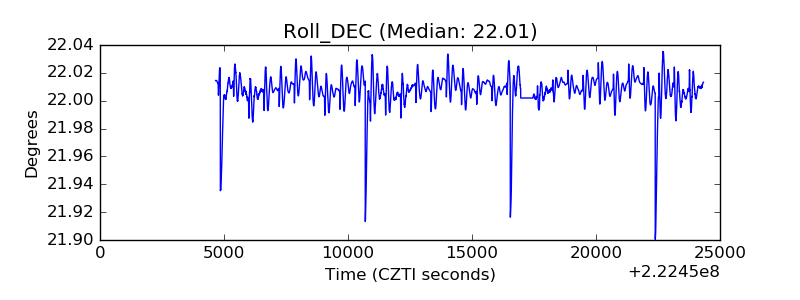 |
| _Roll_RA | 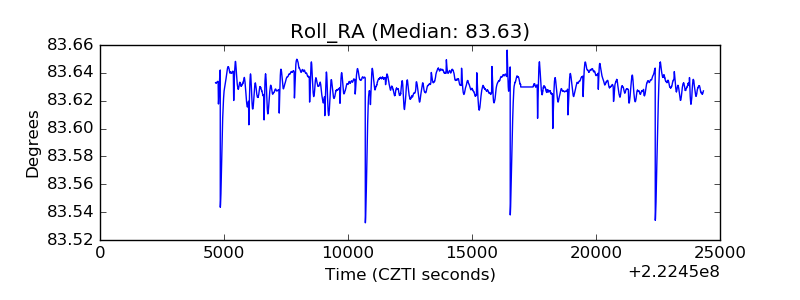 |
| Veto Counter | 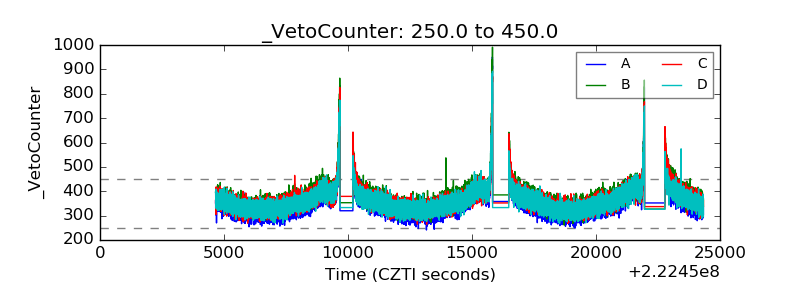 |