| Param | Original file | Final file |
|---|---|---|
| Filename | modeM0/AS1A02_090T01_9000000970_07087cztM0_level2.evt | modeM0/AS1A02_090T01_9000000970_07087cztM0_level2_quad_clean.evt |
| Size (bytes) | 389,666,880 | 81,659,520 |
| Size | 371.6 MB | 77.9 MB |
| Events in quadrant A | 2,760,105 | 522,576 |
| Events in quadrant B | 2,925,446 | 526,176 |
| Events in quadrant C | 2,680,512 | 519,746 |
| Events in quadrant D | 3,032,799 | 491,381 |
| Mode M0 | |||
|---|---|---|---|
| Quadrant | BADHDUFLAG | Total packets | Discarded packets |
| A | 0 | 12215 | 2 |
| B | 0 | 12644 | 1 |
| C | 0 | 11994 | 1 |
| D | 0 | 13190 | 1 |
| Mode M9 | |||
|---|---|---|---|
| Quadrant | BADHDUFLAG | Total packets | Discarded packets |
| A | 0 | 10 | 0 |
| B | 0 | 10 | 0 |
| C | 0 | 10 | 0 |
| D | 0 | 10 | 0 |
| Mode SS | |||
|---|---|---|---|
| Quadrant | BADHDUFLAG | Total packets | Discarded packets |
| A | 0 | 120 | 0 |
| B | 0 | 120 | 0 |
| C | 0 | 120 | 0 |
| D | 0 | 120 | 0 |
| Quadrant | Total seconds | Saturated seconds | Saturation percentage |
|---|---|---|---|
| A | 5910 | 24 | 0.406091% |
| B | 5910 | 36 | 0.609137% |
| C | 5910 | 9 | 0.152284% |
| D | 5910 | 40 | 0.676819% |
Noise dominated data is calculated using 1-second bins in cleaned event files. If a bin has >2000 counts, and if more than 50% of those come from <1% of pixels, then it is considered to be noise-dominated and hence unusable.
| Quadrant | # 1 sec bins | Bins with >0 counts | Bins with >2000 counts | High rate bins dominated by noise | Noise dominated (total time) | Noise dominated (detector-on time) | Marked lightcurve |
|---|---|---|---|---|---|---|---|
| A | 6905 | 5911 | 8 | 8 | 0.12% | 0.14% | 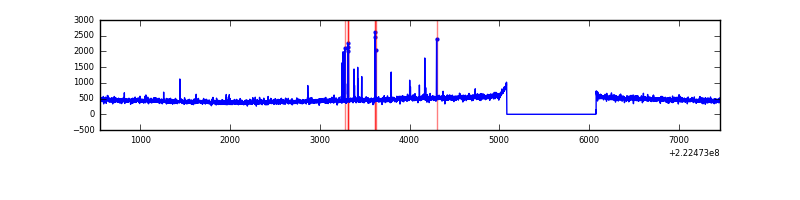 |
| B | 6905 | 5911 | 7 | 7 | 0.10% | 0.12% | 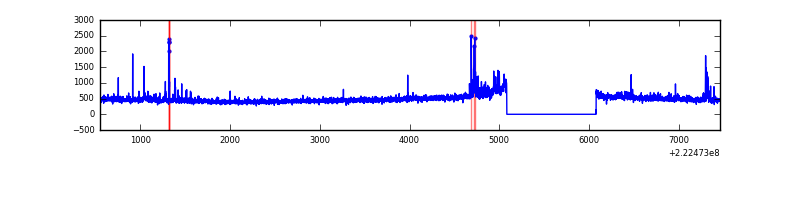 |
| C | 6905 | 5911 | 1 | 1 | 0.01% | 0.02% | 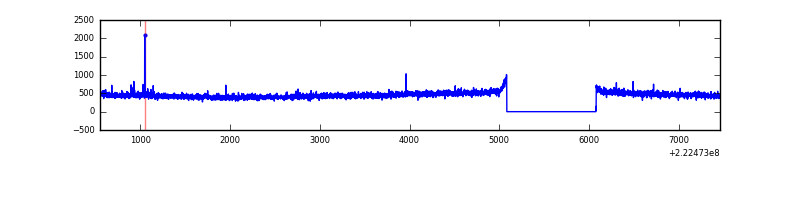 |
| D | 6905 | 5911 | 35 | 35 | 0.51% | 0.59% | 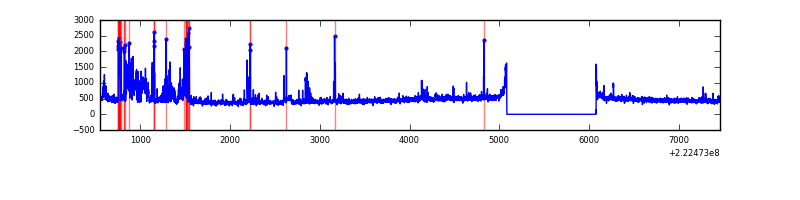 |
Top three noisy pixels from each quadrant. If the there are fewer than three noisy pixels in the level2.evt file, extra rows are filled as -1
| Pixel properties | Quadrant properties | ||||||
|---|---|---|---|---|---|---|---|
| Quadrant | DetID | PixID | Counts | Sigma | Mean | Median | Sigma |
| A | 0 | 23 | 56750 | 387.06 | 697 | 683 | 144.9 |
| A | 13 | 248 | 10739 | 69.42 | 697 | 683 | 144.9 |
| A | 0 | 226 | 10238 | 65.96 | 697 | 683 | 144.9 |
| B | 0 | 219 | 107589 | 782.79 | 705 | 690 | 136.6 |
| B | 0 | 214 | 71744 | 520.31 | 705 | 690 | 136.6 |
| B | 12 | 111 | 13631 | 94.76 | 705 | 690 | 136.6 |
| C | 10 | 22 | 7578 | 43.46 | 682 | 688 | 158.5 |
| C | 13 | 61 | 5194 | 28.42 | 682 | 688 | 158.5 |
| C | 14 | 67 | 5075 | 27.67 | 682 | 688 | 158.5 |
| D | 1 | 83 | 277360 | 1649.8 | 677 | 657 | 167.7 |
| D | 12 | 233 | 86883 | 514.11 | 677 | 657 | 167.7 |
| D | 2 | 14 | 43071 | 252.89 | 677 | 657 | 167.7 |
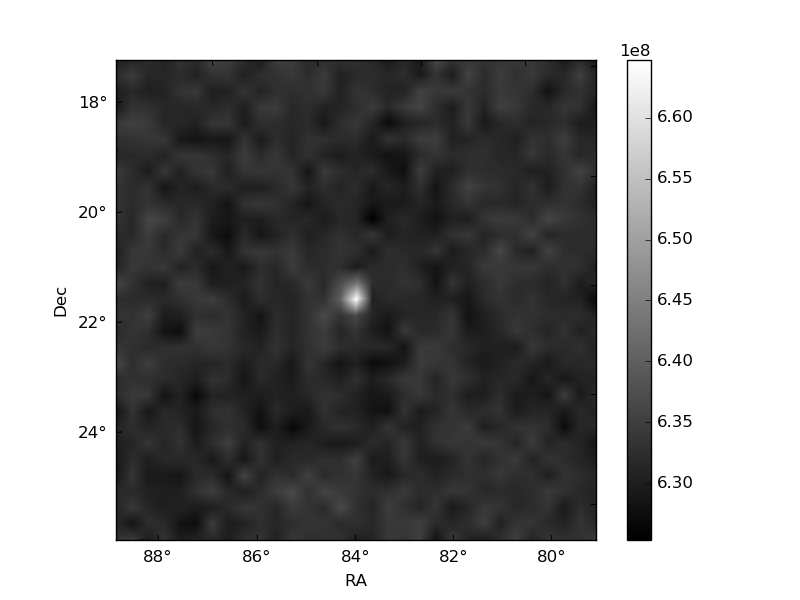
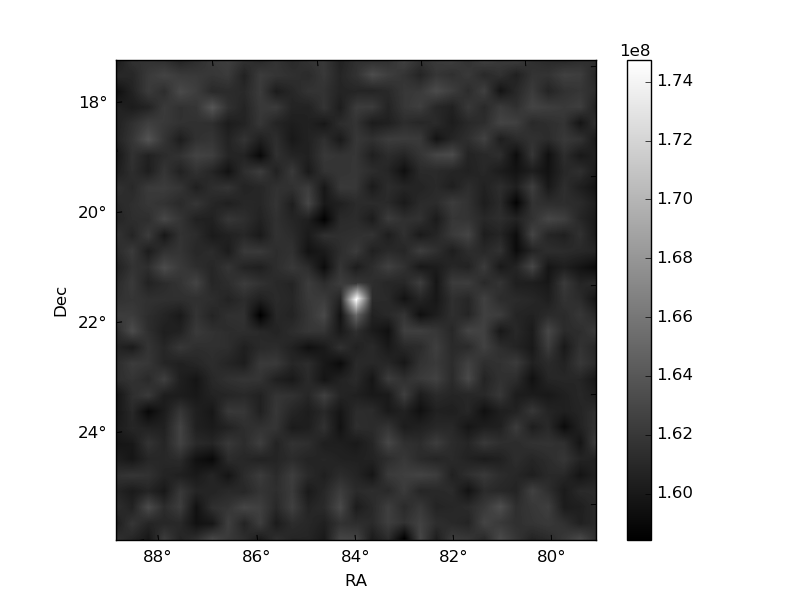
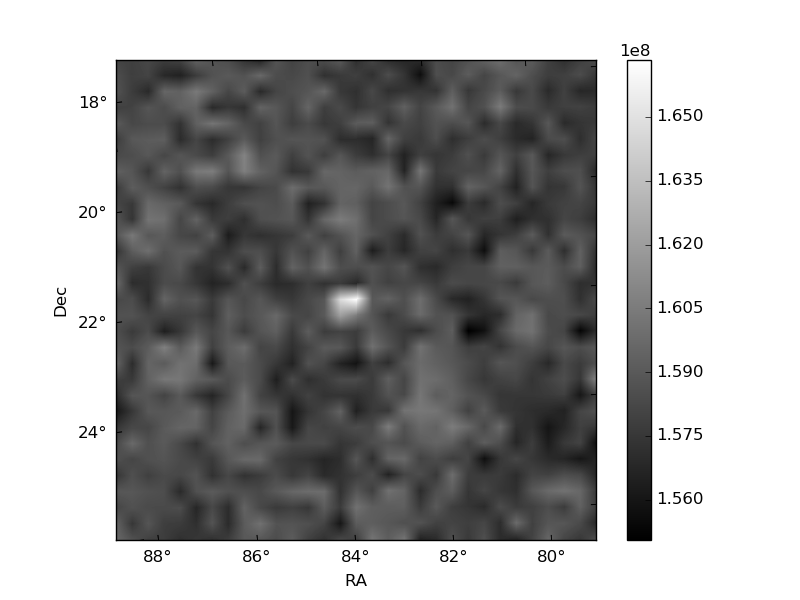
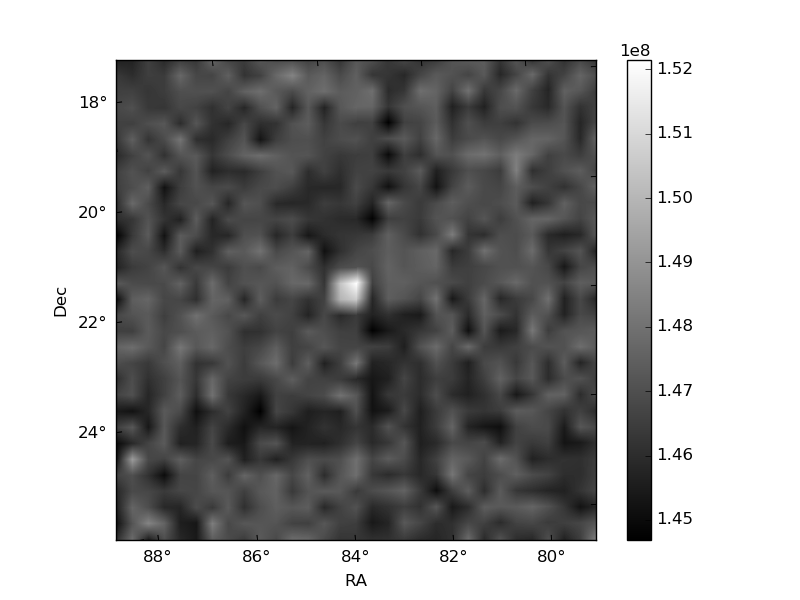
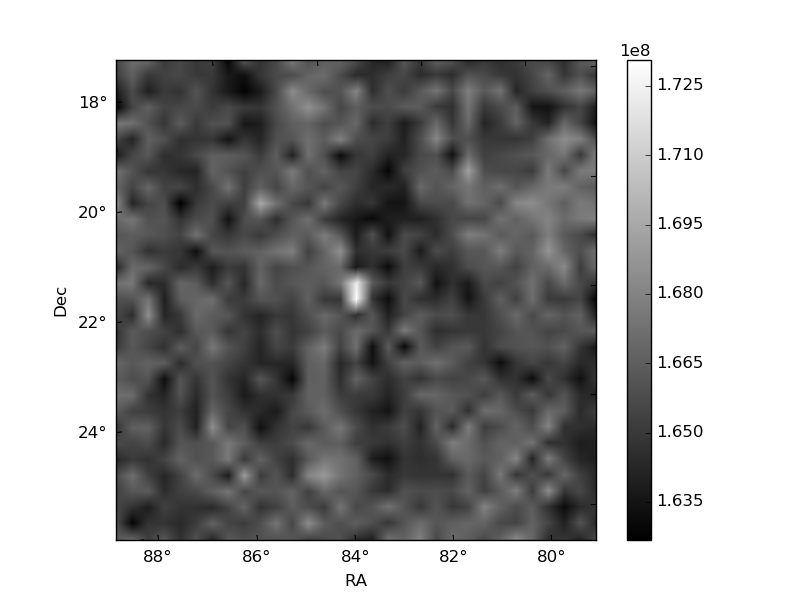
Histogram calculated using DETX and DETY for each event in the final _common_clean file
| Quadrant A | 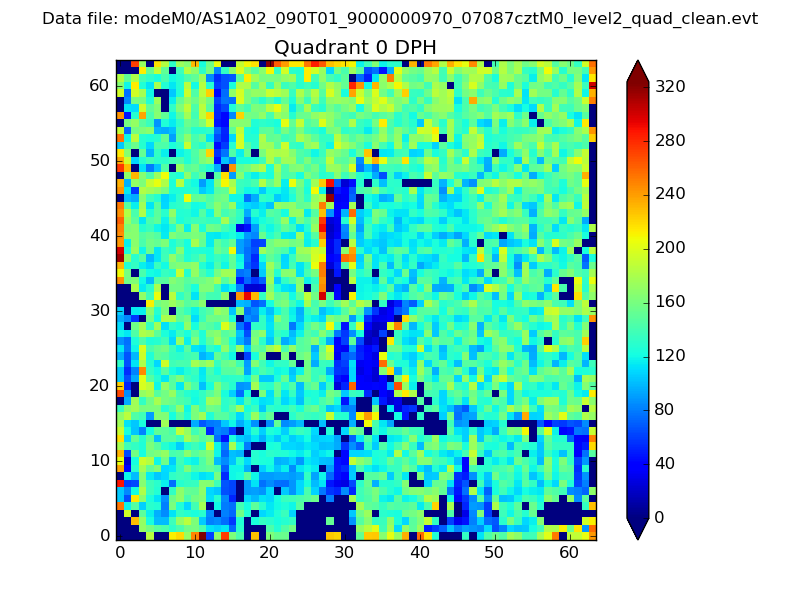 |
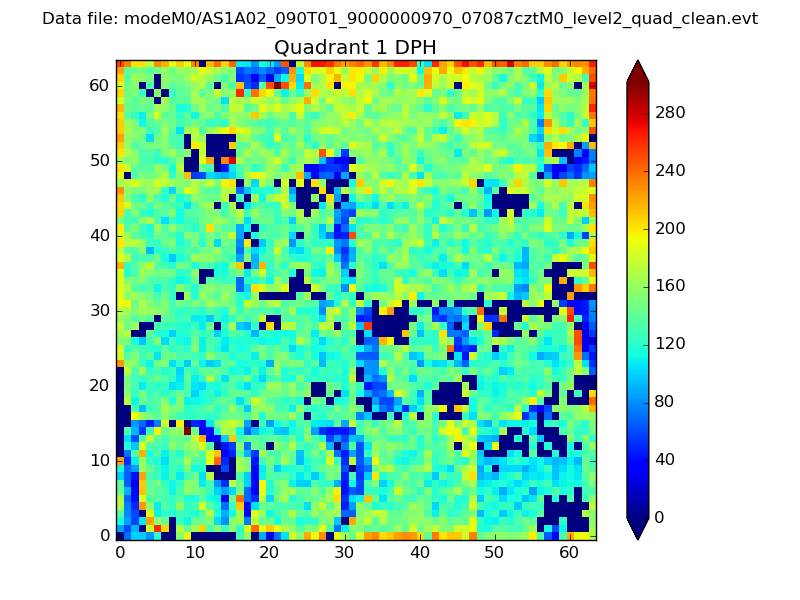 |
Quadrant B |
|---|---|---|---|
| Quadrant D | 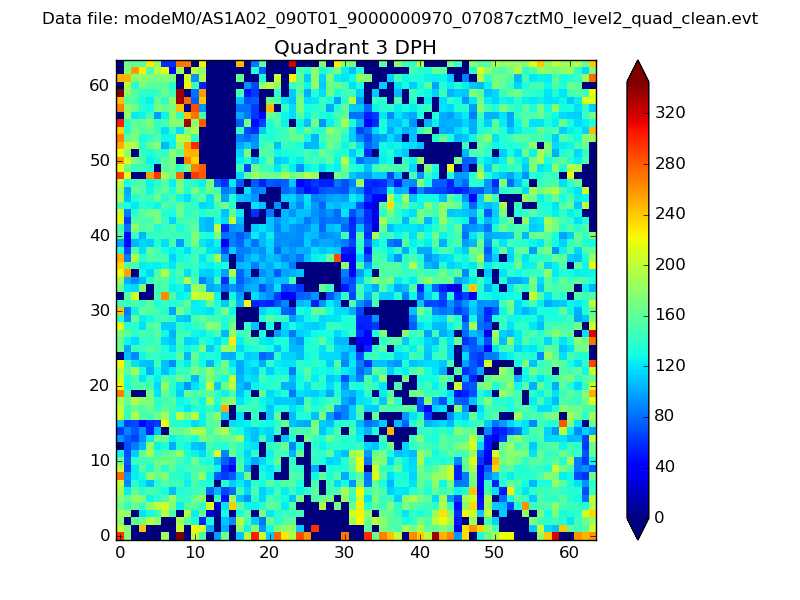 |
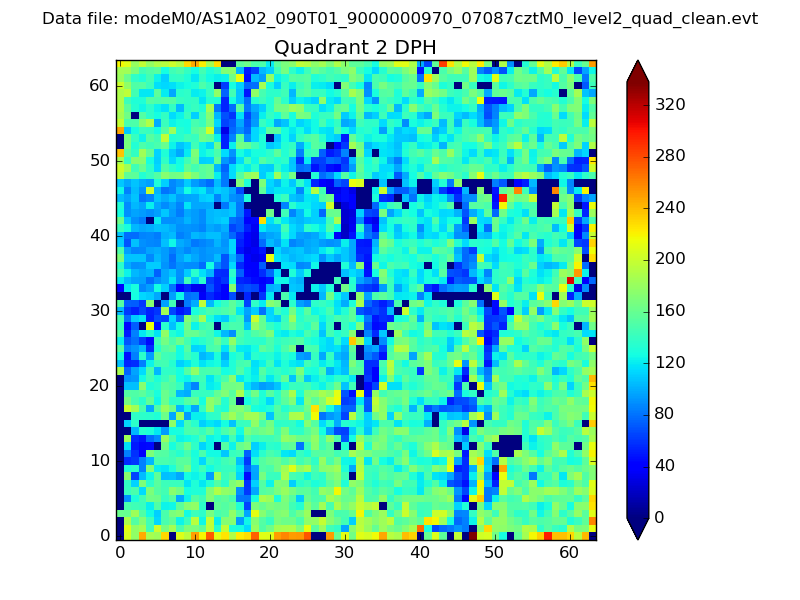 |
Quadrant C |
| Plot type | Count rate plots | Images |
|---|---|---|
| Comparison with Poisson distribution Blue bars denote a histogram of data divided into 1 sec bins. Red curve is a Poisson curve with rate = median count rate of data. |
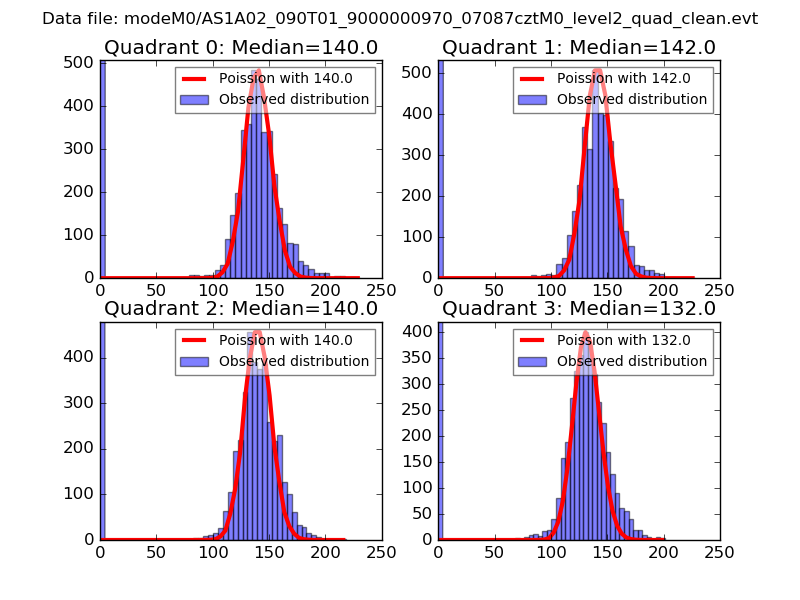 |
 |
| Quadrant-wise count rates Data is divided into 100 sec bins |
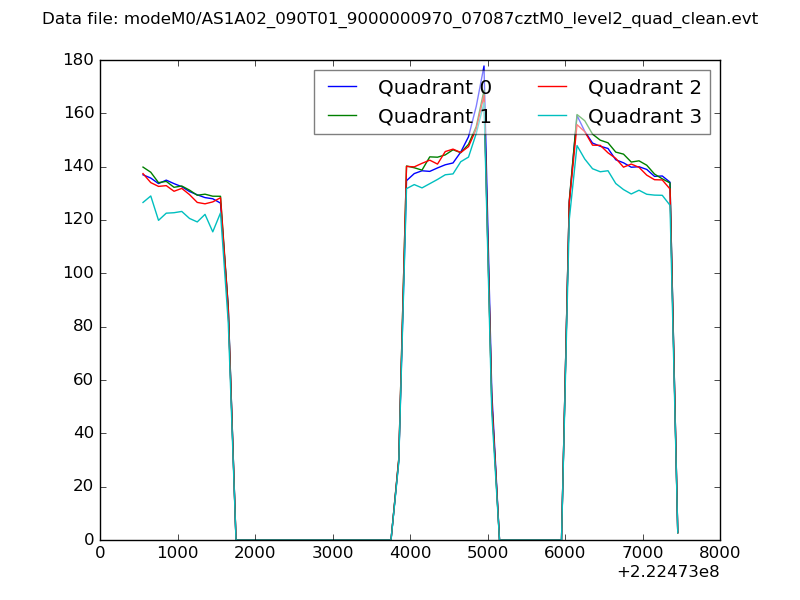 |
|
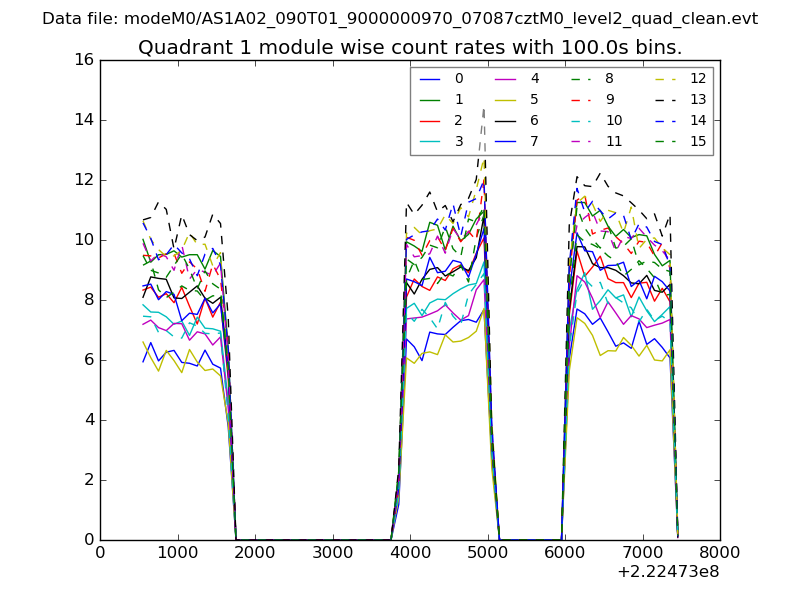
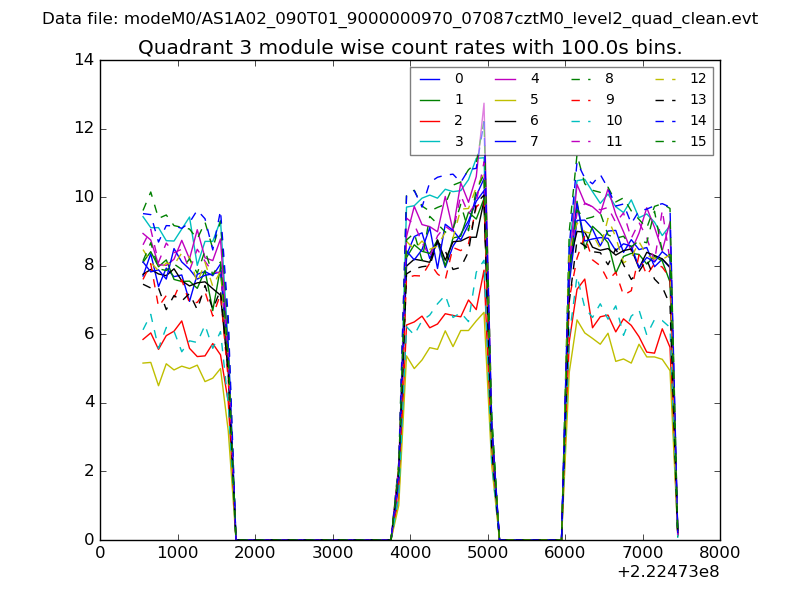
| Module-wise count rates for Quadrant A Data is divided into 100 sec bins |
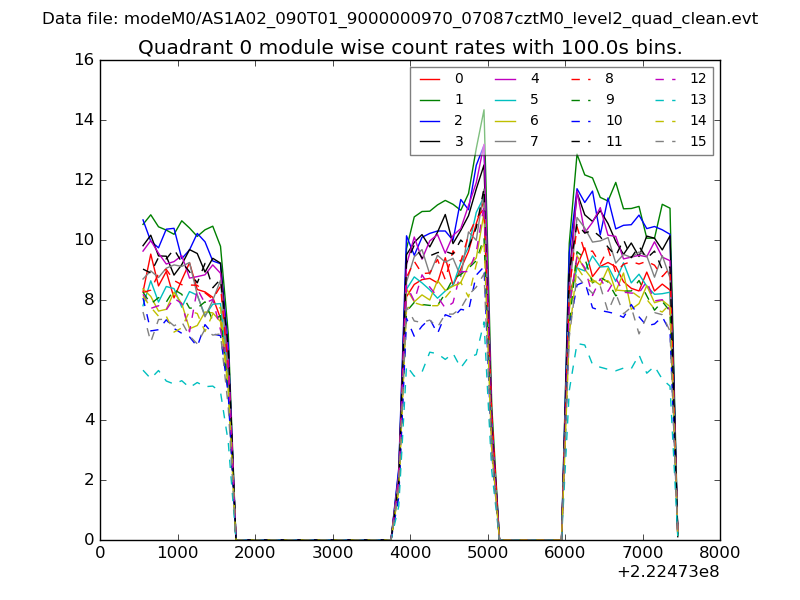 |
 |
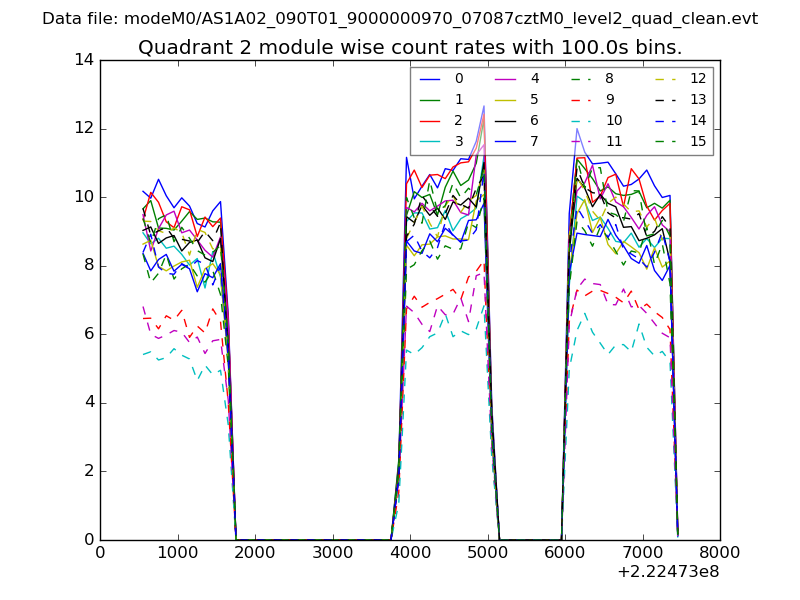
| Module-wise count rates for Quadrant B Data is divided into 100 sec bins |
 |
 |
| Module-wise count rates for Quadrant C Data is divided into 100 sec bins |
 |
 |
| Module-wise count rates for Quadrant D Data is divided into 100 sec bins |
 |
 |
| Parameter | Plot |
|---|---|
| CZT HV Monitor | 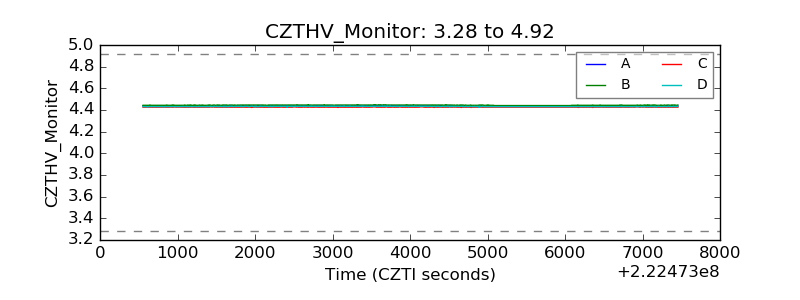 |
| D_VDD | 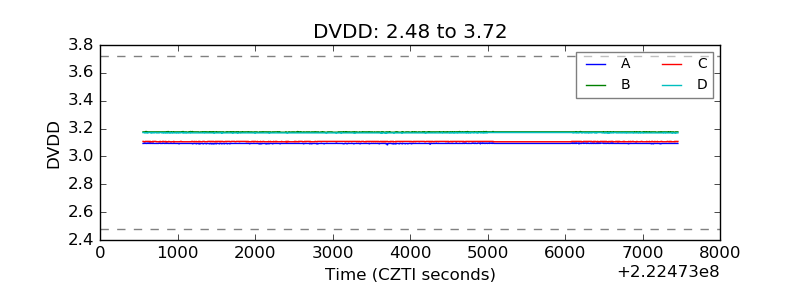 |
| Temperature 1 | 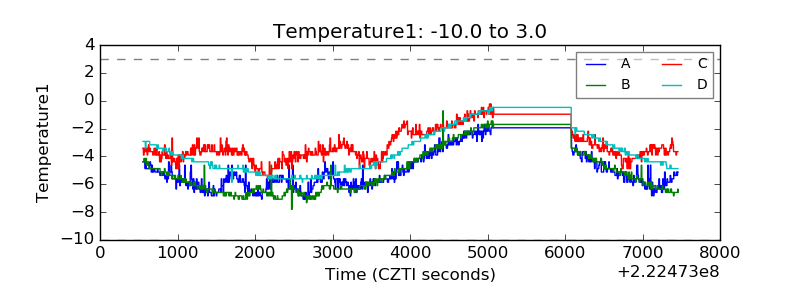 |
| Veto HV Monitor | 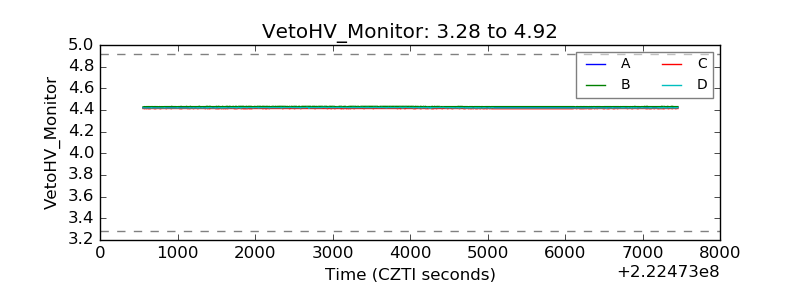 |
| Veto LLD | 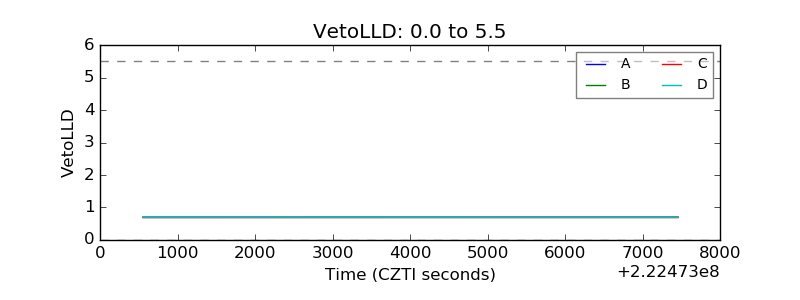 |
| Alpha Counter | 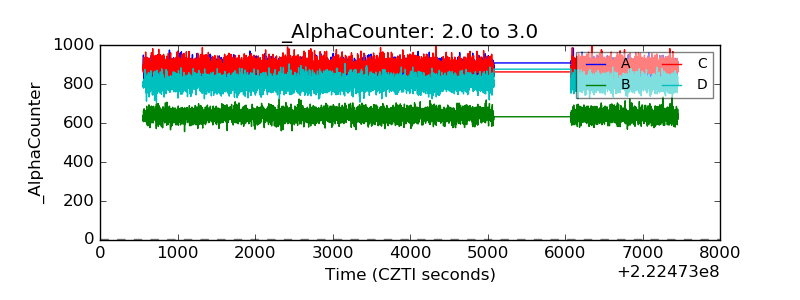 |
| _CPM_Rate | 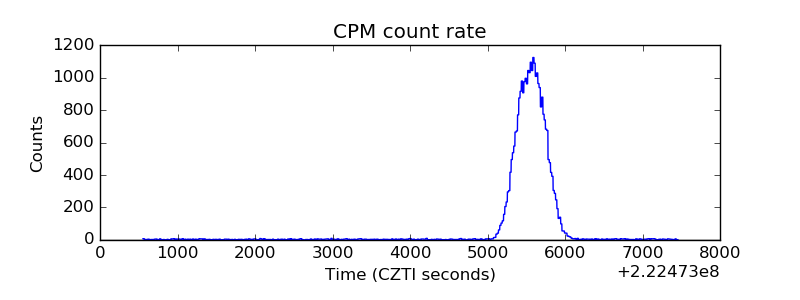 |
| CZT Counter | 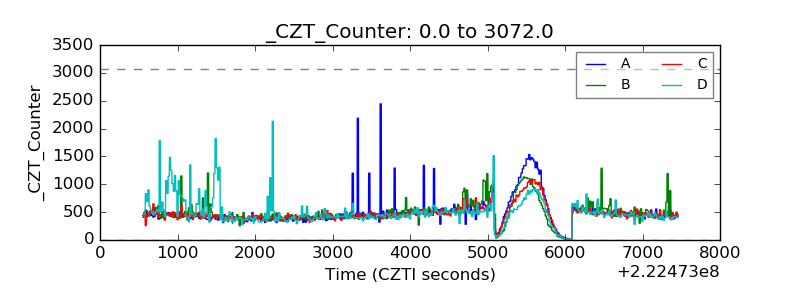 |
| +2.5 Volts monitor |  |
| +5 Volts monitor |  |
| _ROLL_ROT | 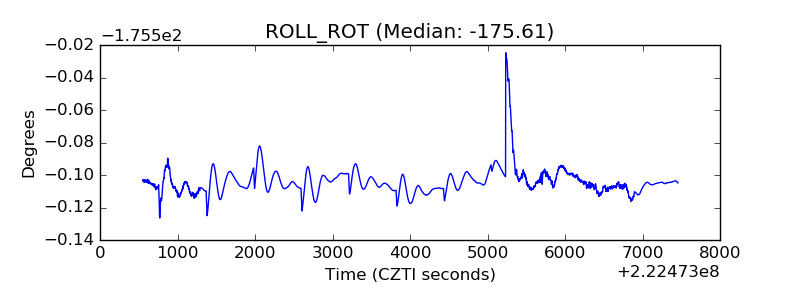 |
| _Roll_DEC | 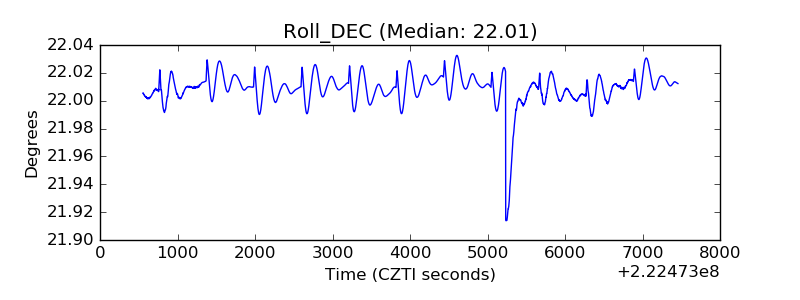 |
| _Roll_RA | 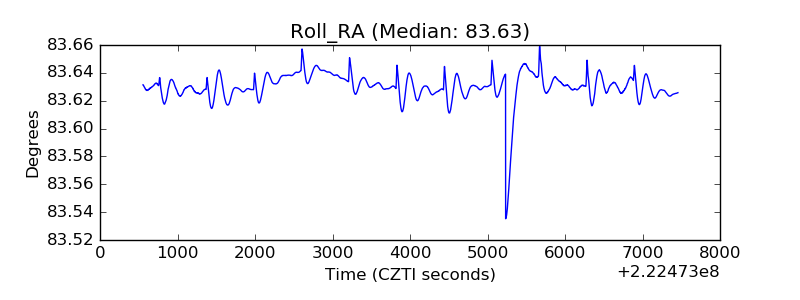 |
| Veto Counter | 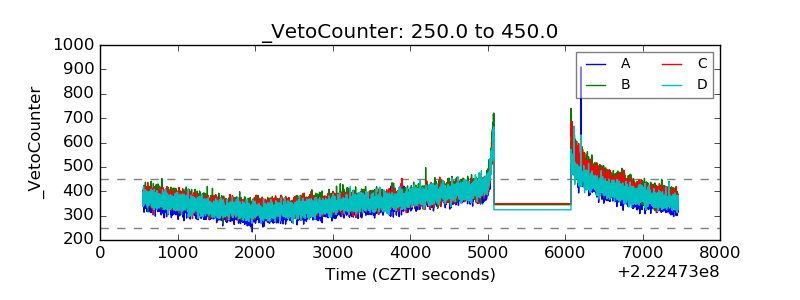 |