| Param | Original file | Final file |
|---|---|---|
| Filename | modeM0/AS1A02_090T01_9000000970_07090cztM0_level2.evt | modeM0/AS1A02_090T01_9000000970_07090cztM0_level2_quad_clean.evt |
| Size (bytes) | 374,523,840 | 72,581,760 |
| Size | 357.2 MB | 69.2 MB |
| Events in quadrant A | 2,704,464 | 454,389 |
| Events in quadrant B | 2,948,087 | 462,533 |
| Events in quadrant C | 2,716,167 | 452,237 |
| Events in quadrant D | 2,583,688 | 428,118 |
| Mode M0 | |||
|---|---|---|---|
| Quadrant | BADHDUFLAG | Total packets | Discarded packets |
| A | 0 | 11718 | 2 |
| B | 0 | 12426 | 1 |
| C | 0 | 11790 | 1 |
| D | 0 | 11696 | 1 |
| Mode M9 | |||
|---|---|---|---|
| Quadrant | BADHDUFLAG | Total packets | Discarded packets |
| A | 0 | 13 | 0 |
| B | 0 | 13 | 0 |
| C | 0 | 13 | 0 |
| D | 0 | 13 | 0 |
| Mode SS | |||
|---|---|---|---|
| Quadrant | BADHDUFLAG | Total packets | Discarded packets |
| A | 0 | 114 | 0 |
| B | 0 | 114 | 0 |
| C | 0 | 114 | 0 |
| D | 0 | 114 | 0 |
| Quadrant | Total seconds | Saturated seconds | Saturation percentage |
|---|---|---|---|
| A | 5737 | 5 | 0.087154% |
| B | 5737 | 38 | 0.662367% |
| C | 5737 | 15 | 0.261461% |
| D | 5737 | 7 | 0.122015% |
Noise dominated data is calculated using 1-second bins in cleaned event files. If a bin has >2000 counts, and if more than 50% of those come from <1% of pixels, then it is considered to be noise-dominated and hence unusable.
| Quadrant | # 1 sec bins | Bins with >0 counts | Bins with >2000 counts | High rate bins dominated by noise | Noise dominated (total time) | Noise dominated (detector-on time) | Marked lightcurve |
|---|---|---|---|---|---|---|---|
| A | 6967 | 5738 | 0 | 0 | 0.00% | 0.00% | 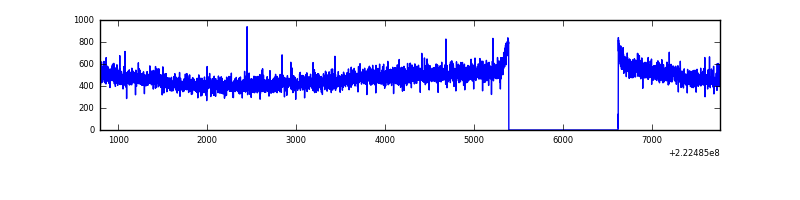 |
| B | 6967 | 5738 | 15 | 15 | 0.22% | 0.26% | 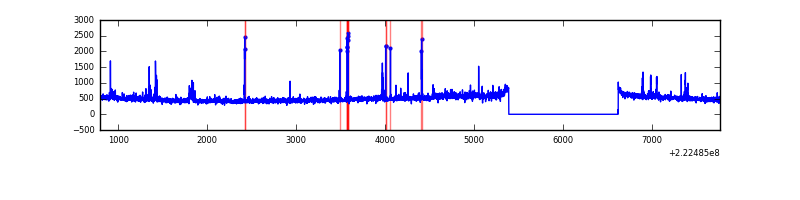 |
| C | 6967 | 5738 | 9 | 9 | 0.13% | 0.16% | 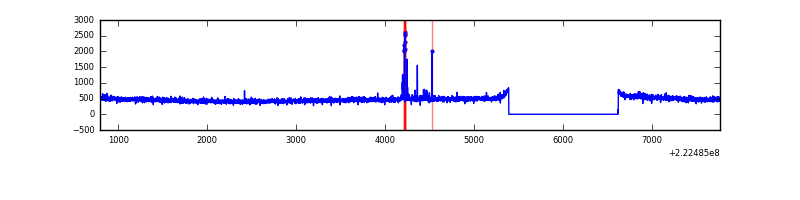 |
| D | 6967 | 5738 | 4 | 4 | 0.06% | 0.07% | 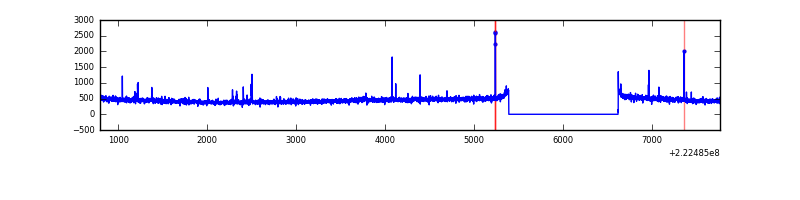 |
Top three noisy pixels from each quadrant. If the there are fewer than three noisy pixels in the level2.evt file, extra rows are filled as -1
| Pixel properties | Quadrant properties | ||||||
|---|---|---|---|---|---|---|---|
| Quadrant | DetID | PixID | Counts | Sigma | Mean | Median | Sigma |
| A | 0 | 226 | 6604 | 41.34 | 700 | 688 | 143.1 |
| A | 12 | 194 | 6383 | 39.8 | 700 | 688 | 143.1 |
| A | 8 | 15 | 4477 | 26.48 | 700 | 688 | 143.1 |
| B | 0 | 219 | 71320 | 527.27 | 710 | 694 | 133.9 |
| B | 0 | 214 | 63645 | 469.97 | 710 | 694 | 133.9 |
| B | 4 | 81 | 35190 | 257.54 | 710 | 694 | 133.9 |
| C | 10 | 22 | 34786 | 215.29 | 684 | 691 | 158.4 |
| C | 14 | 67 | 7883 | 45.41 | 684 | 691 | 158.4 |
| C | 1 | 3 | 6612 | 37.38 | 684 | 691 | 158.4 |
| D | 2 | 14 | 27811 | 161.86 | 677 | 656 | 167.8 |
| D | 5 | 184 | 10830 | 60.64 | 677 | 656 | 167.8 |
| D | 8 | 195 | 7833 | 42.78 | 677 | 656 | 167.8 |
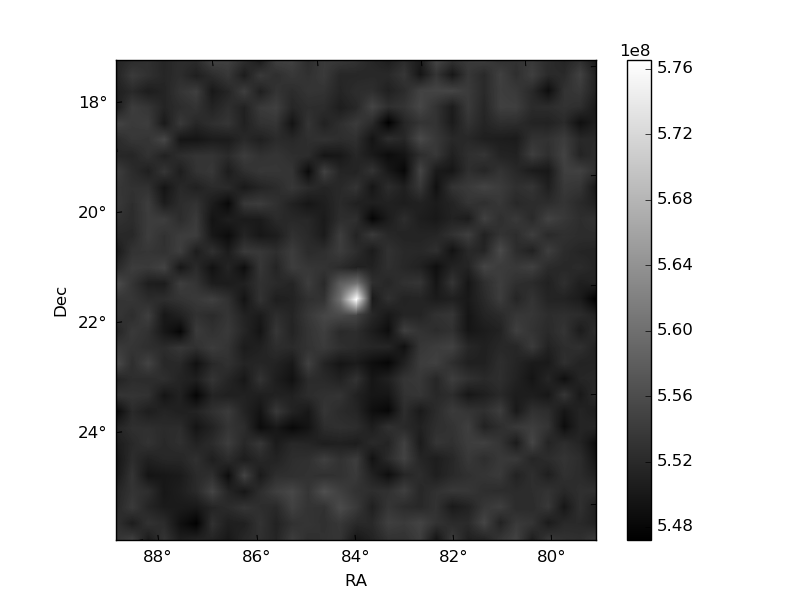
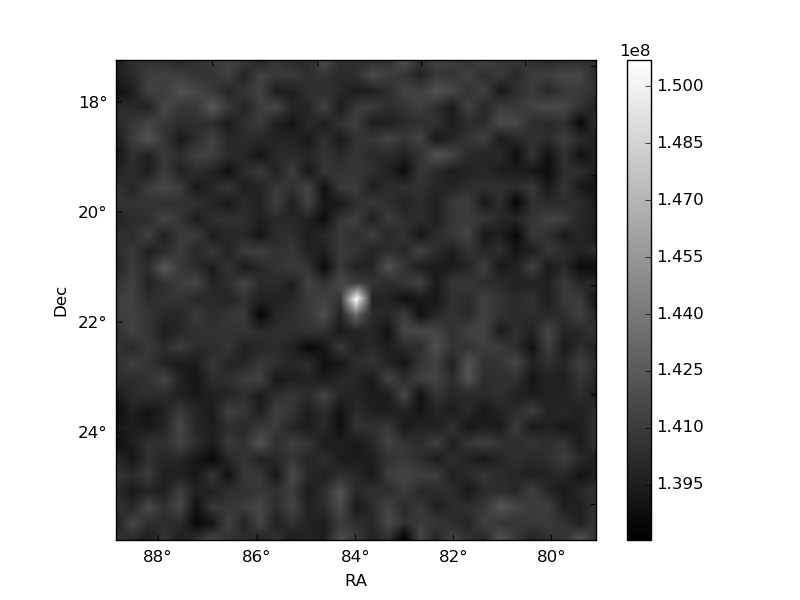
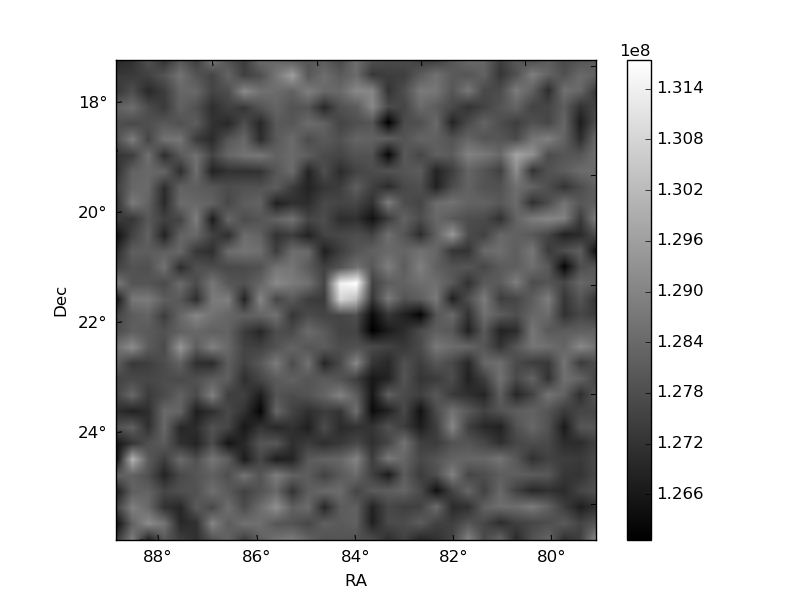
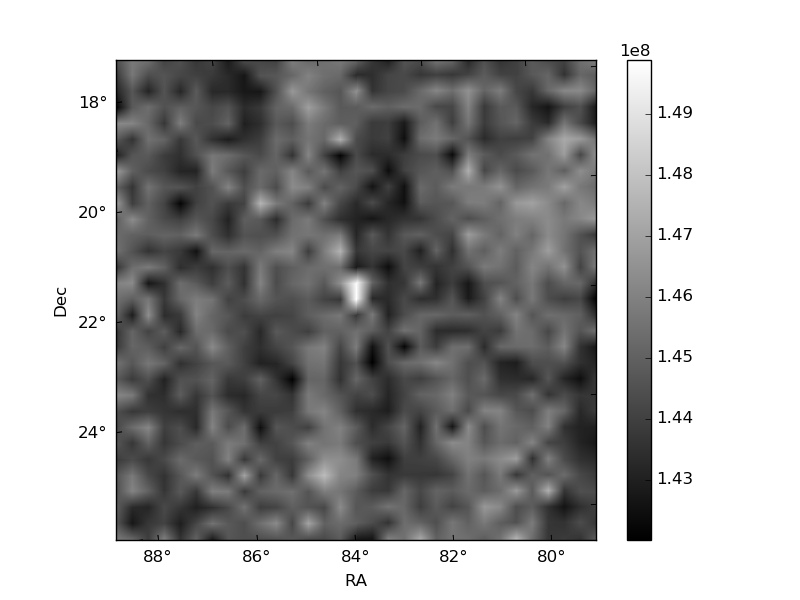
Histogram calculated using DETX and DETY for each event in the final _common_clean file
| Quadrant A | 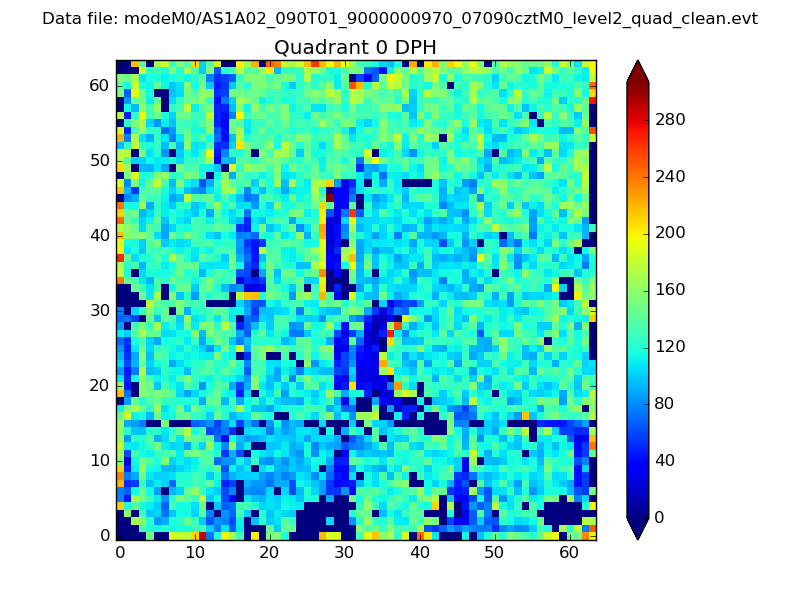 |
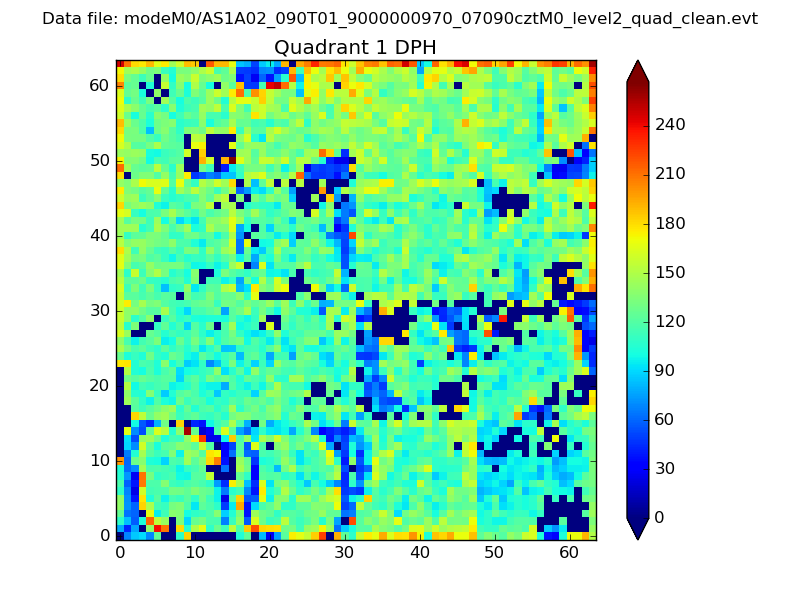 |
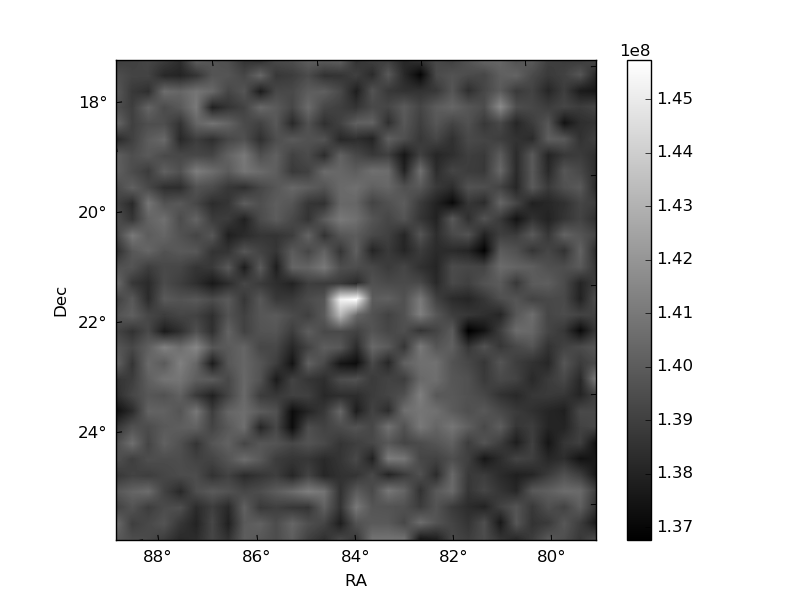
Quadrant B |
|---|---|---|---|
| Quadrant D | 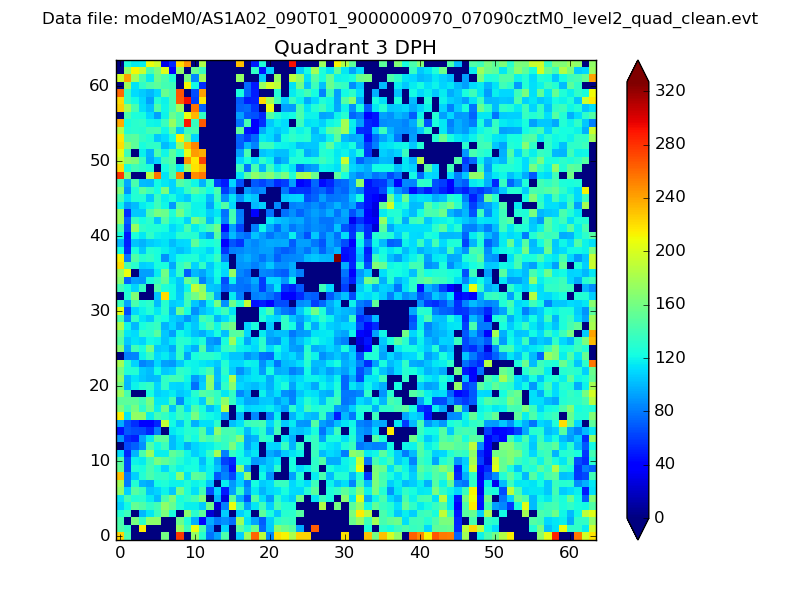 |
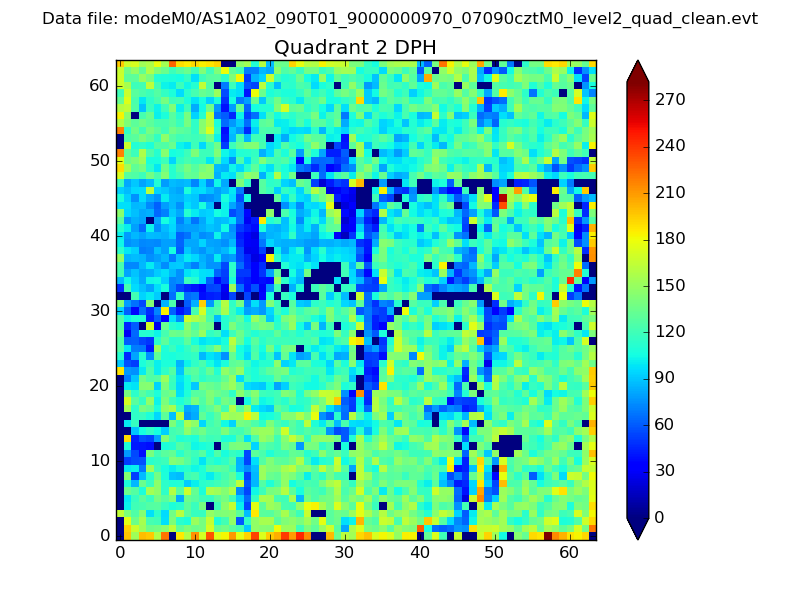 |
Quadrant C |
| Plot type | Count rate plots | Images |
|---|---|---|
| Comparison with Poisson distribution Blue bars denote a histogram of data divided into 1 sec bins. Red curve is a Poisson curve with rate = median count rate of data. |
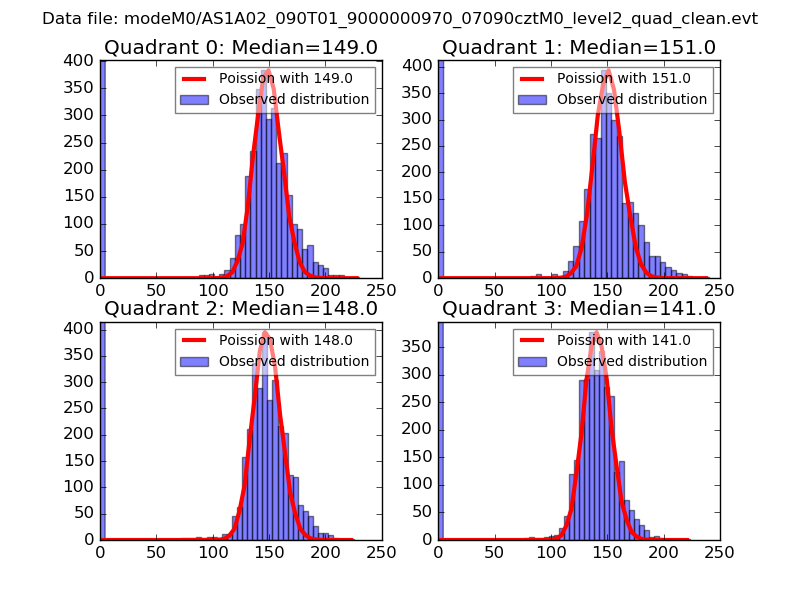 |
 |
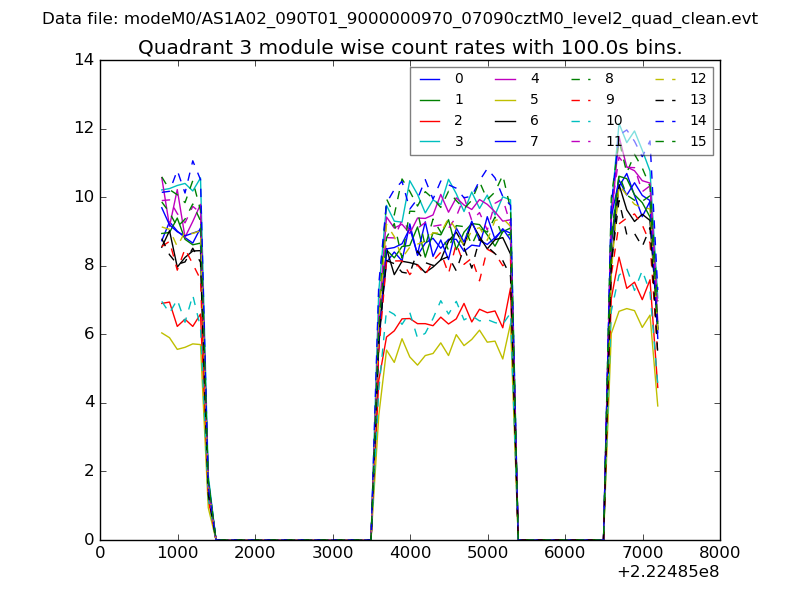
| Quadrant-wise count rates Data is divided into 100 sec bins |
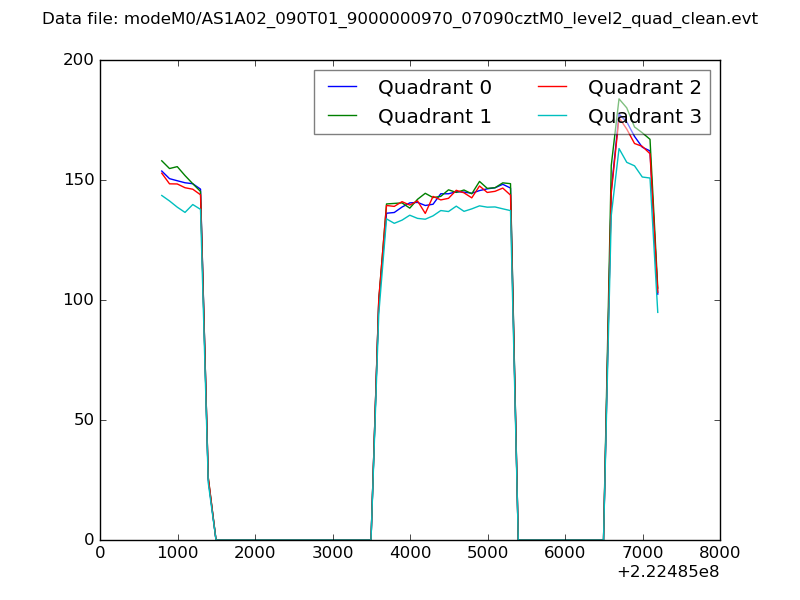 |
|
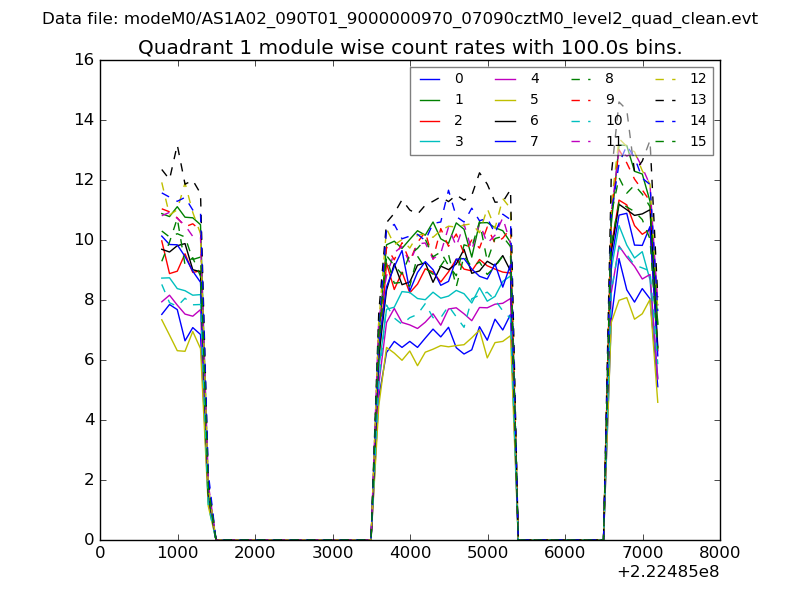
| Module-wise count rates for Quadrant A Data is divided into 100 sec bins |
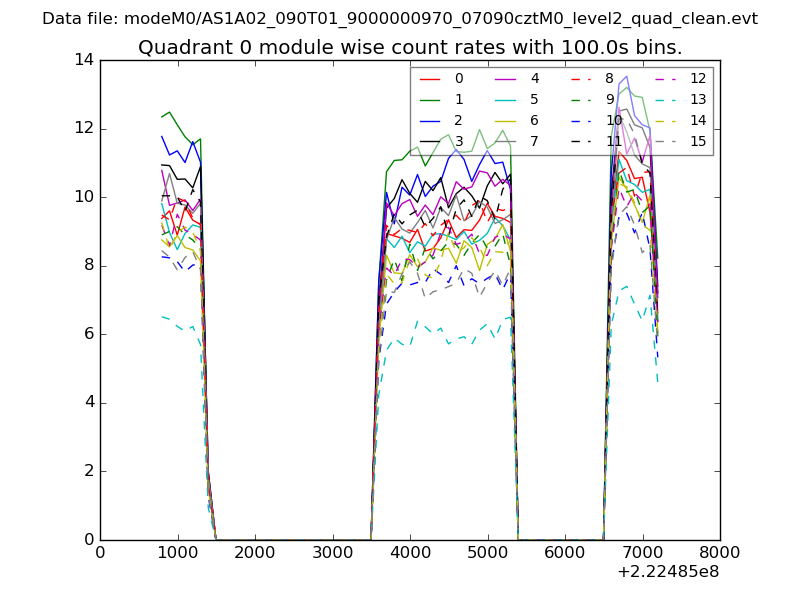 |
 |
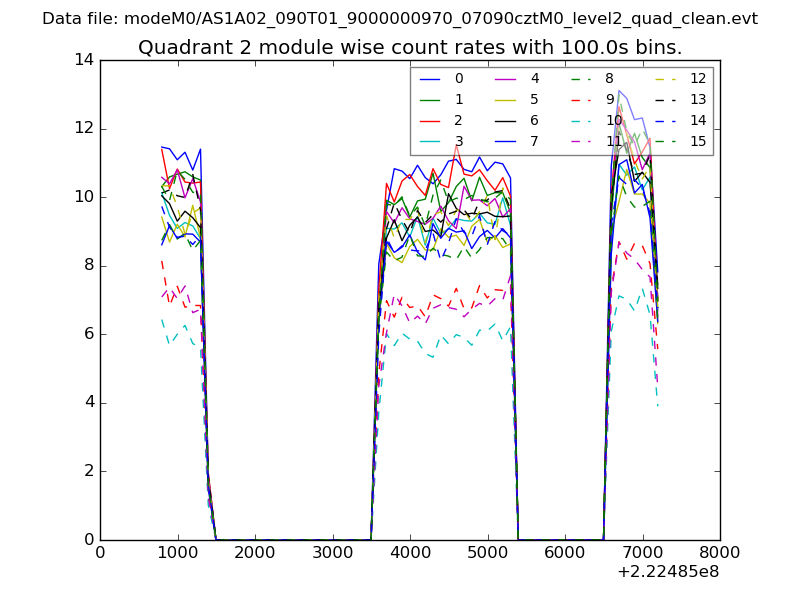
| Module-wise count rates for Quadrant B Data is divided into 100 sec bins |
 |
 |
| Module-wise count rates for Quadrant C Data is divided into 100 sec bins |
 |
 |
| Module-wise count rates for Quadrant D Data is divided into 100 sec bins |
 |
 |
| Parameter | Plot |
|---|---|
| CZT HV Monitor | 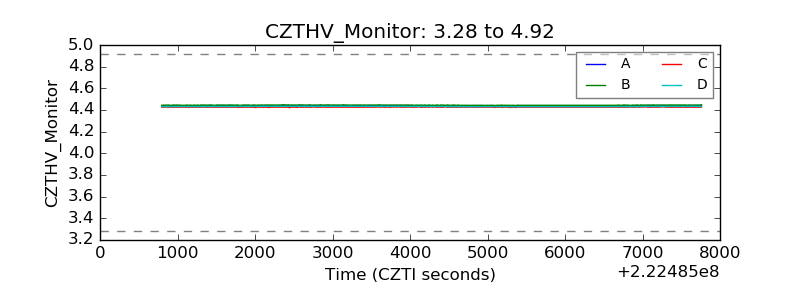 |
| D_VDD | 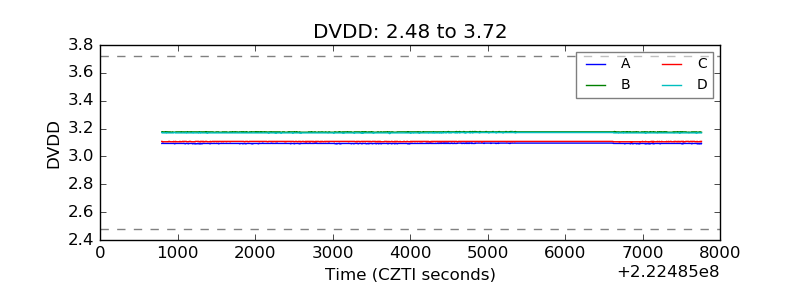 |
| Temperature 1 | 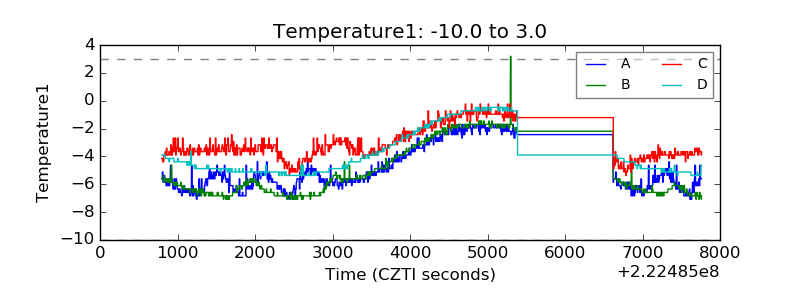 |
| Veto HV Monitor | 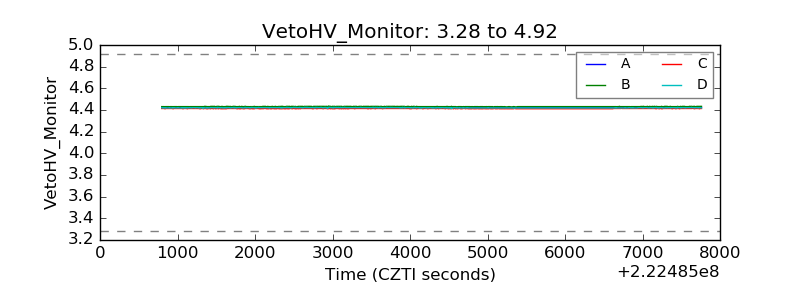 |
| Veto LLD | 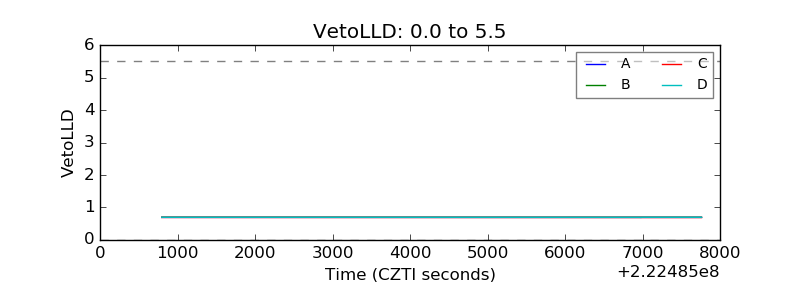 |
| Alpha Counter | 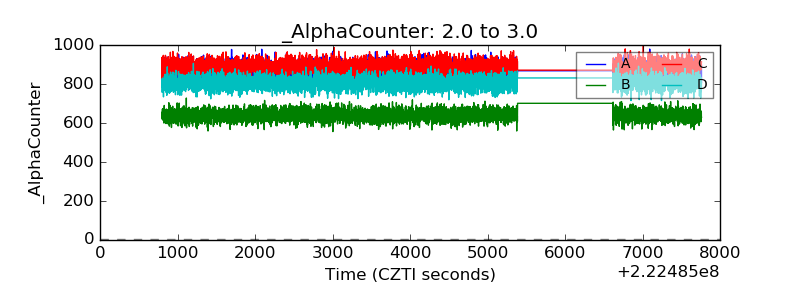 |
| _CPM_Rate | 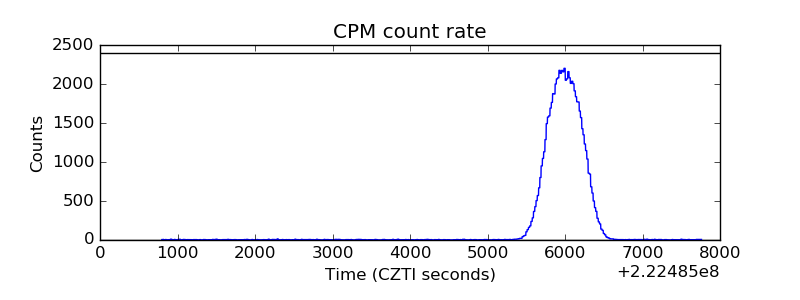 |
| CZT Counter | 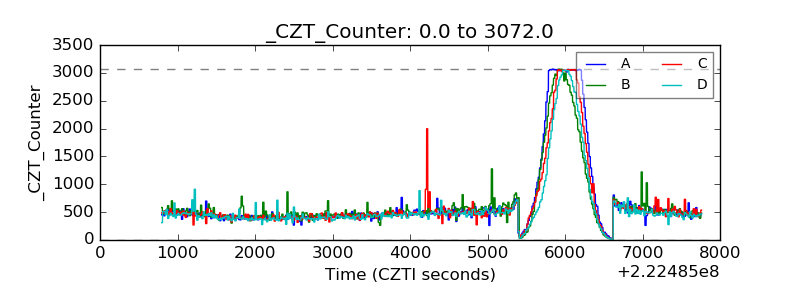 |
| +2.5 Volts monitor |  |
| +5 Volts monitor | 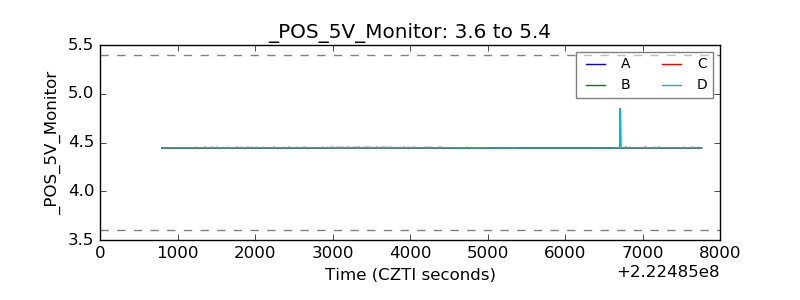 |
| _ROLL_ROT | 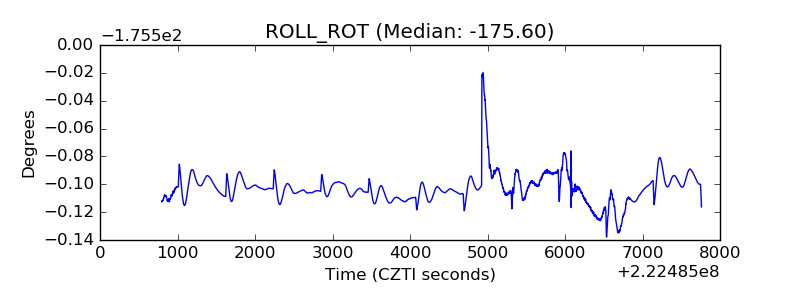 |
| _Roll_DEC | 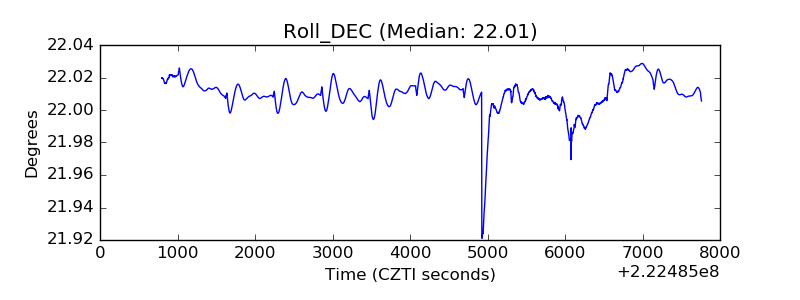 |
| _Roll_RA | 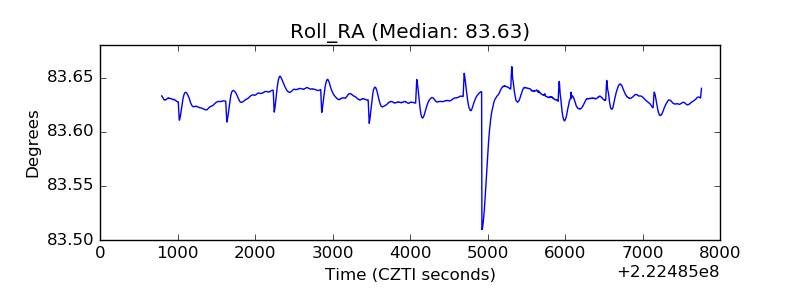 |
| Veto Counter | 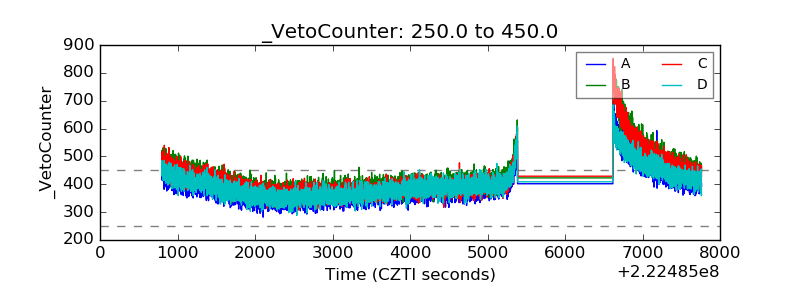 |