| Param | Original file | Final file |
|---|---|---|
| Filename | modeM0/AS1A02_090T01_9000000970_07091cztM0_level2.evt | modeM0/AS1A02_090T01_9000000970_07091cztM0_level2_quad_clean.evt |
| Size (bytes) | 446,014,080 | 75,890,880 |
| Size | 425.4 MB | 72.4 MB |
| Events in quadrant A | 3,238,034 | 464,258 |
| Events in quadrant B | 3,450,992 | 476,022 |
| Events in quadrant C | 3,191,267 | 463,027 |
| Events in quadrant D | 3,179,519 | 435,177 |
| Mode M0 | |||
|---|---|---|---|
| Quadrant | BADHDUFLAG | Total packets | Discarded packets |
| A | 0 | 13653 | 3 |
| B | 0 | 14309 | 2 |
| C | 0 | 13611 | 2 |
| D | 0 | 13922 | 2 |
| Mode M9 | |||
|---|---|---|---|
| Quadrant | BADHDUFLAG | Total packets | Discarded packets |
| A | 0 | 22 | 0 |
| B | 0 | 22 | 0 |
| C | 0 | 22 | 0 |
| D | 0 | 23 | 0 |
| Mode SS | |||
|---|---|---|---|
| Quadrant | BADHDUFLAG | Total packets | Discarded packets |
| A | 0 | 132 | 0 |
| B | 0 | 132 | 0 |
| C | 0 | 132 | 0 |
| D | 0 | 132 | 0 |
| Quadrant | Total seconds | Saturated seconds | Saturation percentage |
|---|---|---|---|
| A | 6595 | 27 | 0.409401% |
| B | 6595 | 42 | 0.636846% |
| C | 6595 | 12 | 0.181956% |
| D | 6595 | 35 | 0.530705% |
Noise dominated data is calculated using 1-second bins in cleaned event files. If a bin has >2000 counts, and if more than 50% of those come from <1% of pixels, then it is considered to be noise-dominated and hence unusable.
| Quadrant | # 1 sec bins | Bins with >0 counts | Bins with >2000 counts | High rate bins dominated by noise | Noise dominated (total time) | Noise dominated (detector-on time) | Marked lightcurve |
|---|---|---|---|---|---|---|---|
| A | 7865 | 6596 | 0 | 0 | 0.00% | 0.00% | 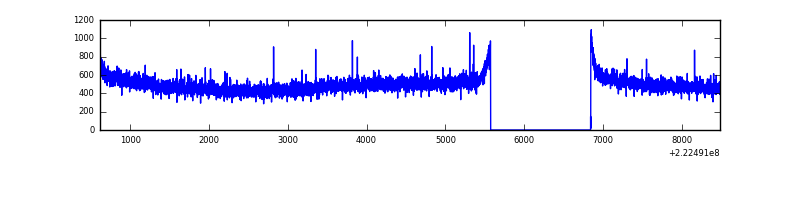 |
| B | 7865 | 6596 | 6 | 6 | 0.08% | 0.09% | 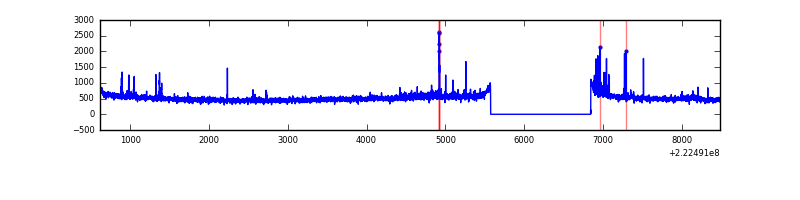 |
| C | 7865 | 6596 | 0 | 0 | 0.00% | 0.00% | 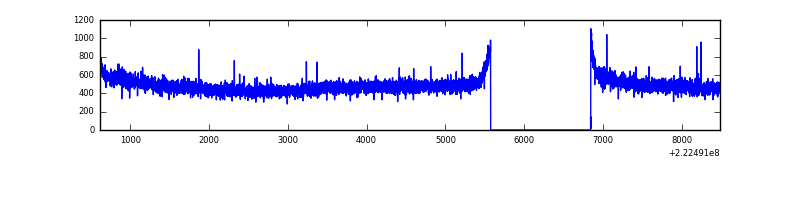 |
| D | 7865 | 6596 | 26 | 26 | 0.33% | 0.39% | 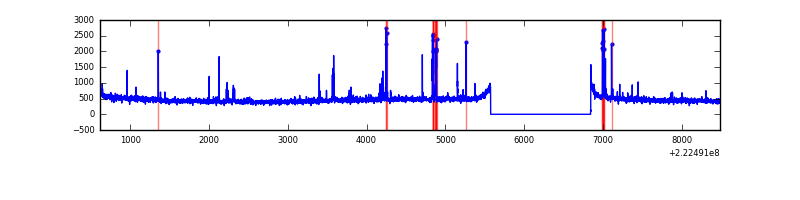 |
Top three noisy pixels from each quadrant. If the there are fewer than three noisy pixels in the level2.evt file, extra rows are filled as -1
| Pixel properties | Quadrant properties | ||||||
|---|---|---|---|---|---|---|---|
| Quadrant | DetID | PixID | Counts | Sigma | Mean | Median | Sigma |
| A | 13 | 14 | 14899 | 83.45 | 835 | 820 | 168.7 |
| A | 0 | 226 | 7936 | 42.18 | 835 | 820 | 168.7 |
| A | 12 | 194 | 7618 | 40.29 | 835 | 820 | 168.7 |
| B | 0 | 219 | 75057 | 466.42 | 848 | 832 | 159.1 |
| B | 0 | 214 | 71935 | 446.81 | 848 | 832 | 159.1 |
| B | 0 | 199 | 16125 | 96.1 | 848 | 832 | 159.1 |
| C | 9 | 68 | 7323 | 34.64 | 813 | 819 | 187.8 |
| C | 14 | 67 | 7280 | 34.41 | 813 | 819 | 187.8 |
| C | 13 | 61 | 6360 | 29.51 | 813 | 819 | 187.8 |
| D | 12 | 233 | 93294 | 469.19 | 803 | 780 | 197.2 |
| D | 13 | 105 | 37883 | 188.17 | 803 | 780 | 197.2 |
| D | 2 | 14 | 22721 | 111.28 | 803 | 780 | 197.2 |
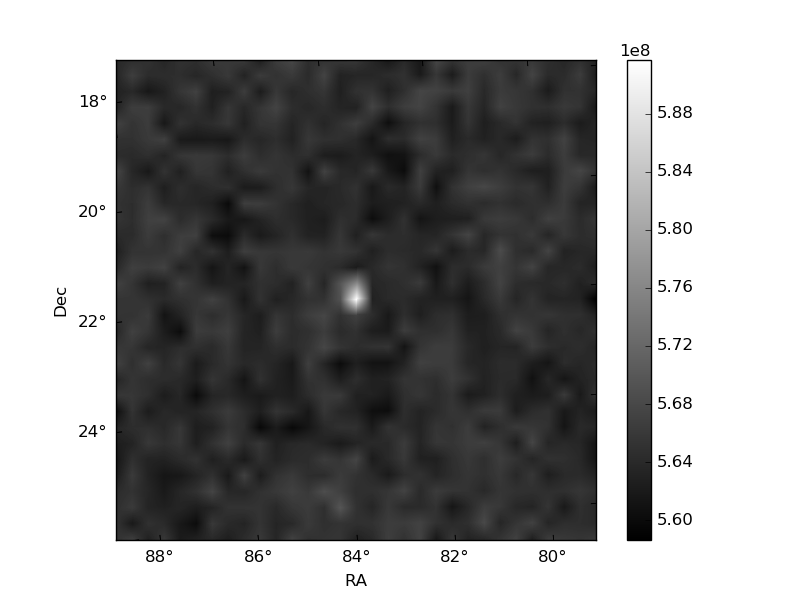
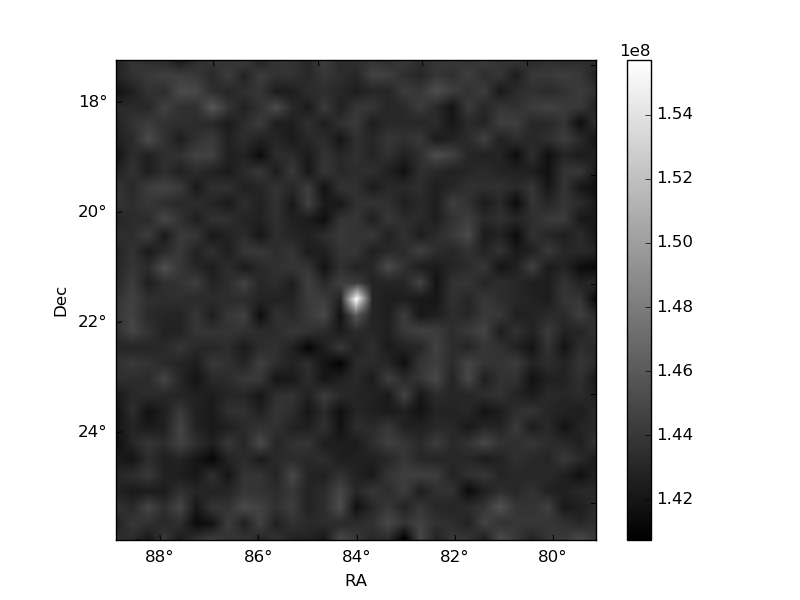
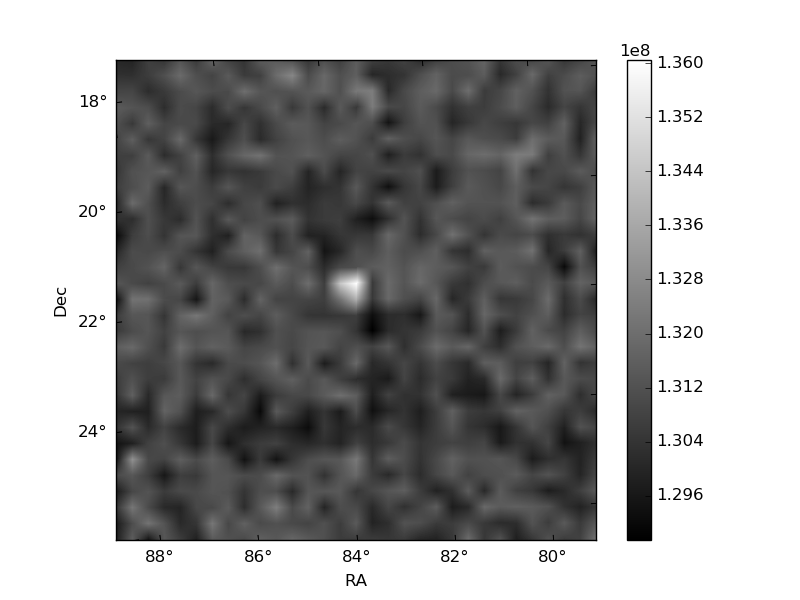
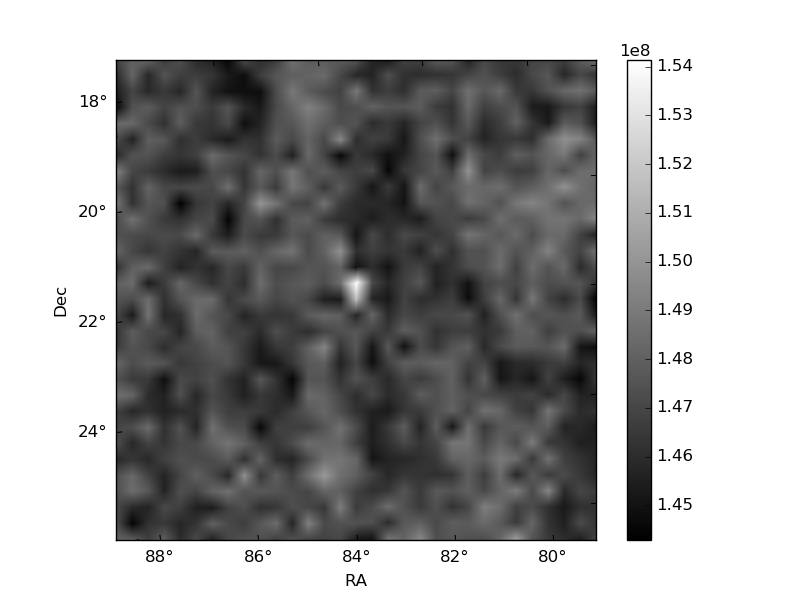
Histogram calculated using DETX and DETY for each event in the final _common_clean file
| Quadrant A | 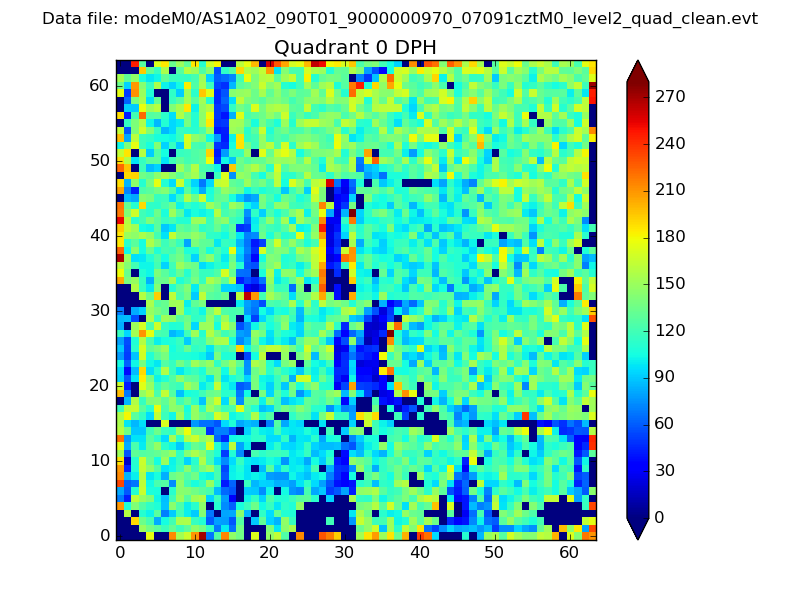 |
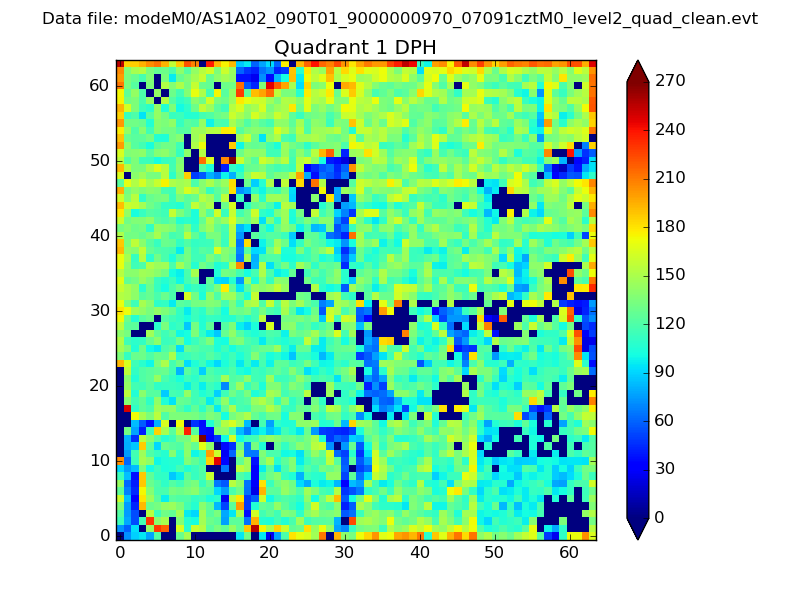 |
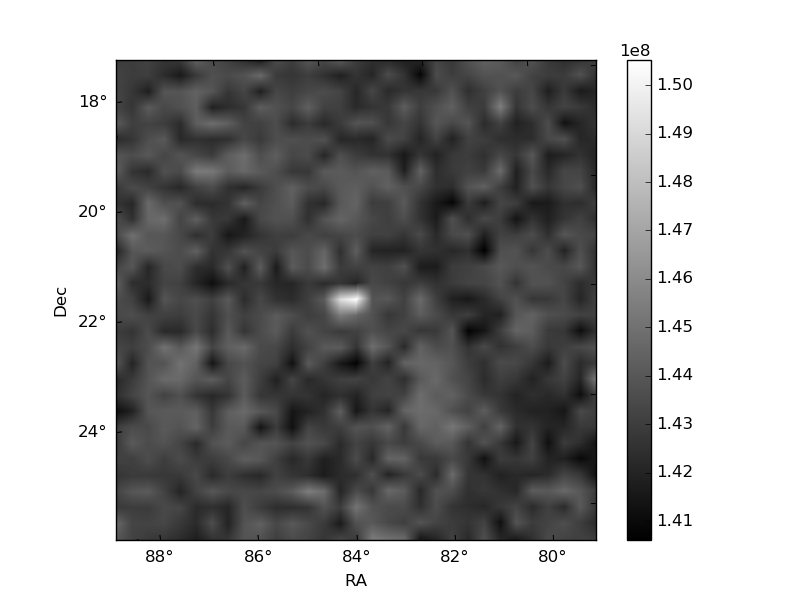
Quadrant B |
|---|---|---|---|
| Quadrant D | 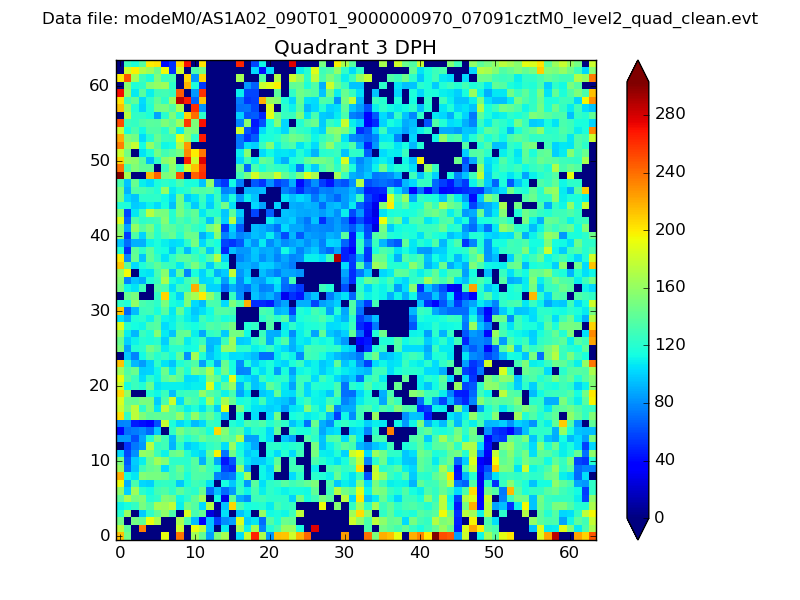 |
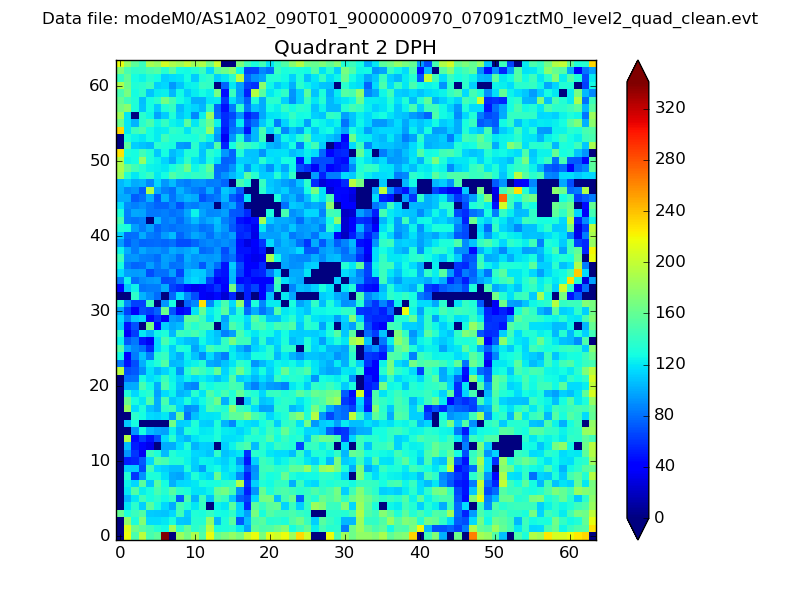 |
Quadrant C |
| Plot type | Count rate plots | Images |
|---|---|---|
| Comparison with Poisson distribution Blue bars denote a histogram of data divided into 1 sec bins. Red curve is a Poisson curve with rate = median count rate of data. |
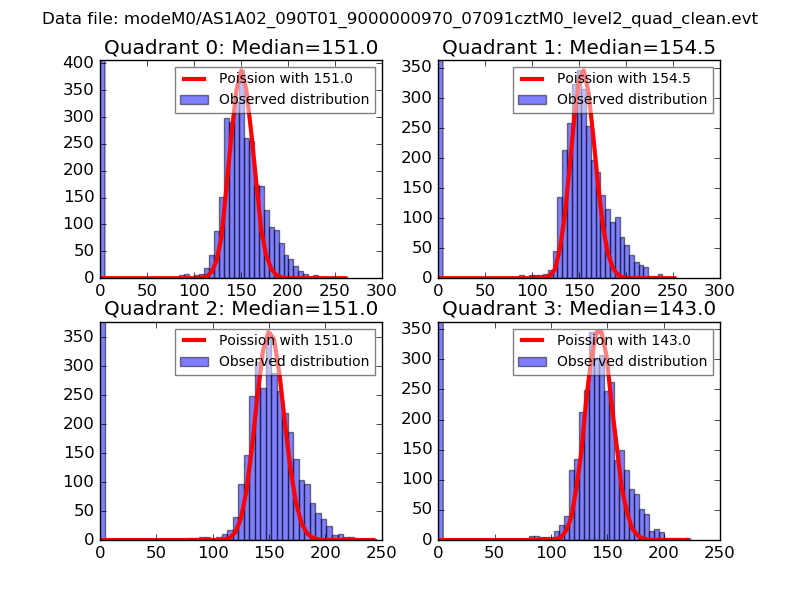 |
 |
| Quadrant-wise count rates Data is divided into 100 sec bins |
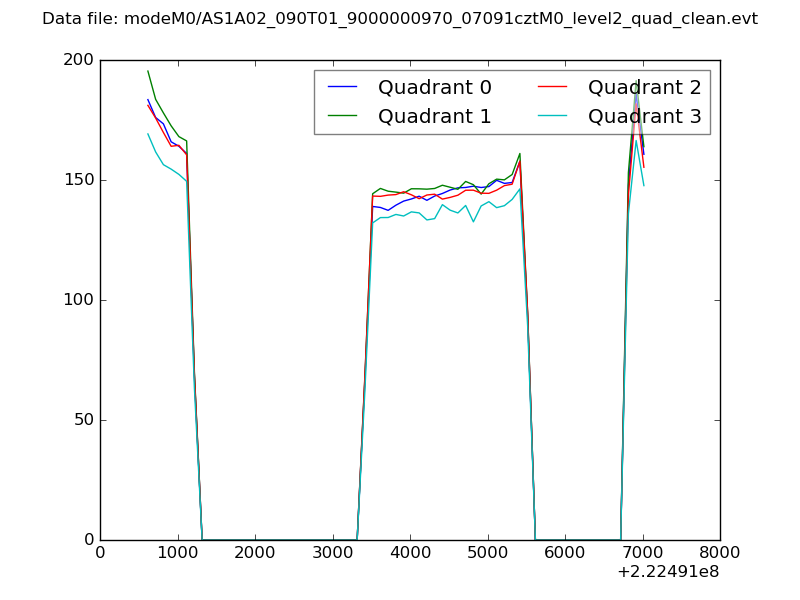 |
|
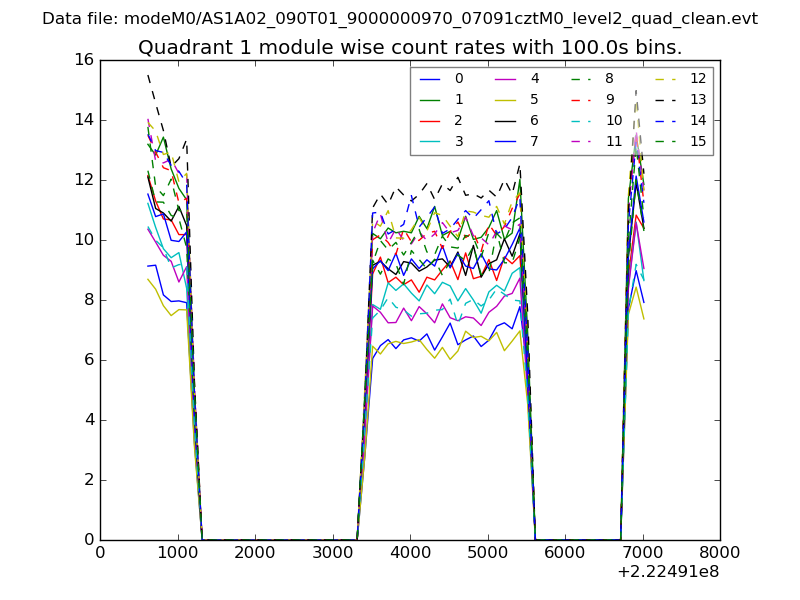
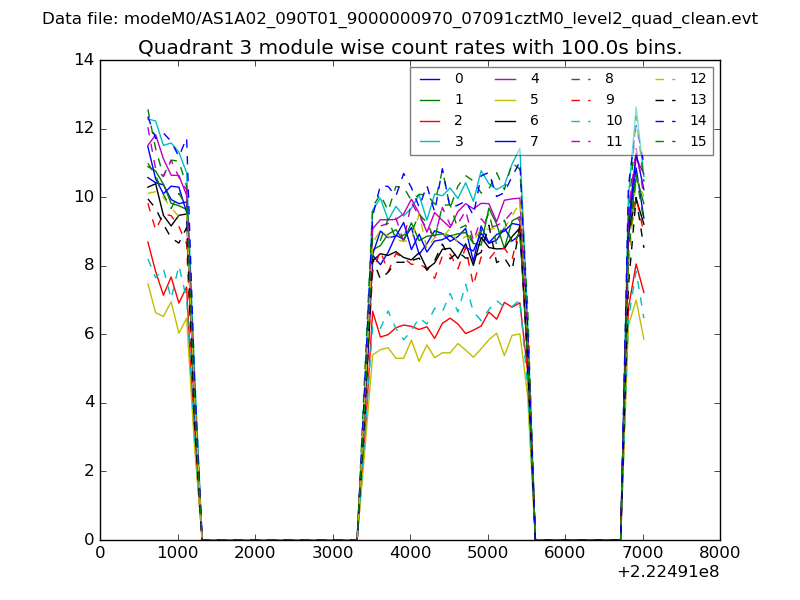
| Module-wise count rates for Quadrant A Data is divided into 100 sec bins |
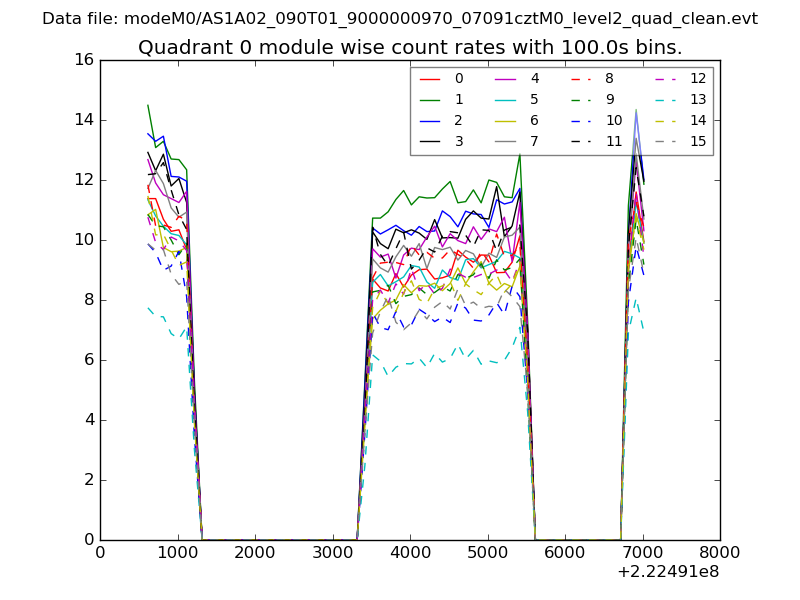 |
 |
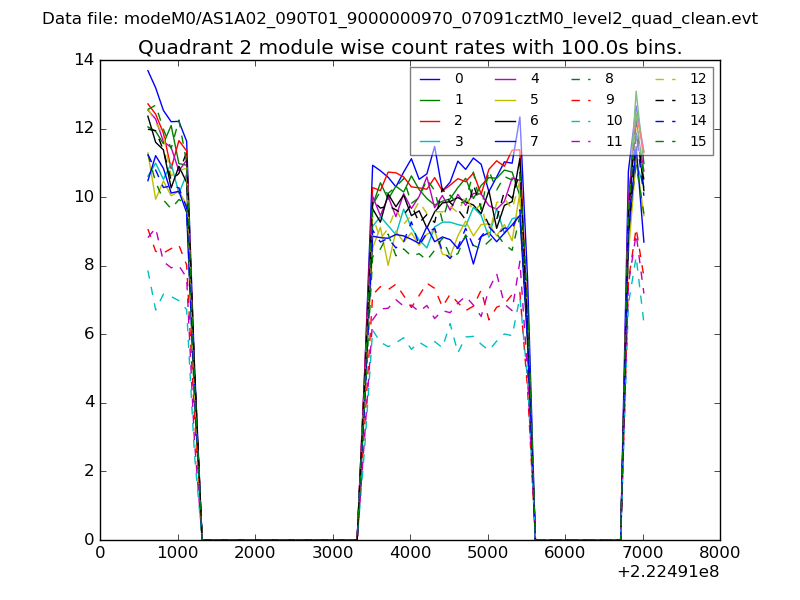
| Module-wise count rates for Quadrant B Data is divided into 100 sec bins |
 |
 |
| Module-wise count rates for Quadrant C Data is divided into 100 sec bins |
 |
 |
| Module-wise count rates for Quadrant D Data is divided into 100 sec bins |
 |
 |
| Parameter | Plot |
|---|---|
| CZT HV Monitor | 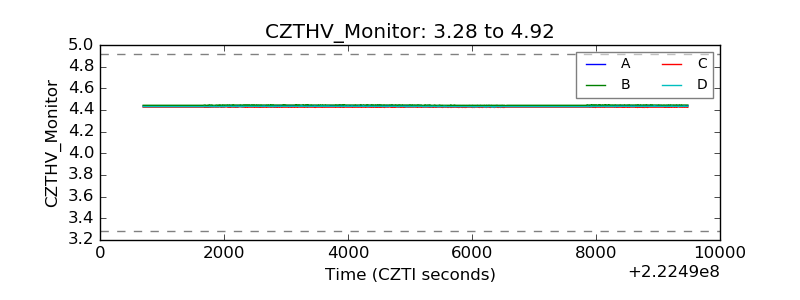 |
| D_VDD | 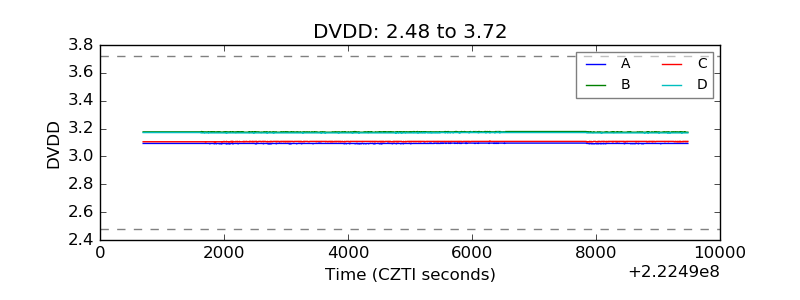 |
| Temperature 1 | 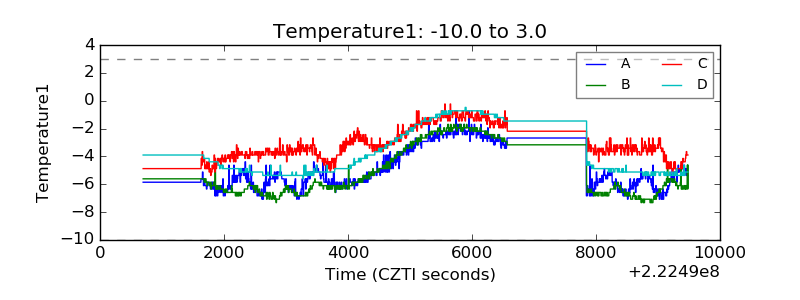 |
| Veto HV Monitor | 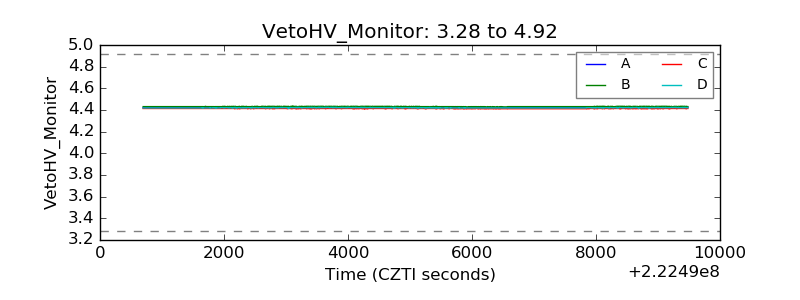 |
| Veto LLD | 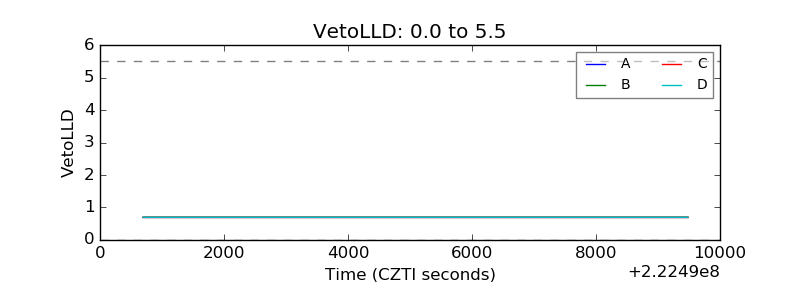 |
| Alpha Counter |  |
| _CPM_Rate | 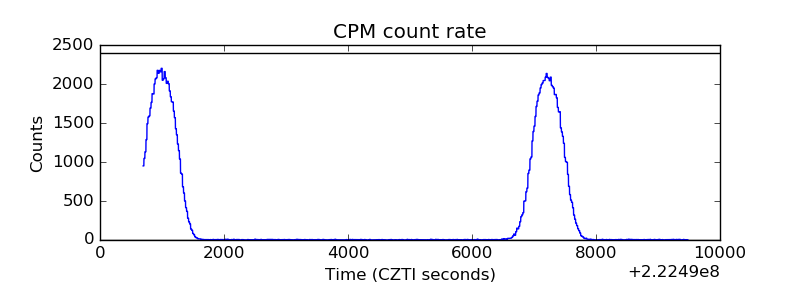 |
| CZT Counter |  |
| +2.5 Volts monitor |  |
| +5 Volts monitor |  |
| _ROLL_ROT | 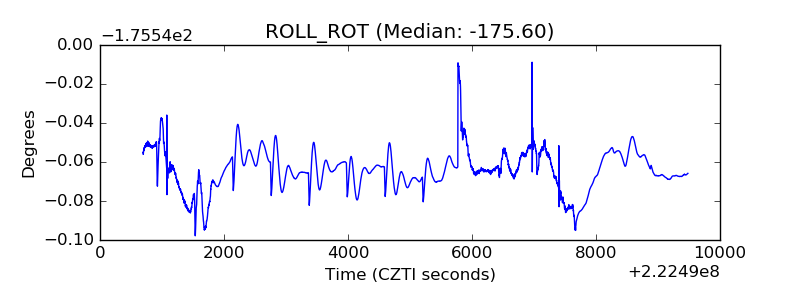 |
| _Roll_DEC | 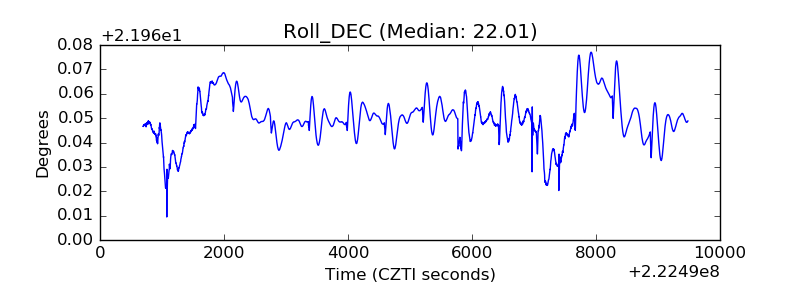 |
| _Roll_RA | 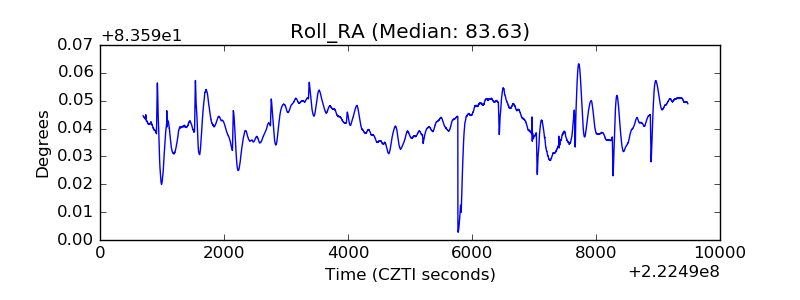 |
| Veto Counter |  |