| Param | Original file | Final file |
|---|---|---|
| Filename | modeM0/AS1A02_090T01_9000000970_07093cztM0_level2.evt | modeM0/AS1A02_090T01_9000000970_07093cztM0_level2_quad_clean.evt |
| Size (bytes) | 451,972,800 | 73,391,040 |
| Size | 431.0 MB | 70.0 MB |
| Events in quadrant A | 3,306,532 | 445,358 |
| Events in quadrant B | 3,463,309 | 451,246 |
| Events in quadrant C | 3,279,981 | 442,964 |
| Events in quadrant D | 3,188,944 | 421,842 |
| Mode M0 | |||
|---|---|---|---|
| Quadrant | BADHDUFLAG | Total packets | Discarded packets |
| A | 0 | 13842 | 3 |
| B | 0 | 14185 | 2 |
| C | 0 | 13928 | 2 |
| D | 0 | 13949 | 2 |
| Mode M9 | |||
|---|---|---|---|
| Quadrant | BADHDUFLAG | Total packets | Discarded packets |
| A | 0 | 25 | 0 |
| B | 0 | 25 | 0 |
| C | 0 | 25 | 0 |
| D | 0 | 25 | 0 |
| Mode SS | |||
|---|---|---|---|
| Quadrant | BADHDUFLAG | Total packets | Discarded packets |
| A | 0 | 138 | 0 |
| B | 0 | 138 | 0 |
| C | 0 | 138 | 0 |
| D | 0 | 138 | 0 |
| Quadrant | Total seconds | Saturated seconds | Saturation percentage |
|---|---|---|---|
| A | 6609 | 123 | 1.861099% |
| B | 6609 | 177 | 2.678166% |
| C | 6609 | 87 | 1.316387% |
| D | 6609 | 81 | 1.225601% |
Noise dominated data is calculated using 1-second bins in cleaned event files. If a bin has >2000 counts, and if more than 50% of those come from <1% of pixels, then it is considered to be noise-dominated and hence unusable.
| Quadrant | # 1 sec bins | Bins with >0 counts | Bins with >2000 counts | High rate bins dominated by noise | Noise dominated (total time) | Noise dominated (detector-on time) | Marked lightcurve |
|---|---|---|---|---|---|---|---|
| A | 9109 | 6612 | 0 | 0 | 0.00% | 0.00% |  |
| B | 9109 | 6612 | 4 | 4 | 0.04% | 0.06% | 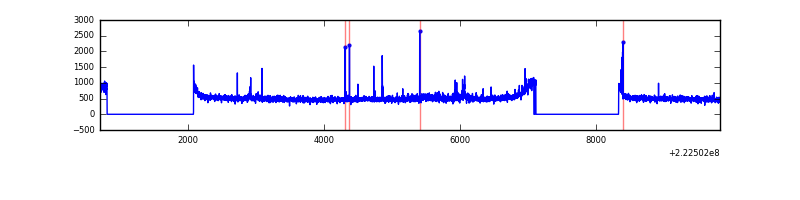 |
| C | 9109 | 6612 | 0 | 0 | 0.00% | 0.00% | 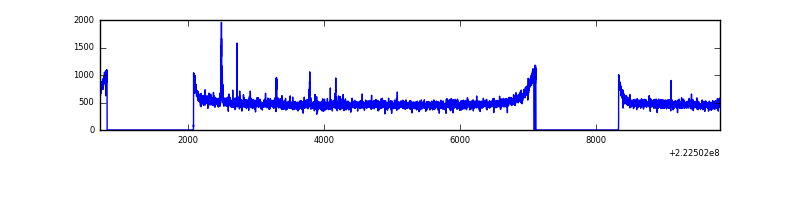 |
| D | 9109 | 6611 | 3 | 3 | 0.03% | 0.05% | 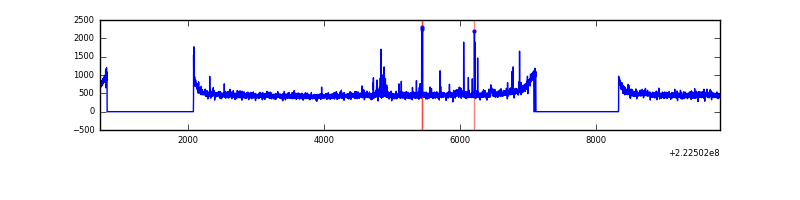 |
Top three noisy pixels from each quadrant. If the there are fewer than three noisy pixels in the level2.evt file, extra rows are filled as -1
| Pixel properties | Quadrant properties | ||||||
|---|---|---|---|---|---|---|---|
| Quadrant | DetID | PixID | Counts | Sigma | Mean | Median | Sigma |
| A | 13 | 14 | 15825 | 86.43 | 855 | 839 | 173.4 |
| A | 0 | 226 | 8115 | 41.97 | 855 | 839 | 173.4 |
| A | 12 | 194 | 7541 | 38.66 | 855 | 839 | 173.4 |
| B | 0 | 214 | 51975 | 311.81 | 863 | 845 | 164.0 |
| B | 0 | 219 | 44526 | 266.39 | 863 | 845 | 164.0 |
| B | 0 | 199 | 16588 | 96.01 | 863 | 845 | 164.0 |
| C | 4 | 254 | 43103 | 219.46 | 827 | 834 | 192.6 |
| C | 9 | 68 | 9311 | 44.01 | 827 | 834 | 192.6 |
| C | 13 | 61 | 6559 | 29.72 | 827 | 834 | 192.6 |
| D | 1 | 20 | 41477 | 200.12 | 823 | 797 | 203.3 |
| D | 12 | 233 | 30937 | 148.27 | 823 | 797 | 203.3 |
| D | 7 | 55 | 15132 | 70.52 | 823 | 797 | 203.3 |
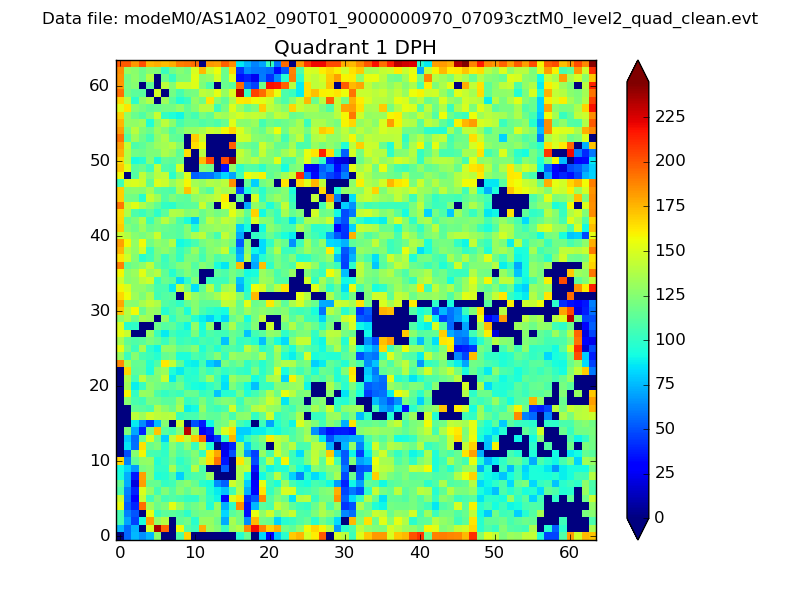
Histogram calculated using DETX and DETY for each event in the final _common_clean file
| Quadrant A | 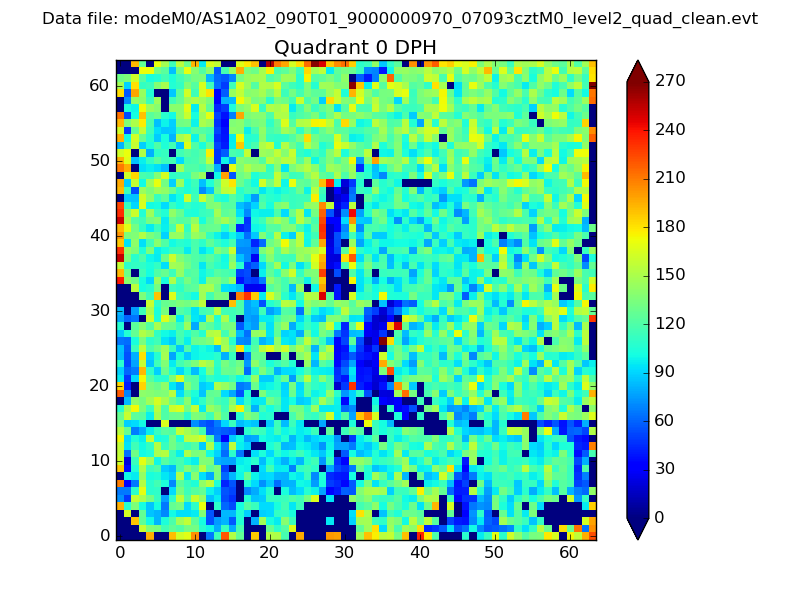 |
 |
Quadrant B |
|---|---|---|---|
| Quadrant D | 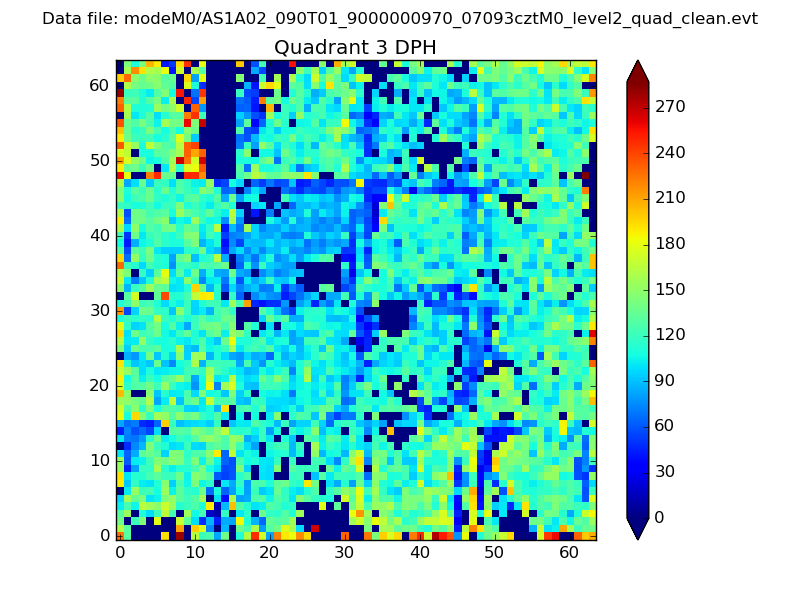 |
 |
Quadrant C |
| Plot type | Count rate plots | Images |
|---|---|---|
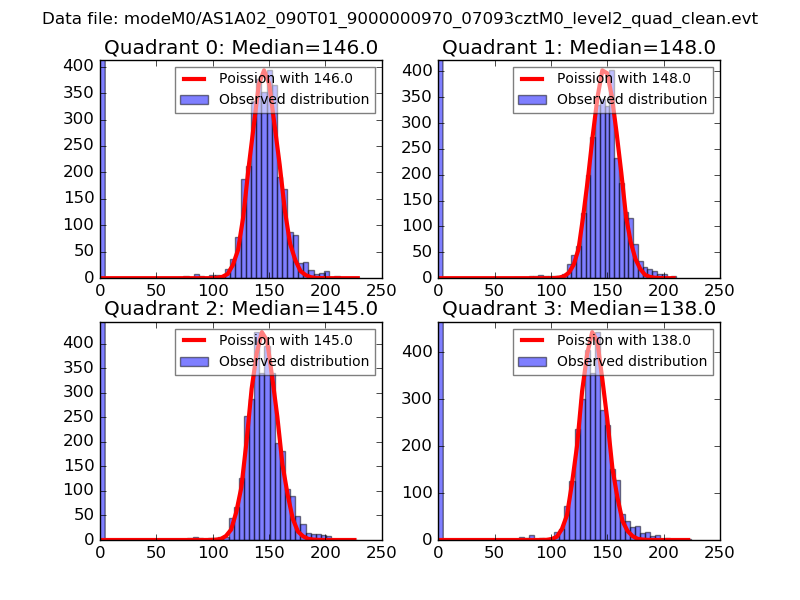
| Comparison with Poisson distribution Blue bars denote a histogram of data divided into 1 sec bins. Red curve is a Poisson curve with rate = median count rate of data. |
 |
 |
| Quadrant-wise count rates Data is divided into 100 sec bins |
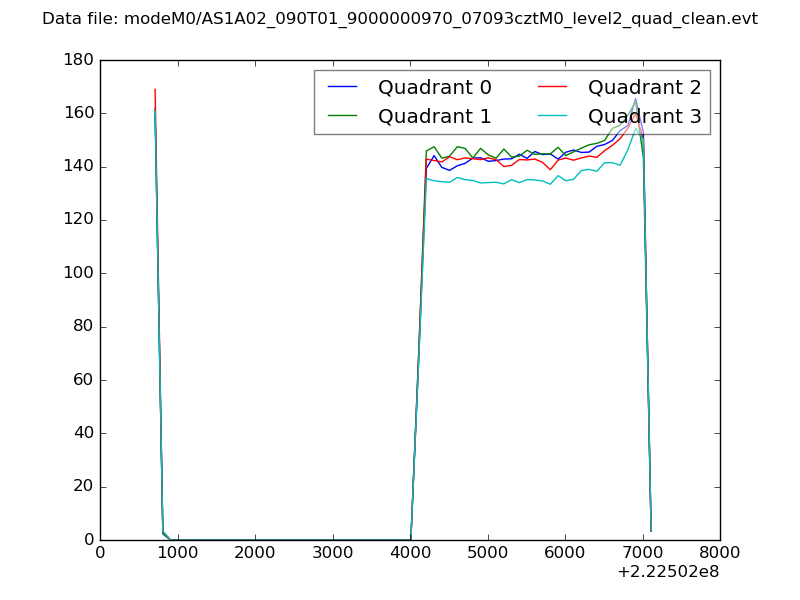 |
|
| Module-wise count rates for Quadrant A Data is divided into 100 sec bins |
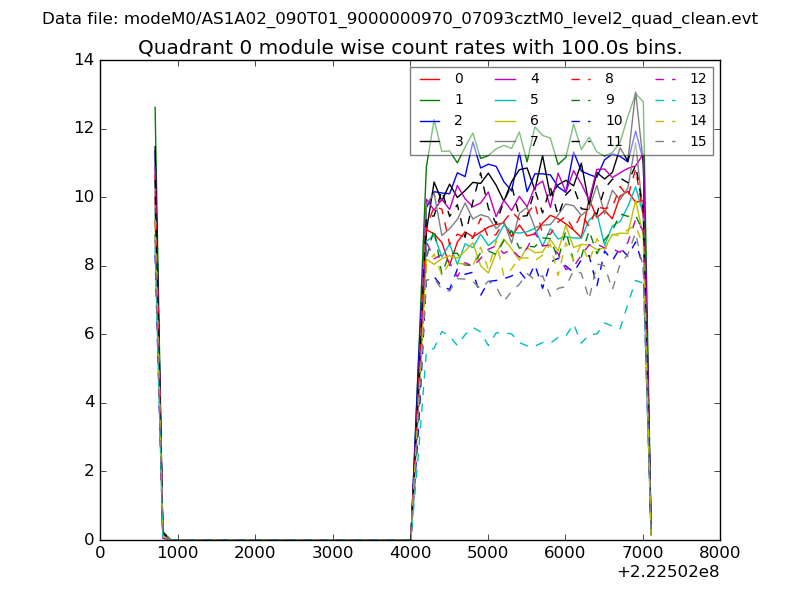 |
 |
| Module-wise count rates for Quadrant B Data is divided into 100 sec bins |
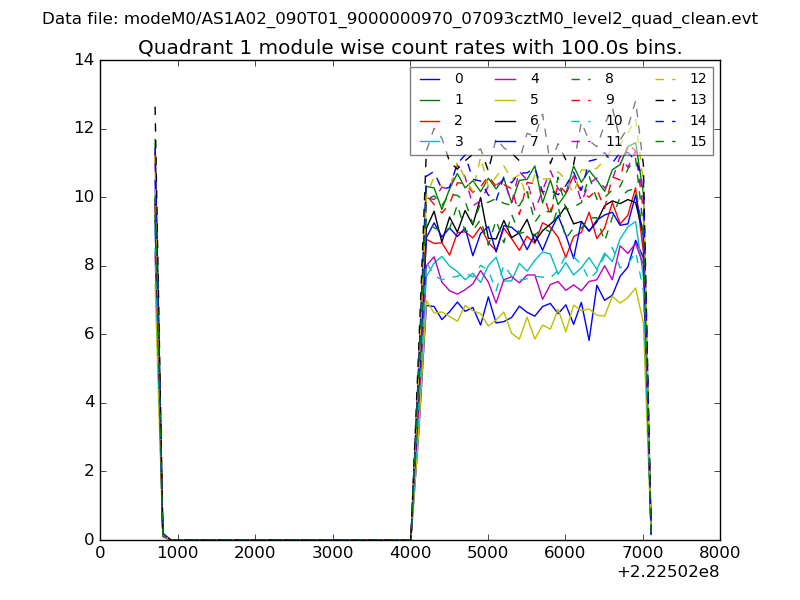 |
 |
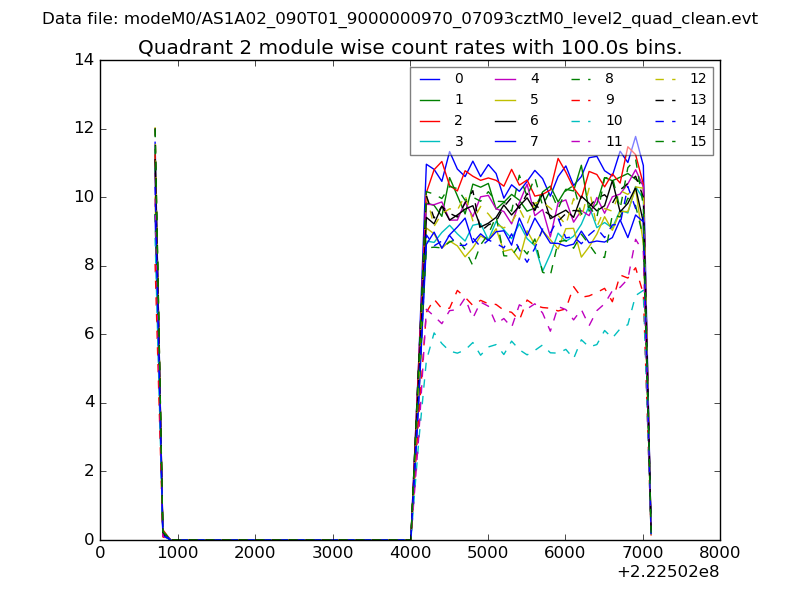
| Module-wise count rates for Quadrant C Data is divided into 100 sec bins |
 |
 |
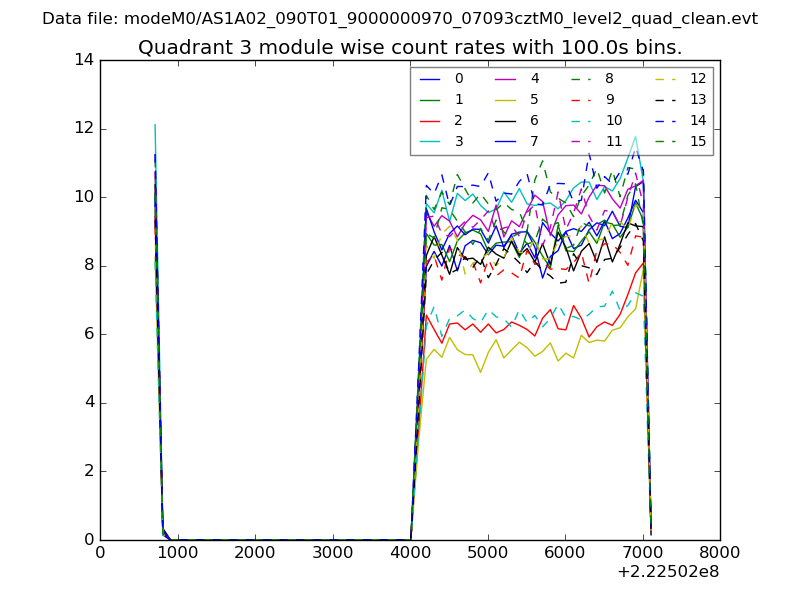
| Module-wise count rates for Quadrant D Data is divided into 100 sec bins |
 |
 |
| Parameter | Plot |
|---|---|
| CZT HV Monitor | 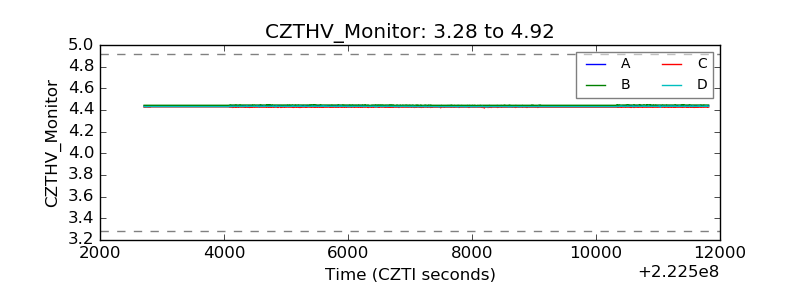 |
| D_VDD | 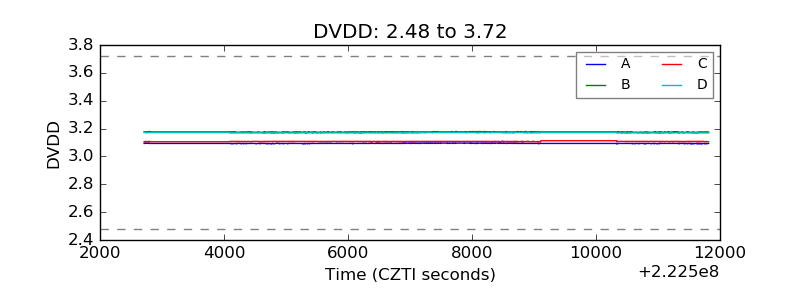 |
| Temperature 1 | 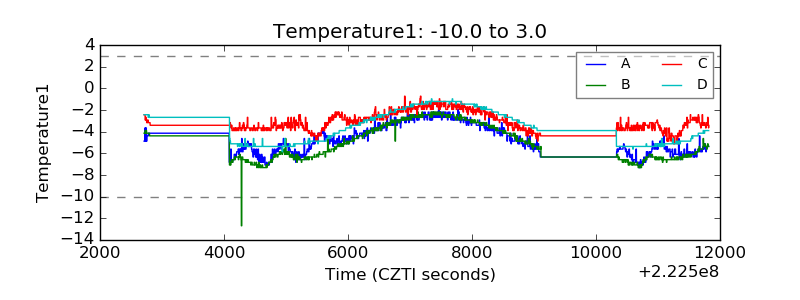 |
| Veto HV Monitor | 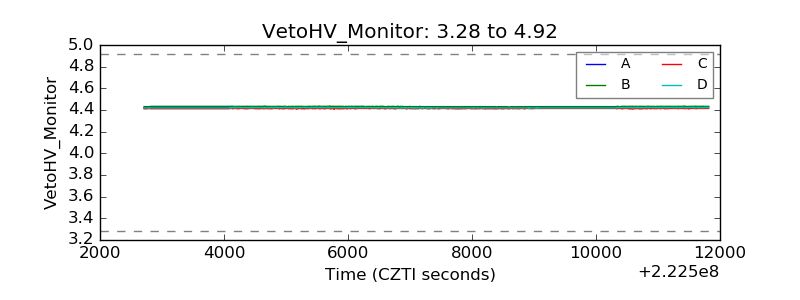 |
| Veto LLD | 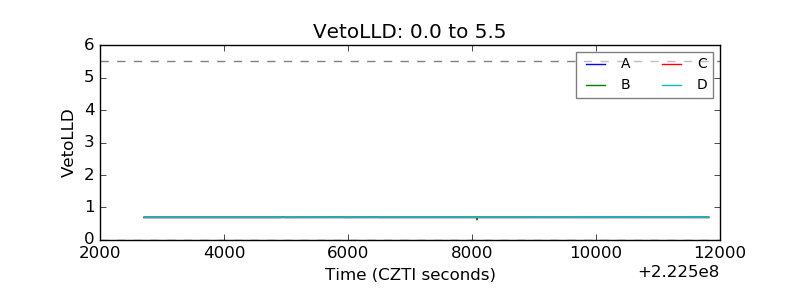 |
| Alpha Counter |  |
| _CPM_Rate | 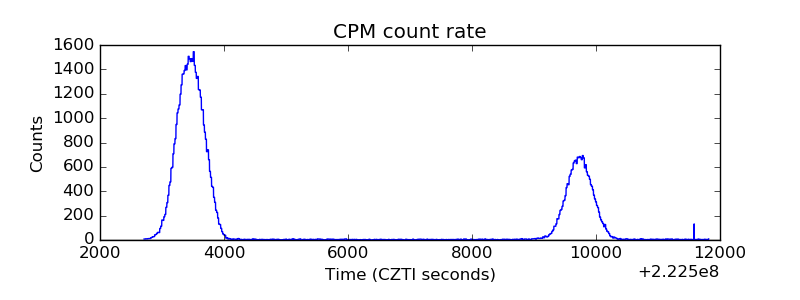 |
| CZT Counter | 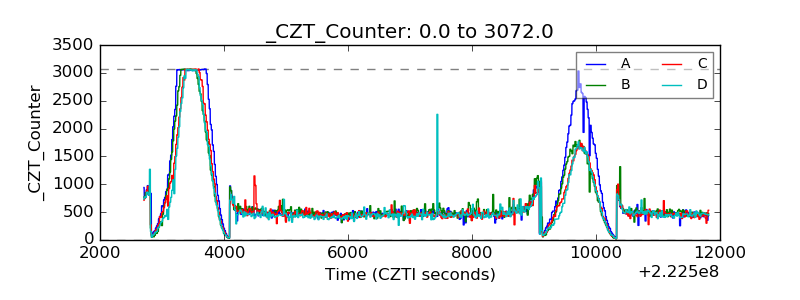 |
| +2.5 Volts monitor |  |
| +5 Volts monitor |  |
| _ROLL_ROT |  |
| _Roll_DEC |  |
| _Roll_RA | 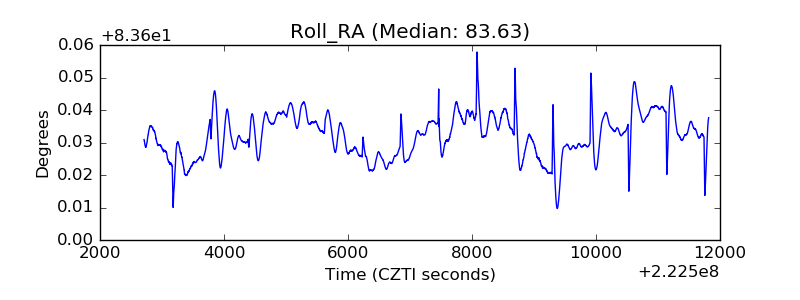 |
| Veto Counter | 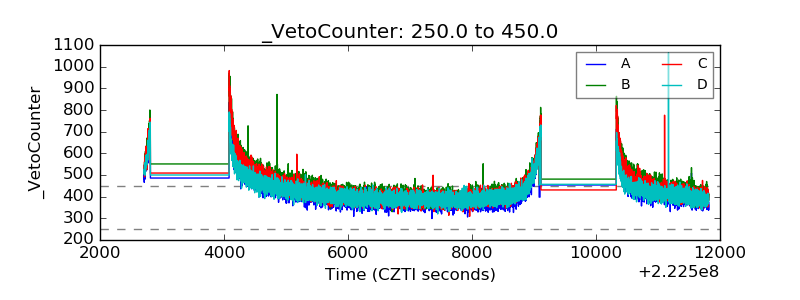 |