| Param | Original file | Final file |
|---|---|---|
| Filename | modeM0/AS1A02_090T01_9000000970_07094cztM0_level2.evt | modeM0/AS1A02_090T01_9000000970_07094cztM0_level2_quad_clean.evt |
| Size (bytes) | 460,200,960 | 83,701,440 |
| Size | 438.9 MB | 79.8 MB |
| Events in quadrant A | 3,243,881 | 525,262 |
| Events in quadrant B | 3,366,320 | 529,823 |
| Events in quadrant C | 3,198,711 | 520,198 |
| Events in quadrant D | 3,674,981 | 494,574 |
| Mode M0 | |||
|---|---|---|---|
| Quadrant | BADHDUFLAG | Total packets | Discarded packets |
| A | 0 | 13820 | 3 |
| B | 0 | 13970 | 2 |
| C | 0 | 13808 | 2 |
| D | 0 | 14952 | 2 |
| Mode M9 | |||
|---|---|---|---|
| Quadrant | BADHDUFLAG | Total packets | Discarded packets |
| A | 0 | 12 | 0 |
| B | 0 | 12 | 0 |
| C | 0 | 12 | 0 |
| D | 0 | 13 | 0 |
| Mode SS | |||
|---|---|---|---|
| Quadrant | BADHDUFLAG | Total packets | Discarded packets |
| A | 0 | 134 | 0 |
| B | 0 | 134 | 0 |
| C | 0 | 134 | 0 |
| D | 0 | 134 | 0 |
| Quadrant | Total seconds | Saturated seconds | Saturation percentage |
|---|---|---|---|
| A | 6672 | 135 | 2.023381% |
| B | 6672 | 145 | 2.173261% |
| C | 6672 | 74 | 1.109113% |
| D | 6672 | 128 | 1.918465% |
Noise dominated data is calculated using 1-second bins in cleaned event files. If a bin has >2000 counts, and if more than 50% of those come from <1% of pixels, then it is considered to be noise-dominated and hence unusable.
| Quadrant | # 1 sec bins | Bins with >0 counts | Bins with >2000 counts | High rate bins dominated by noise | Noise dominated (total time) | Noise dominated (detector-on time) | Marked lightcurve |
|---|---|---|---|---|---|---|---|
| A | 7657 | 6672 | 0 | 0 | 0.00% | 0.00% | 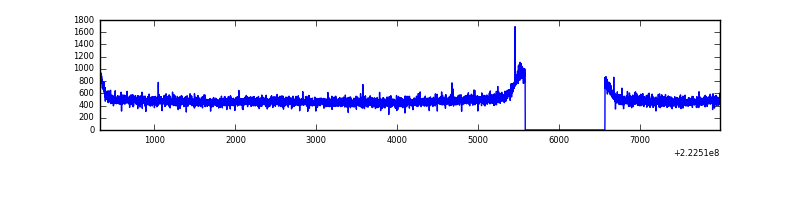 |
| B | 7657 | 6672 | 2 | 2 | 0.03% | 0.03% | 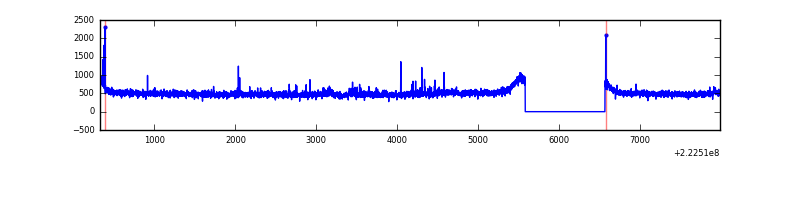 |
| C | 7657 | 6672 | 1 | 1 | 0.01% | 0.01% | 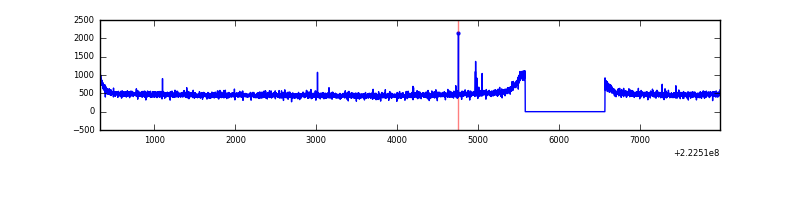 |
| D | 7657 | 6672 | 45 | 45 | 0.59% | 0.67% | 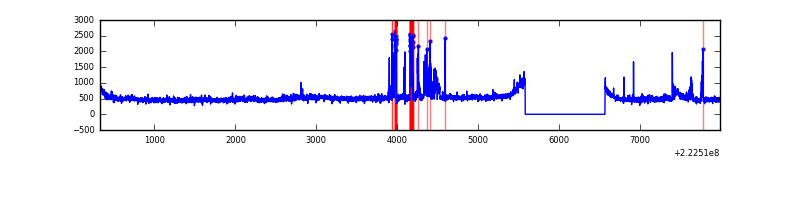 |
Top three noisy pixels from each quadrant. If the there are fewer than three noisy pixels in the level2.evt file, extra rows are filled as -1
| Pixel properties | Quadrant properties | ||||||
|---|---|---|---|---|---|---|---|
| Quadrant | DetID | PixID | Counts | Sigma | Mean | Median | Sigma |
| A | 0 | 226 | 7819 | 40.62 | 841 | 826 | 172.2 |
| A | 12 | 194 | 7482 | 38.66 | 841 | 826 | 172.2 |
| A | 13 | 14 | 5502 | 27.16 | 841 | 826 | 172.2 |
| B | 0 | 219 | 49420 | 297.37 | 847 | 828 | 163.4 |
| B | 0 | 214 | 27823 | 165.2 | 847 | 828 | 163.4 |
| B | 12 | 111 | 16523 | 96.05 | 847 | 828 | 163.4 |
| C | 4 | 254 | 9520 | 45.88 | 811 | 817 | 189.7 |
| C | 9 | 68 | 7663 | 36.09 | 811 | 817 | 189.7 |
| C | 13 | 61 | 6320 | 29.01 | 811 | 817 | 189.7 |
| D | 7 | 55 | 246781 | 1230.34 | 809 | 786 | 199.9 |
| D | 1 | 20 | 245067 | 1221.77 | 809 | 786 | 199.9 |
| D | 8 | 195 | 48832 | 240.3 | 809 | 786 | 199.9 |
Histogram calculated using DETX and DETY for each event in the final _common_clean file
| Quadrant A | 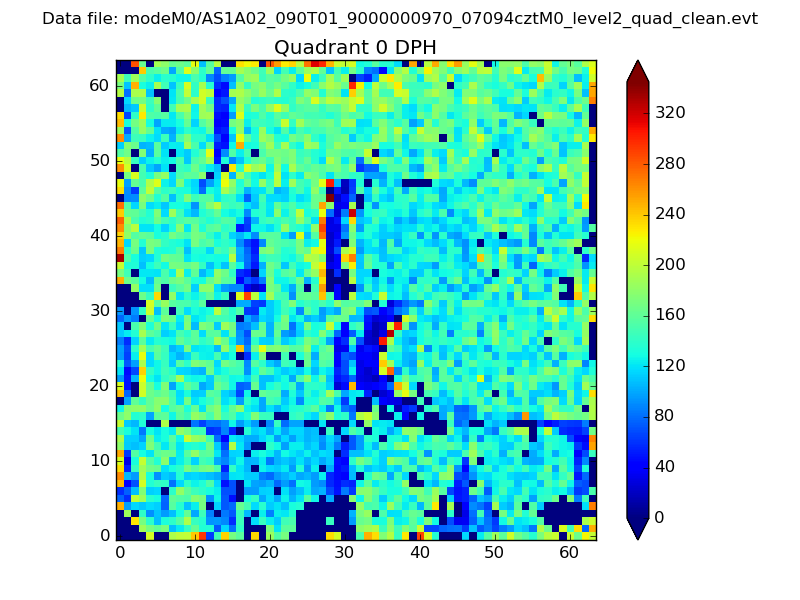 |
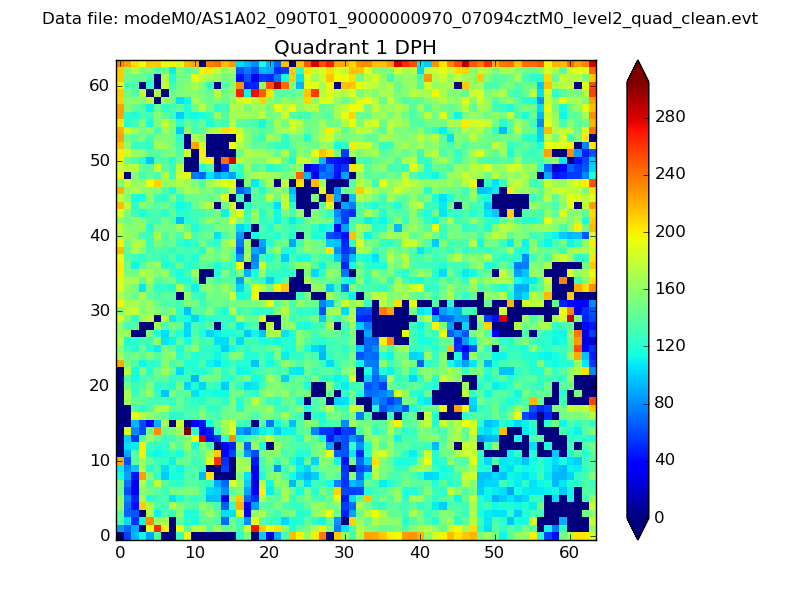 |
Quadrant B |
|---|---|---|---|
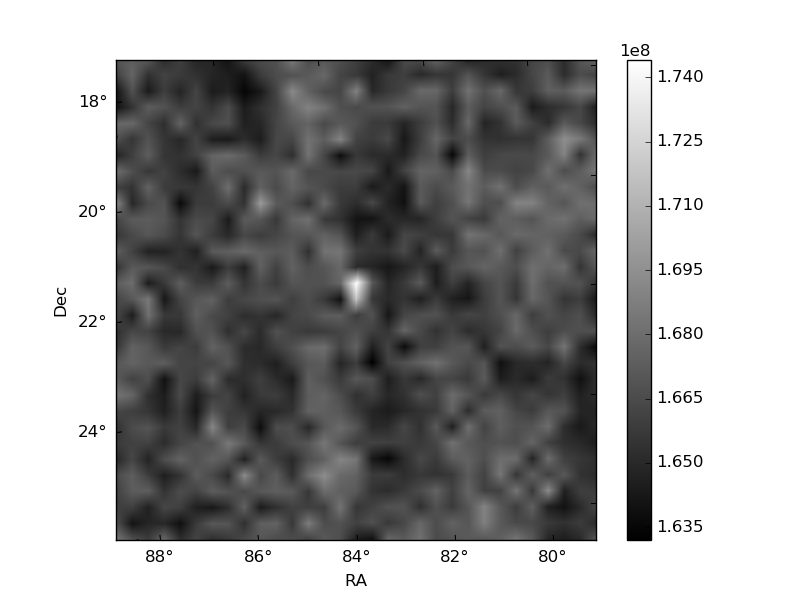
| Quadrant D | 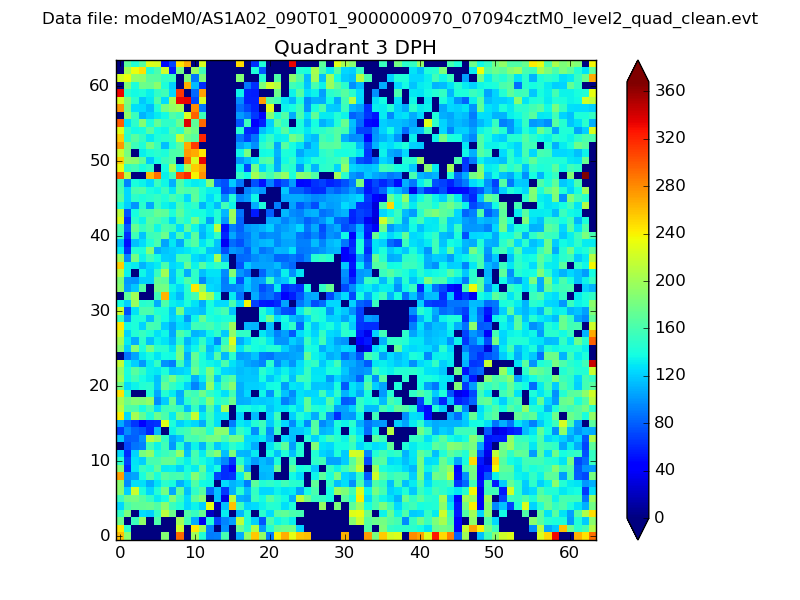 |
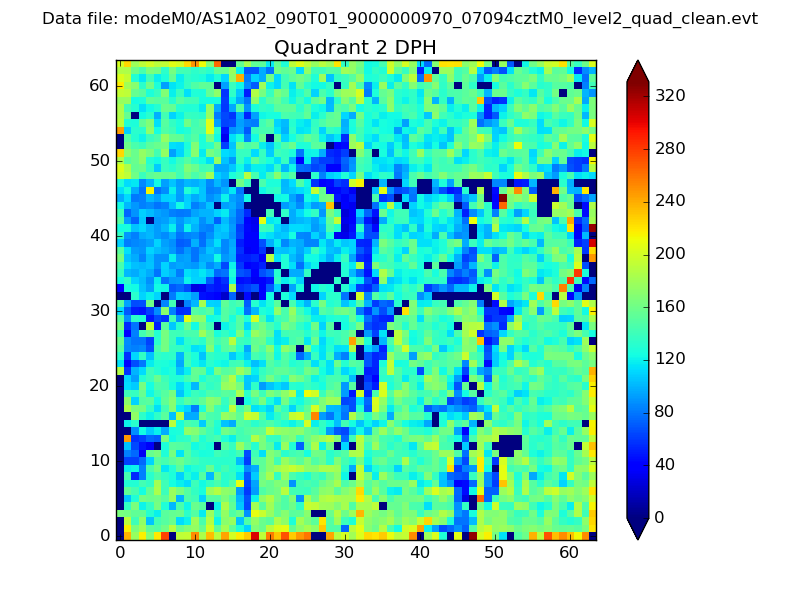 |
Quadrant C |
| Plot type | Count rate plots | Images |
|---|---|---|
| Comparison with Poisson distribution Blue bars denote a histogram of data divided into 1 sec bins. Red curve is a Poisson curve with rate = median count rate of data. |
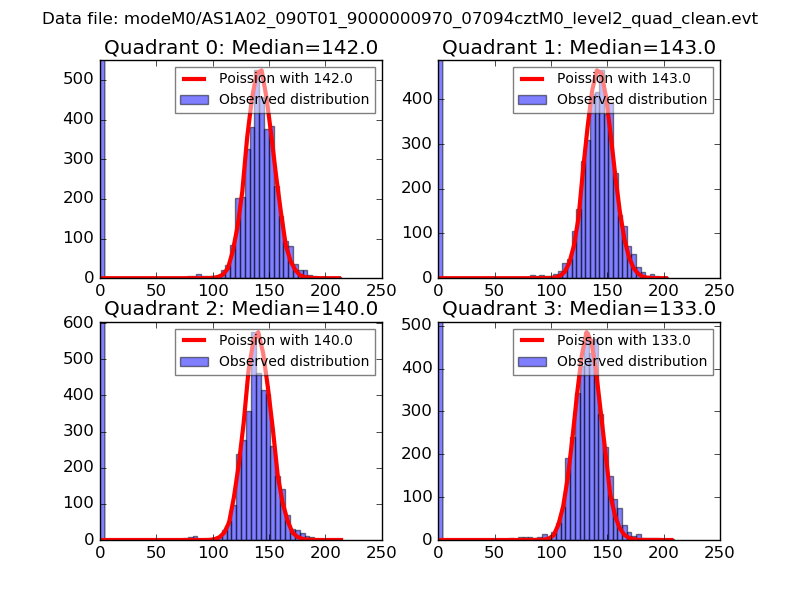 |
 |
| Quadrant-wise count rates Data is divided into 100 sec bins |
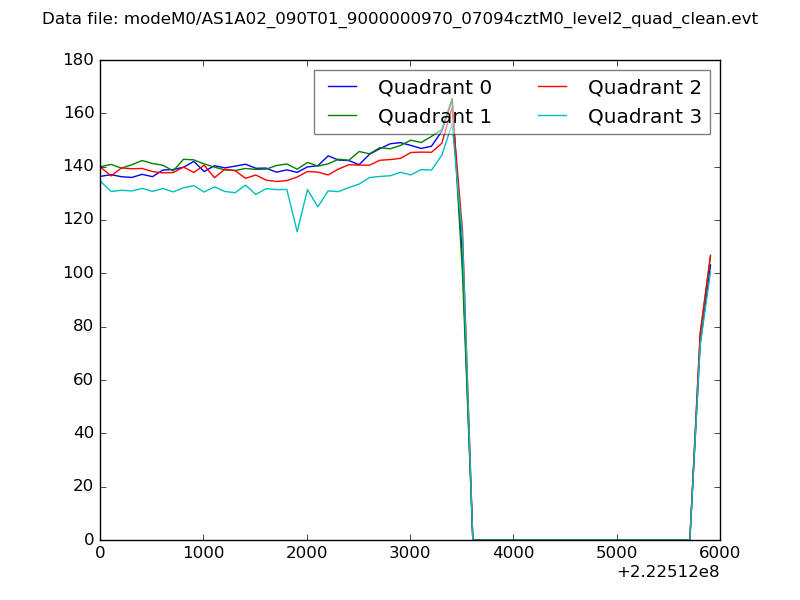 |
|
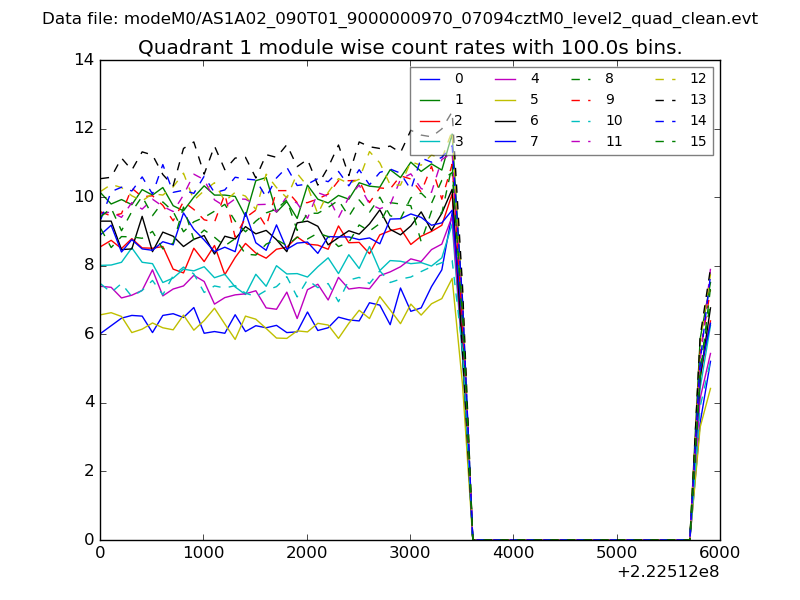
| Module-wise count rates for Quadrant A Data is divided into 100 sec bins |
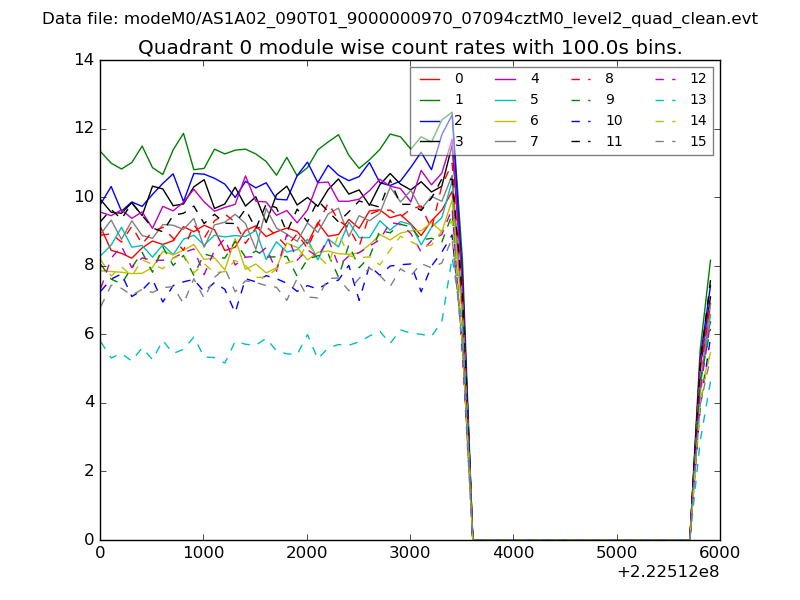 |
 |
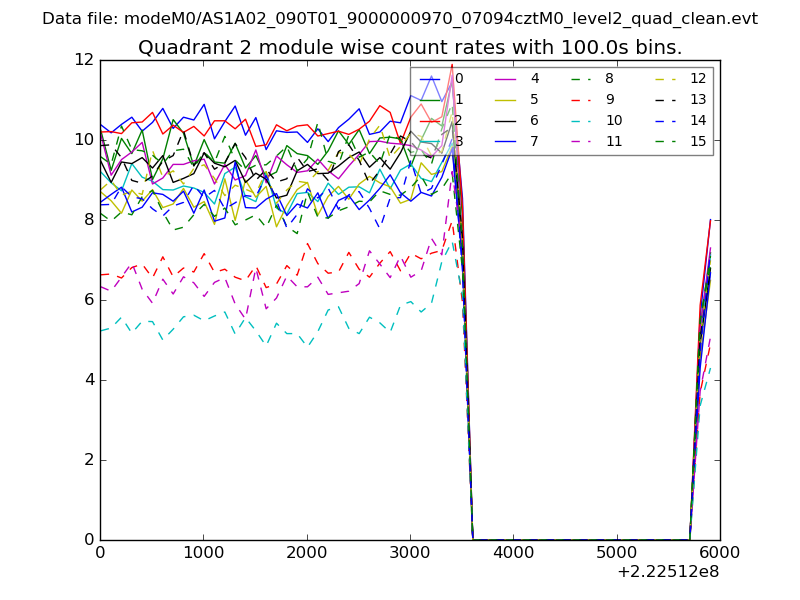
| Module-wise count rates for Quadrant B Data is divided into 100 sec bins |
 |
 |
| Module-wise count rates for Quadrant C Data is divided into 100 sec bins |
 |
 |
| Module-wise count rates for Quadrant D Data is divided into 100 sec bins |
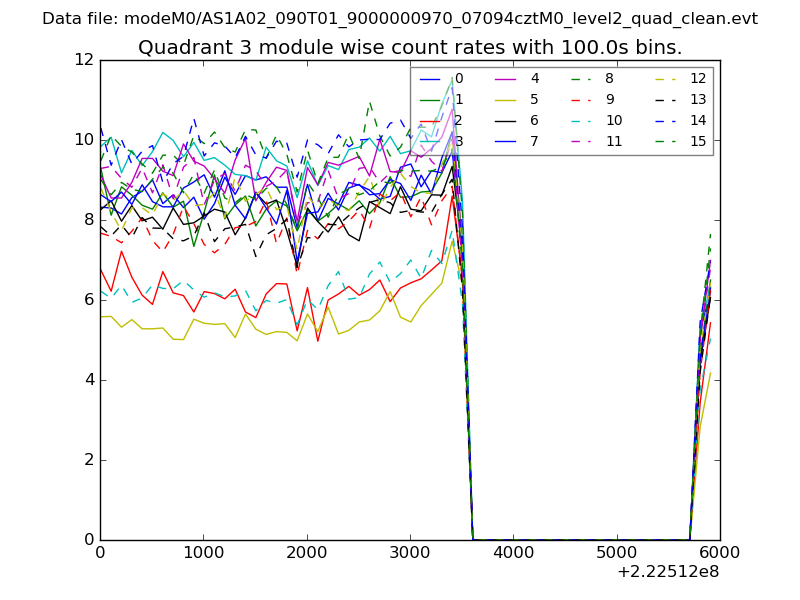 |
 |
| Parameter | Plot |
|---|---|
| CZT HV Monitor | 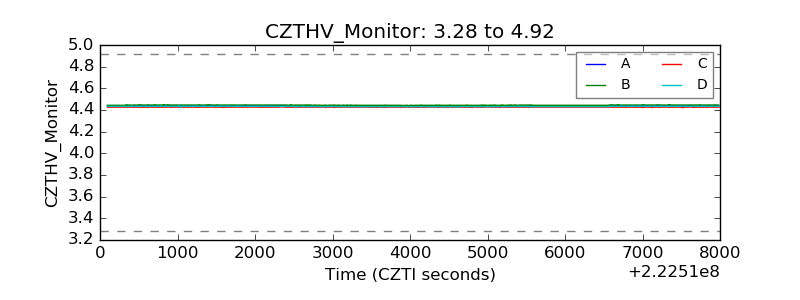 |
| D_VDD | 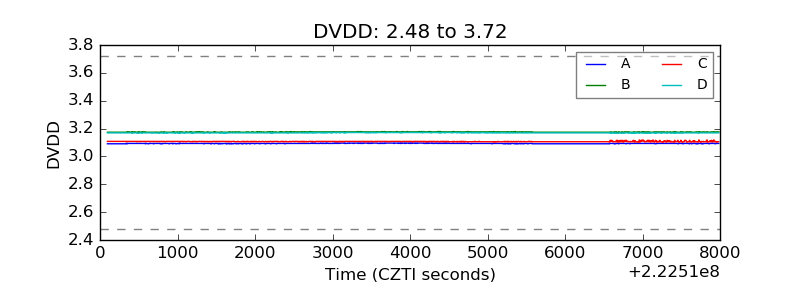 |
| Temperature 1 | 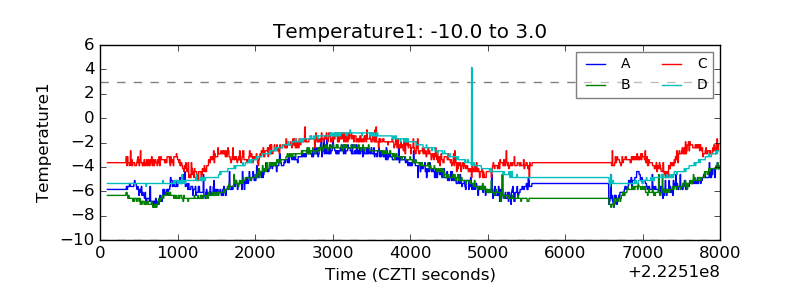 |
| Veto HV Monitor | 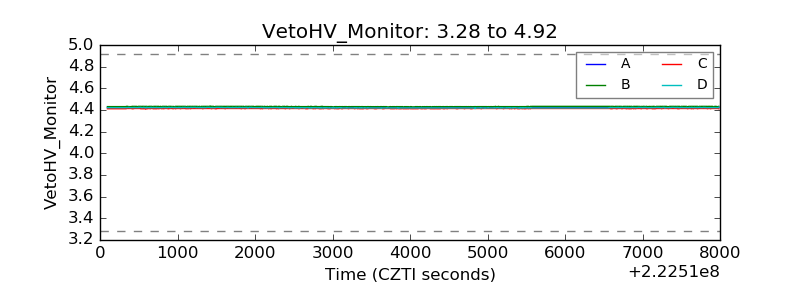 |
| Veto LLD | 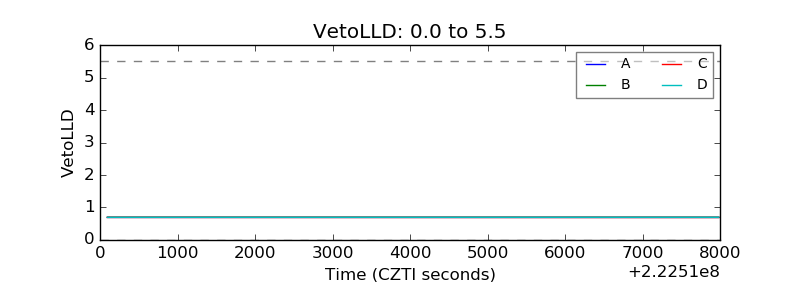 |
| Alpha Counter |  |
| _CPM_Rate | 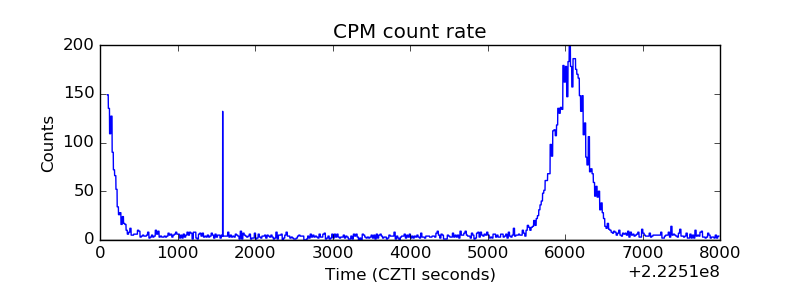 |
| CZT Counter |  |
| +2.5 Volts monitor |  |
| +5 Volts monitor |  |
| _ROLL_ROT | 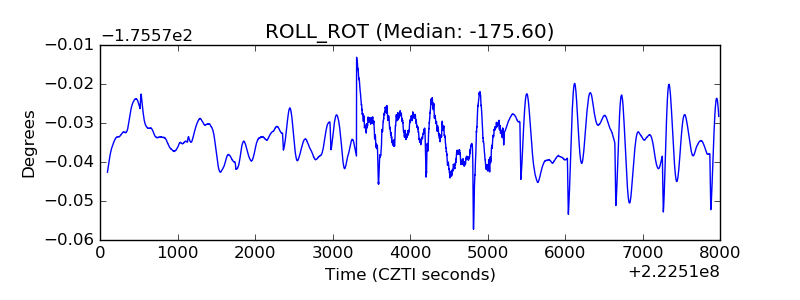 |
| _Roll_DEC | 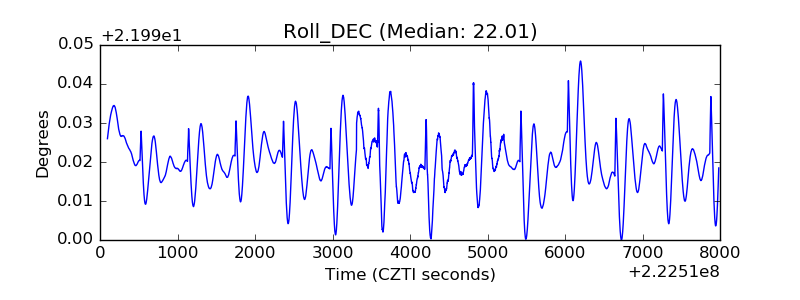 |
| _Roll_RA | 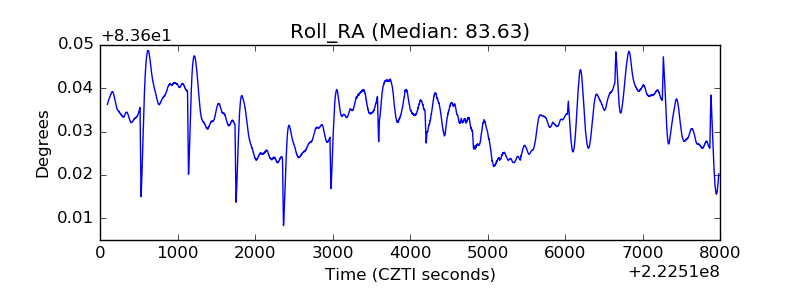 |
| Veto Counter |  |