| Param | Original file | Final file |
|---|---|---|
| Filename | modeM0/AS1A02_090T01_9000000970_07095cztM0_level2.evt | modeM0/AS1A02_090T01_9000000970_07095cztM0_level2_quad_clean.evt |
| Size (bytes) | 482,195,520 | 91,756,800 |
| Size | 459.9 MB | 87.5 MB |
| Events in quadrant A | 3,422,497 | 575,444 |
| Events in quadrant B | 3,646,830 | 583,195 |
| Events in quadrant C | 3,402,564 | 574,649 |
| Events in quadrant D | 3,644,361 | 546,506 |
| Mode M0 | |||
|---|---|---|---|
| Quadrant | BADHDUFLAG | Total packets | Discarded packets |
| A | 0 | 14769 | 3 |
| B | 0 | 15169 | 2 |
| C | 0 | 14778 | 2 |
| D | 0 | 15345 | 2 |
| Mode M9 | |||
|---|---|---|---|
| Quadrant | BADHDUFLAG | Total packets | Discarded packets |
| A | 0 | 14 | 0 |
| B | 0 | 14 | 0 |
| C | 0 | 14 | 0 |
| D | 0 | 15 | 0 |
| Mode SS | |||
|---|---|---|---|
| Quadrant | BADHDUFLAG | Total packets | Discarded packets |
| A | 0 | 146 | 0 |
| B | 0 | 146 | 0 |
| C | 0 | 146 | 0 |
| D | 0 | 146 | 0 |
| Quadrant | Total seconds | Saturated seconds | Saturation percentage |
|---|---|---|---|
| A | 7161 | 189 | 2.639296% |
| B | 7161 | 208 | 2.904622% |
| C | 7161 | 126 | 1.759531% |
| D | 7161 | 140 | 1.955034% |
Noise dominated data is calculated using 1-second bins in cleaned event files. If a bin has >2000 counts, and if more than 50% of those come from <1% of pixels, then it is considered to be noise-dominated and hence unusable.
| Quadrant | # 1 sec bins | Bins with >0 counts | Bins with >2000 counts | High rate bins dominated by noise | Noise dominated (total time) | Noise dominated (detector-on time) | Marked lightcurve |
|---|---|---|---|---|---|---|---|
| A | 7730 | 7161 | 0 | 0 | 0.00% | 0.00% | 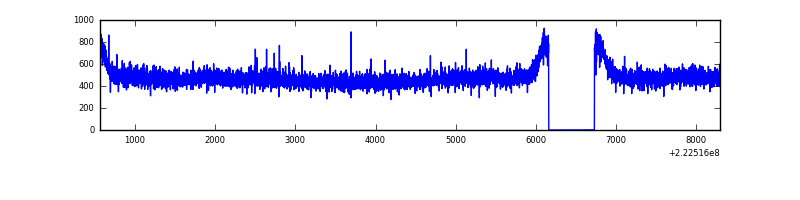 |
| B | 7730 | 7160 | 2 | 2 | 0.03% | 0.03% | 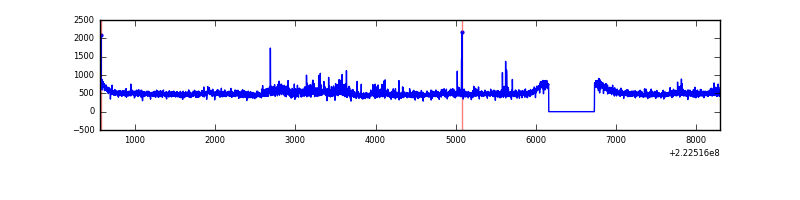 |
| C | 7730 | 7160 | 1 | 1 | 0.01% | 0.01% | 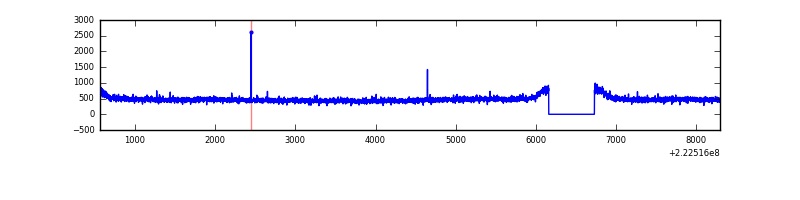 |
| D | 7730 | 7160 | 2 | 2 | 0.03% | 0.03% | 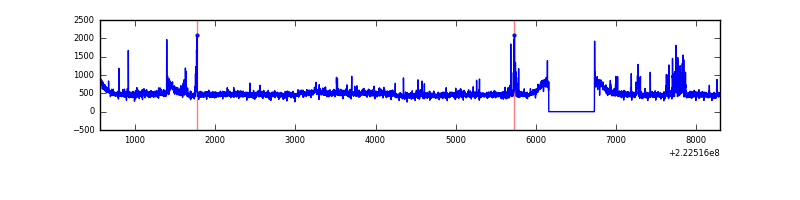 |
Top three noisy pixels from each quadrant. If the there are fewer than three noisy pixels in the level2.evt file, extra rows are filled as -1
| Pixel properties | Quadrant properties | ||||||
|---|---|---|---|---|---|---|---|
| Quadrant | DetID | PixID | Counts | Sigma | Mean | Median | Sigma |
| A | 0 | 226 | 8293 | 40.98 | 882 | 861 | 181.4 |
| A | 12 | 194 | 7859 | 38.58 | 882 | 861 | 181.4 |
| A | 3 | 1 | 7802 | 38.27 | 882 | 861 | 181.4 |
| B | 0 | 219 | 111177 | 644.6 | 891 | 871 | 171.1 |
| B | 0 | 214 | 78761 | 455.17 | 891 | 871 | 171.1 |
| B | 12 | 111 | 17536 | 97.39 | 891 | 871 | 171.1 |
| C | 8 | 128 | 13592 | 63.2 | 861 | 867 | 201.3 |
| C | 4 | 254 | 8822 | 39.51 | 861 | 867 | 201.3 |
| C | 9 | 68 | 8692 | 38.86 | 861 | 867 | 201.3 |
| D | 1 | 20 | 178164 | 842.05 | 857 | 830 | 210.6 |
| D | 2 | 136 | 106599 | 502.23 | 857 | 830 | 210.6 |
| D | 5 | 97 | 49945 | 233.22 | 857 | 830 | 210.6 |
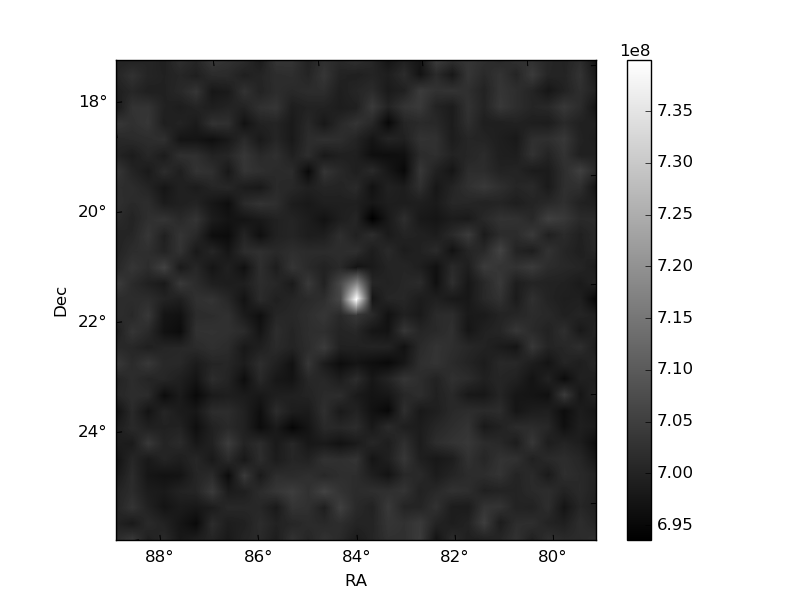
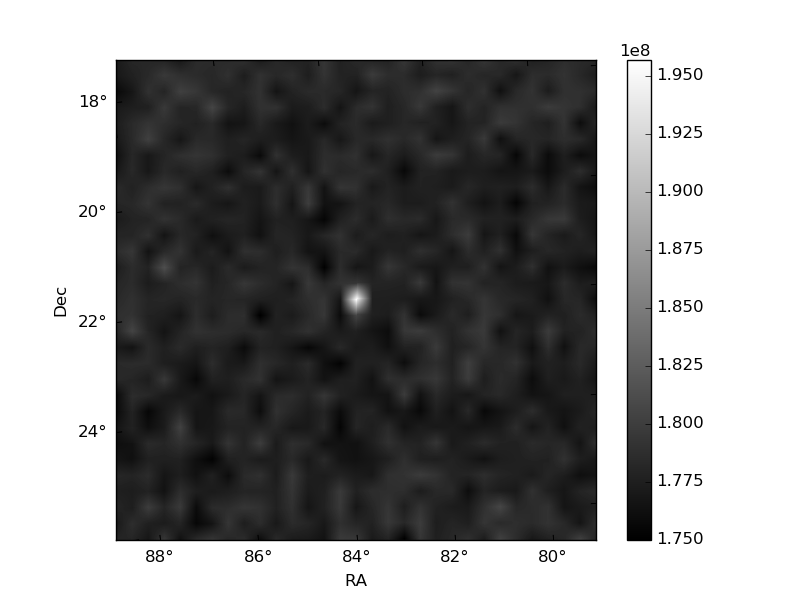
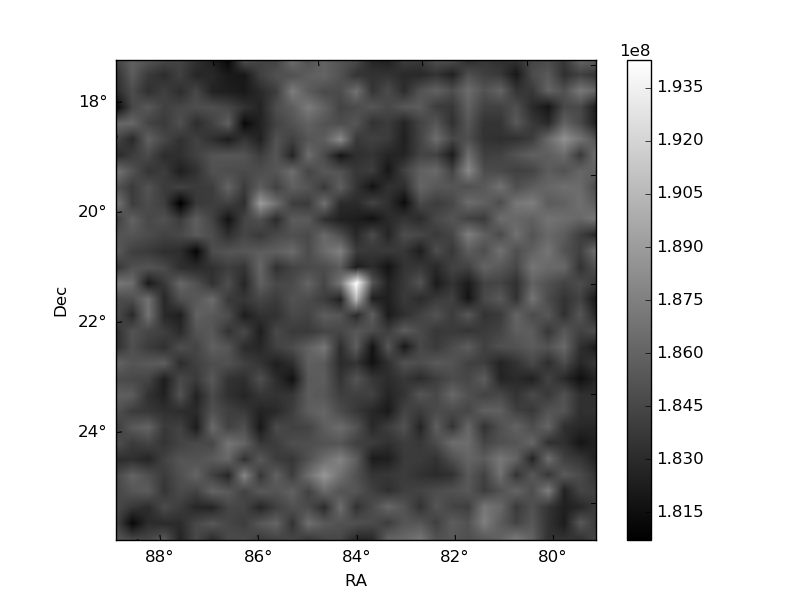
Histogram calculated using DETX and DETY for each event in the final _common_clean file
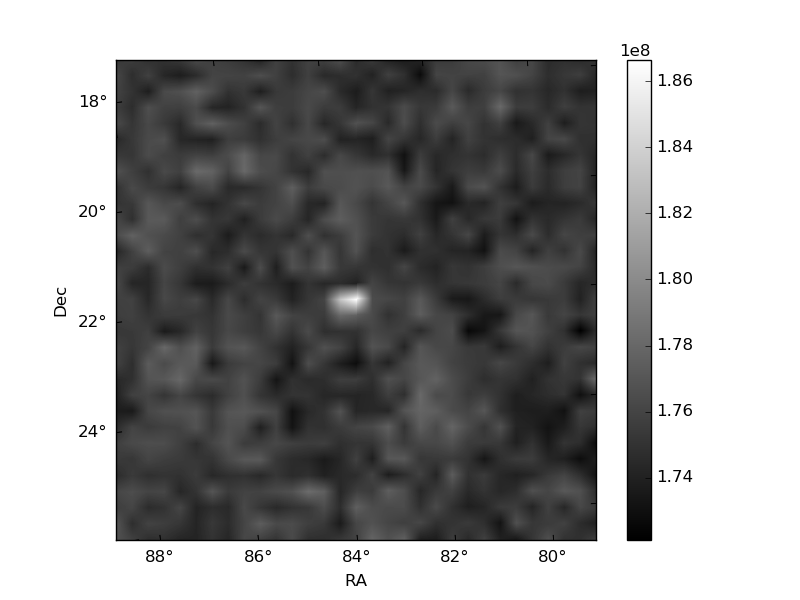
| Quadrant A | 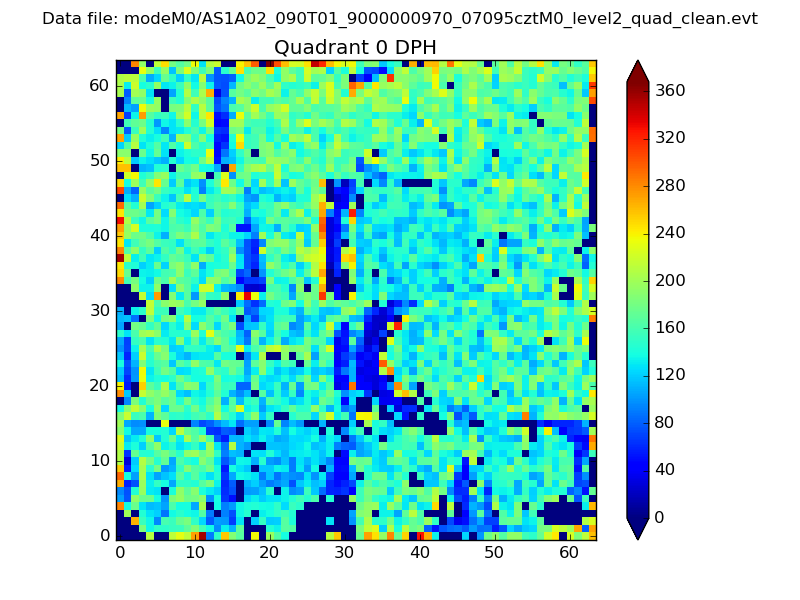 |
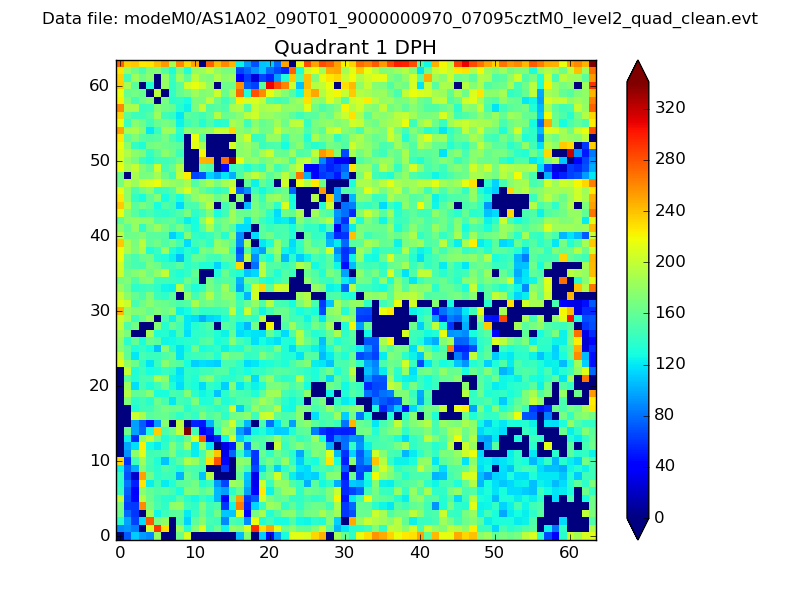 |
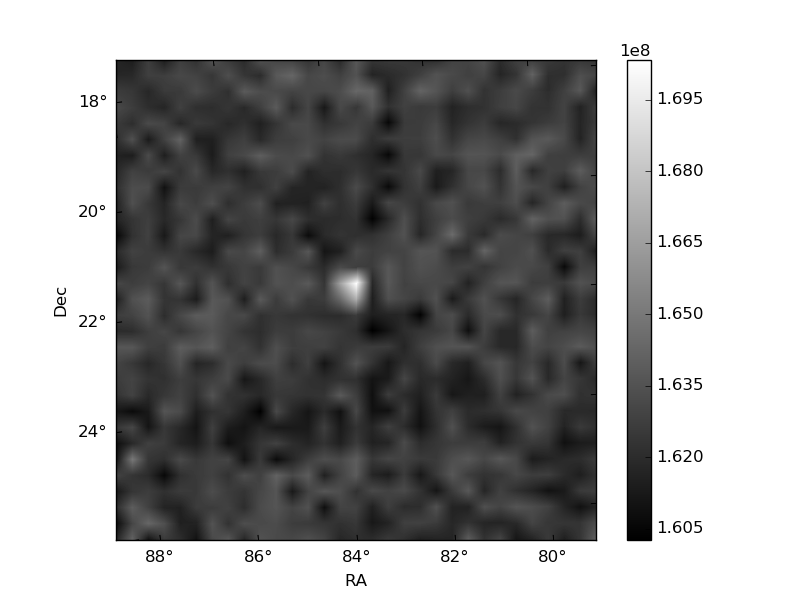
Quadrant B |
|---|---|---|---|
| Quadrant D | 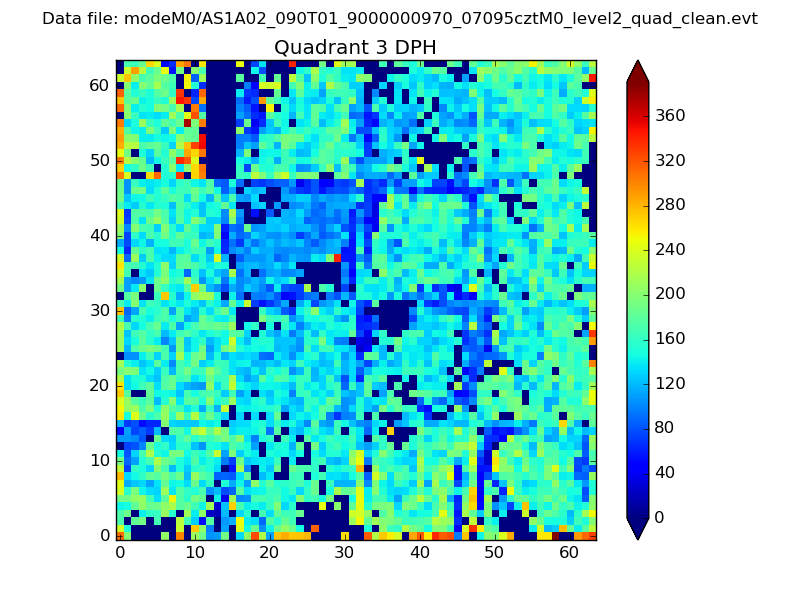 |
 |
Quadrant C |
| Plot type | Count rate plots | Images |
|---|---|---|
| Comparison with Poisson distribution Blue bars denote a histogram of data divided into 1 sec bins. Red curve is a Poisson curve with rate = median count rate of data. |
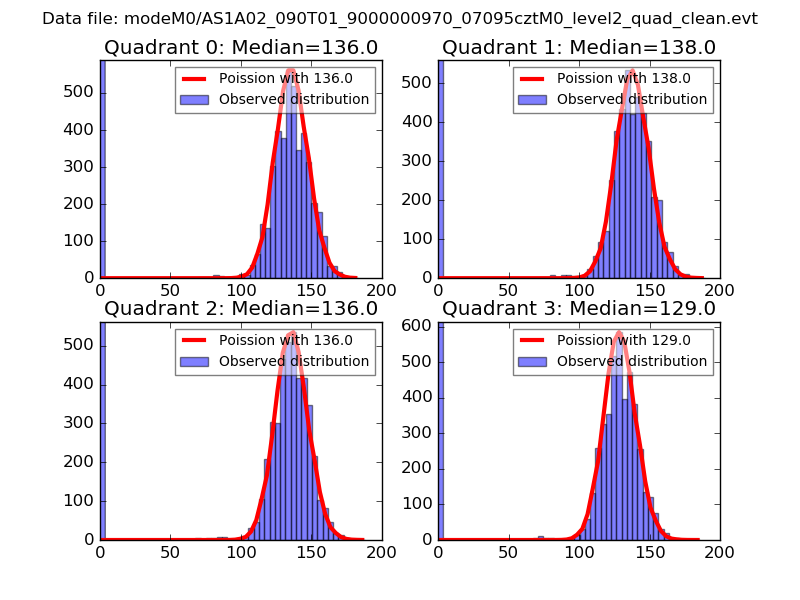 |
 |
| Quadrant-wise count rates Data is divided into 100 sec bins |
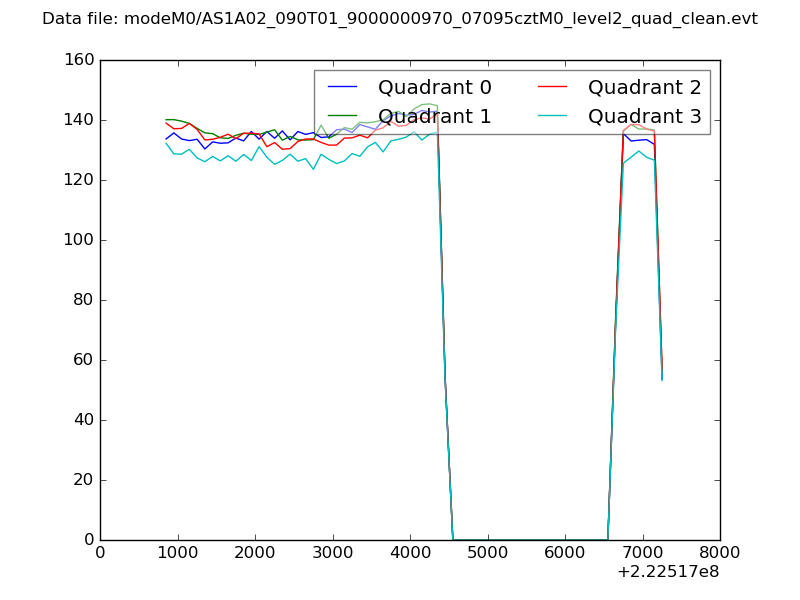 |
|
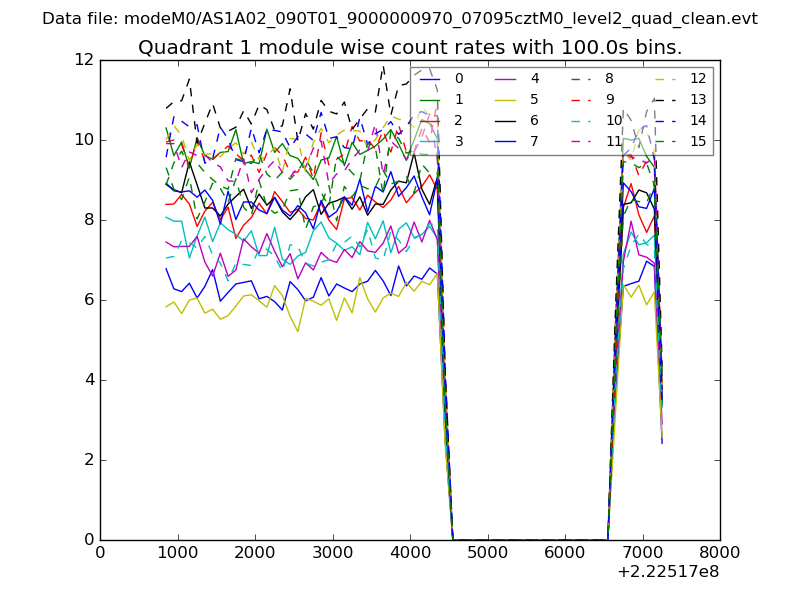
| Module-wise count rates for Quadrant A Data is divided into 100 sec bins |
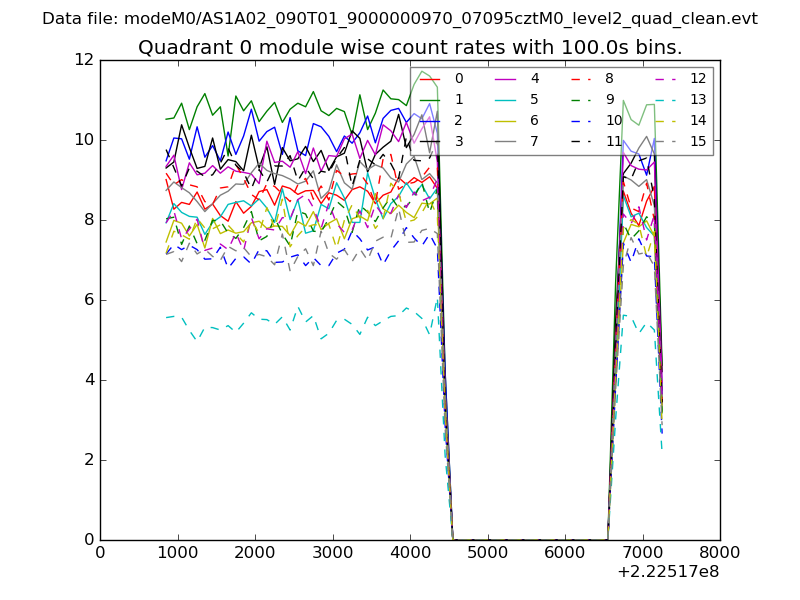 |
 |
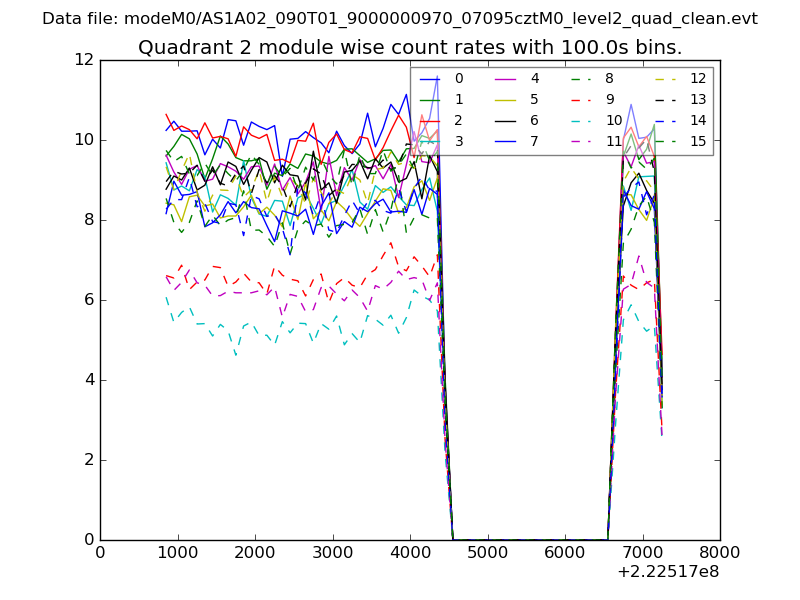
| Module-wise count rates for Quadrant B Data is divided into 100 sec bins |
 |
 |
| Module-wise count rates for Quadrant C Data is divided into 100 sec bins |
 |
 |
| Module-wise count rates for Quadrant D Data is divided into 100 sec bins |
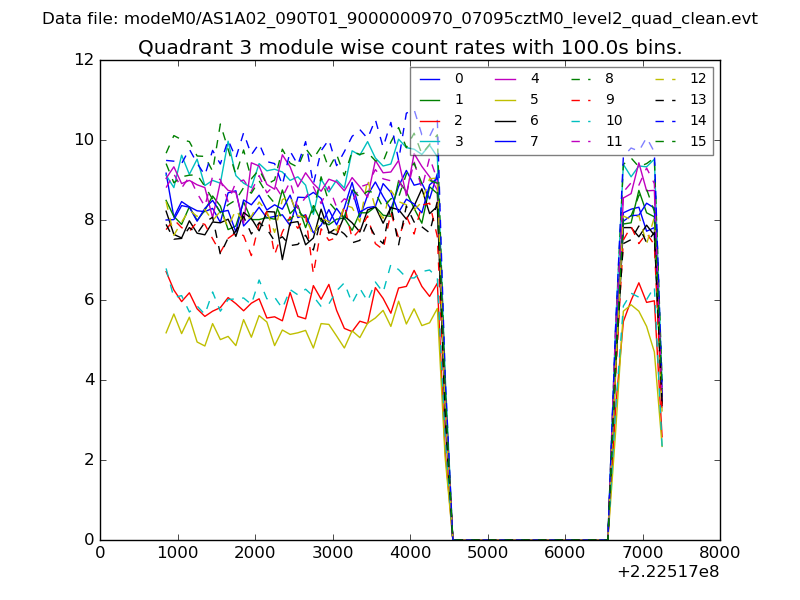 |
 |
| Parameter | Plot |
|---|---|
| CZT HV Monitor | 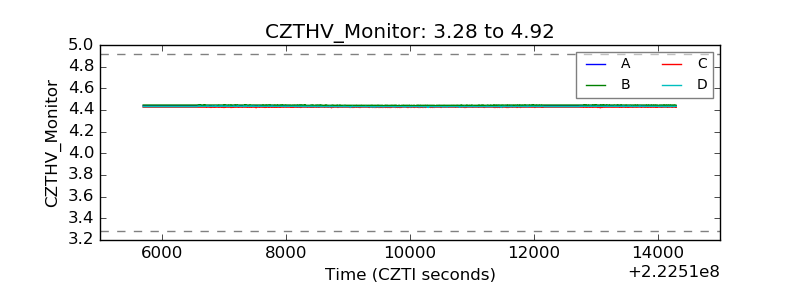 |
| D_VDD | 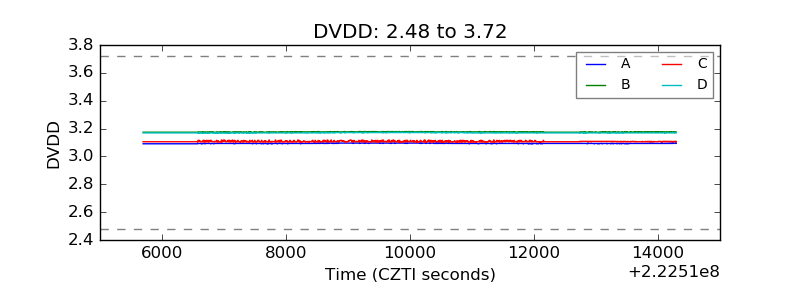 |
| Temperature 1 | 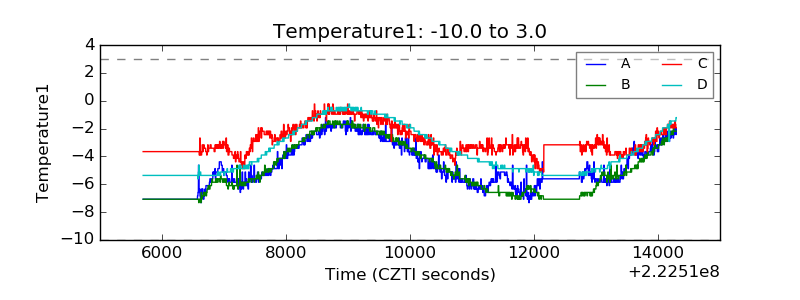 |
| Veto HV Monitor | 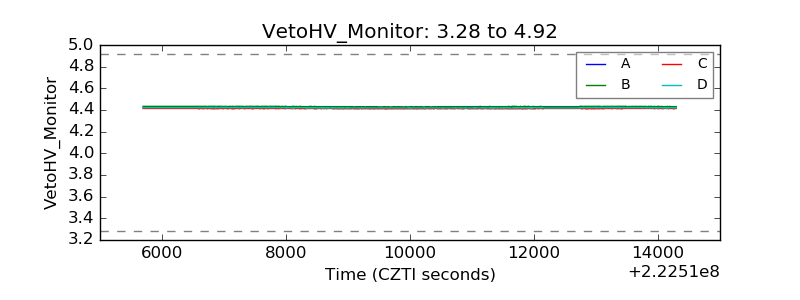 |
| Veto LLD | 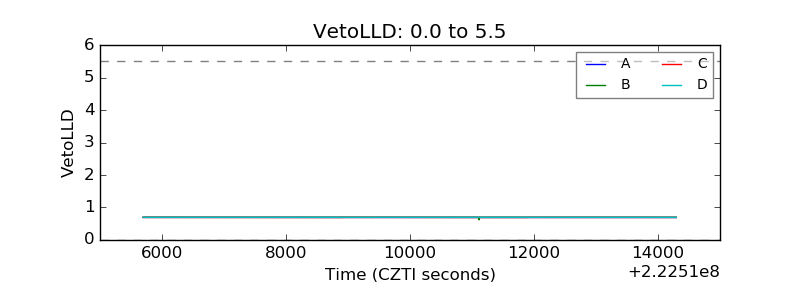 |
| Alpha Counter | 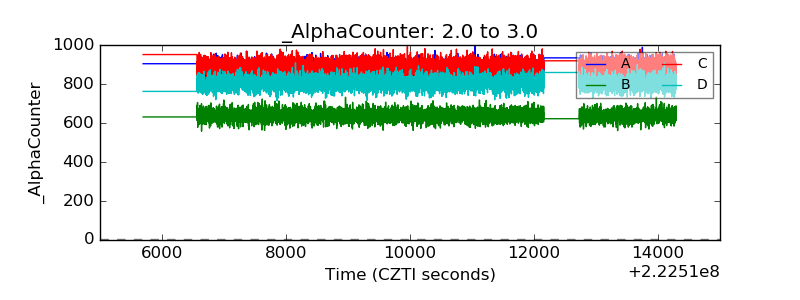 |
| _CPM_Rate | 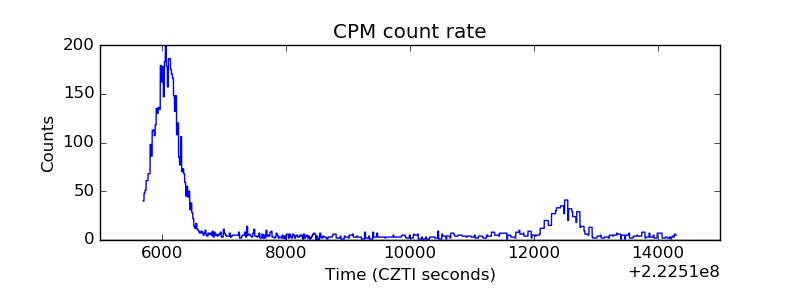 |
| CZT Counter | 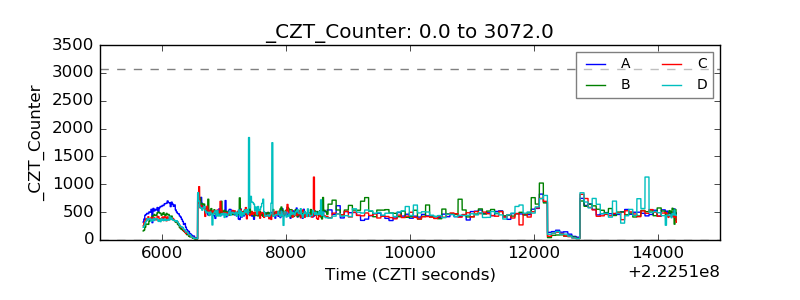 |
| +2.5 Volts monitor |  |
| +5 Volts monitor |  |
| _ROLL_ROT |  |
| _Roll_DEC |  |
| _Roll_RA | 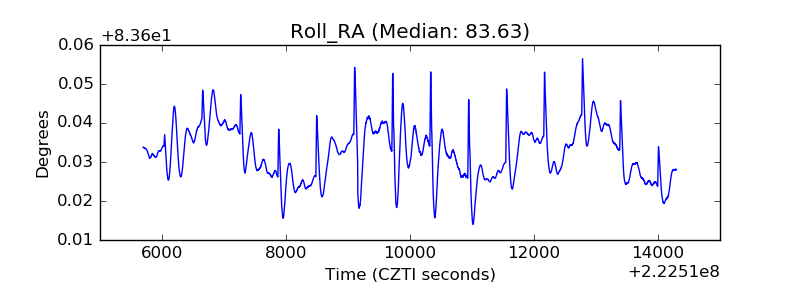 |
| Veto Counter | 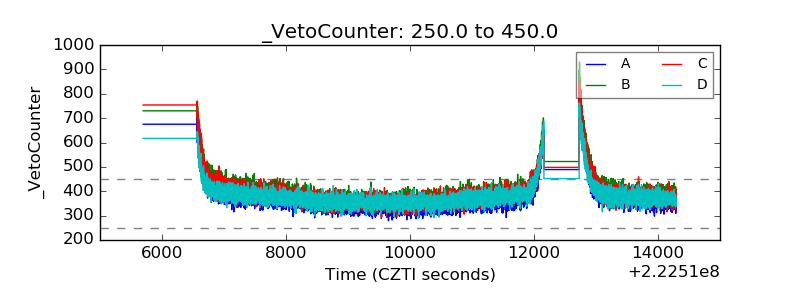 |