| Param | Original file | Final file |
|---|---|---|
| Filename | modeM0/AS1A02_090T01_9000000970_07096cztM0_level2.evt | modeM0/AS1A02_090T01_9000000970_07096cztM0_level2_quad_clean.evt |
| Size (bytes) | 542,085,120 | 99,164,160 |
| Size | 517.0 MB | 94.6 MB |
| Events in quadrant A | 3,730,748 | 622,922 |
| Events in quadrant B | 4,073,794 | 627,071 |
| Events in quadrant C | 3,878,811 | 623,393 |
| Events in quadrant D | 4,208,544 | 592,023 |
| Mode M0 | |||
|---|---|---|---|
| Quadrant | BADHDUFLAG | Total packets | Discarded packets |
| A | 0 | 16161 | 4 |
| B | 0 | 16890 | 3 |
| C | 0 | 16729 | 3 |
| D | 0 | 17536 | 3 |
| Mode M9 | |||
|---|---|---|---|
| Quadrant | BADHDUFLAG | Total packets | Discarded packets |
| A | 0 | 6 | 0 |
| B | 0 | 6 | 0 |
| C | 0 | 6 | 0 |
| D | 0 | 6 | 0 |
| Mode SS | |||
|---|---|---|---|
| Quadrant | BADHDUFLAG | Total packets | Discarded packets |
| A | 0 | 156 | 0 |
| B | 0 | 156 | 0 |
| C | 0 | 156 | 0 |
| D | 0 | 156 | 0 |
| Quadrant | Total seconds | Saturated seconds | Saturation percentage |
|---|---|---|---|
| A | 7733 | 366 | 4.732963% |
| B | 7733 | 402 | 5.198500% |
| C | 7733 | 281 | 3.633777% |
| D | 7733 | 422 | 5.457132% |
Noise dominated data is calculated using 1-second bins in cleaned event files. If a bin has >2000 counts, and if more than 50% of those come from <1% of pixels, then it is considered to be noise-dominated and hence unusable.
| Quadrant | # 1 sec bins | Bins with >0 counts | Bins with >2000 counts | High rate bins dominated by noise | Noise dominated (total time) | Noise dominated (detector-on time) | Marked lightcurve |
|---|---|---|---|---|---|---|---|
| A | 7844 | 7734 | 0 | 0 | 0.00% | 0.00% | 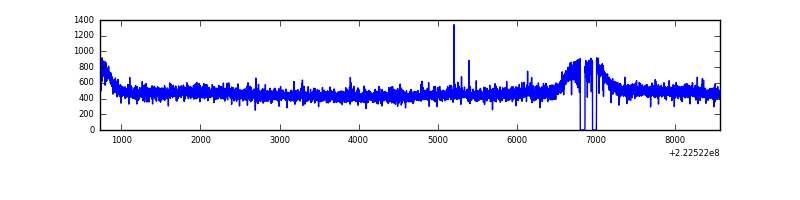 |
| B | 7843 | 7733 | 6 | 6 | 0.08% | 0.08% | 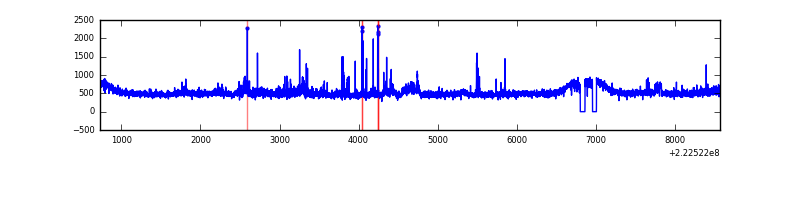 |
| C | 7843 | 7734 | 18 | 18 | 0.23% | 0.23% | 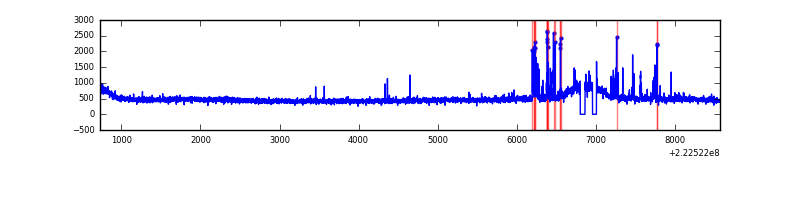 |
| D | 7843 | 7733 | 51 | 51 | 0.65% | 0.66% | 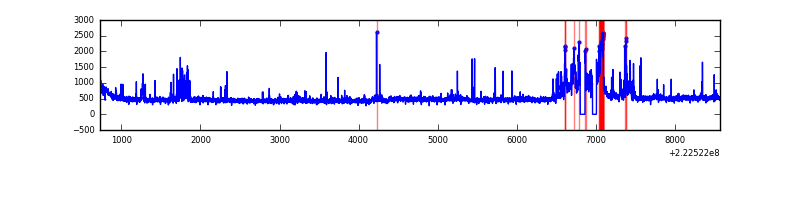 |
Top three noisy pixels from each quadrant. If the there are fewer than three noisy pixels in the level2.evt file, extra rows are filled as -1
| Pixel properties | Quadrant properties | ||||||
|---|---|---|---|---|---|---|---|
| Quadrant | DetID | PixID | Counts | Sigma | Mean | Median | Sigma |
| A | 0 | 226 | 9171 | 41.12 | 965 | 941 | 200.1 |
| A | 3 | 1 | 8905 | 39.79 | 965 | 941 | 200.1 |
| A | 12 | 194 | 8561 | 38.07 | 965 | 941 | 200.1 |
| B | 0 | 219 | 163374 | 863.61 | 972 | 949 | 188.1 |
| B | 0 | 214 | 103730 | 546.48 | 972 | 949 | 188.1 |
| B | 12 | 111 | 18984 | 95.89 | 972 | 949 | 188.1 |
| C | 4 | 254 | 188991 | 859.03 | 941 | 950 | 218.9 |
| C | 1 | 3 | 10001 | 41.35 | 941 | 950 | 218.9 |
| C | 13 | 61 | 7451 | 29.7 | 941 | 950 | 218.9 |
| D | 2 | 14 | 358258 | 1562.89 | 924 | 896 | 228.7 |
| D | 1 | 20 | 157160 | 683.4 | 924 | 896 | 228.7 |
| D | 2 | 136 | 96857 | 419.68 | 924 | 896 | 228.7 |
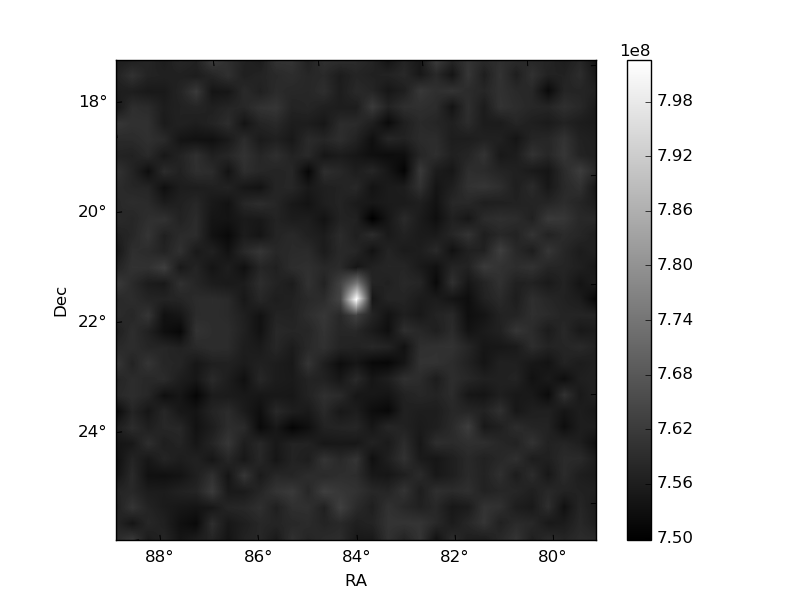
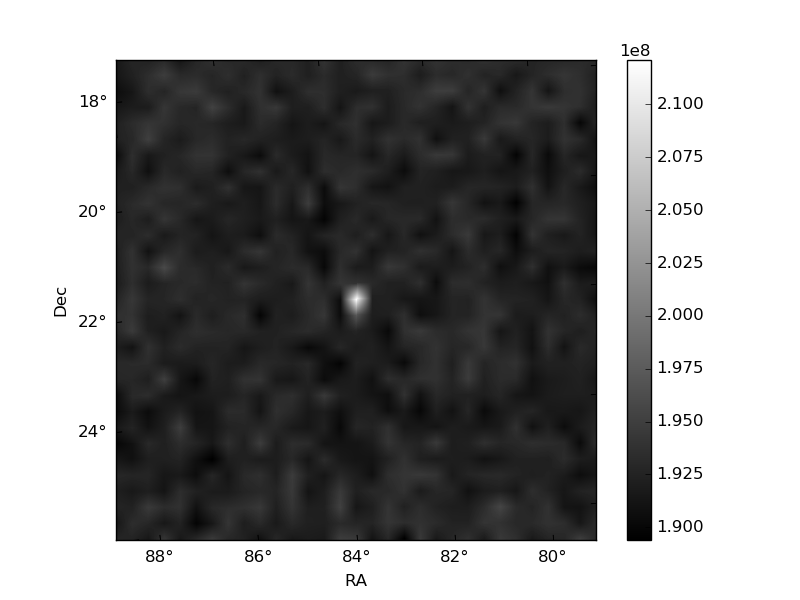
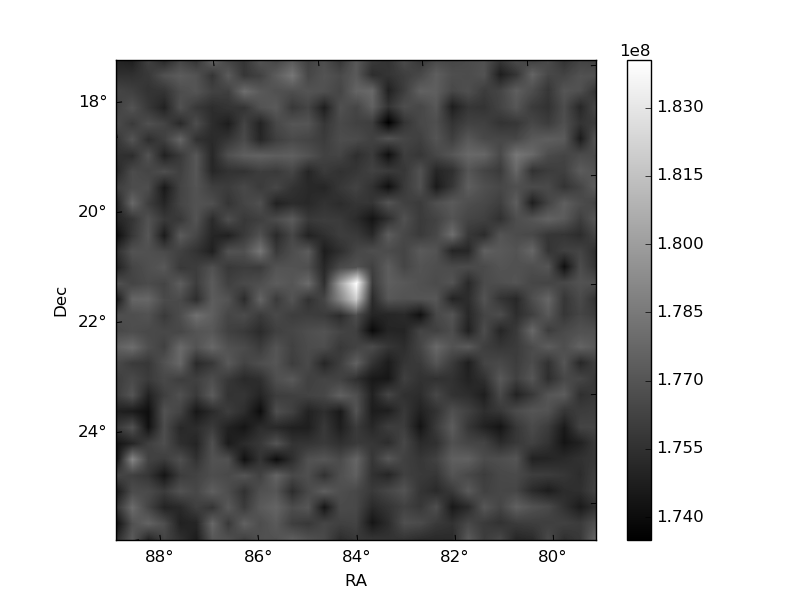
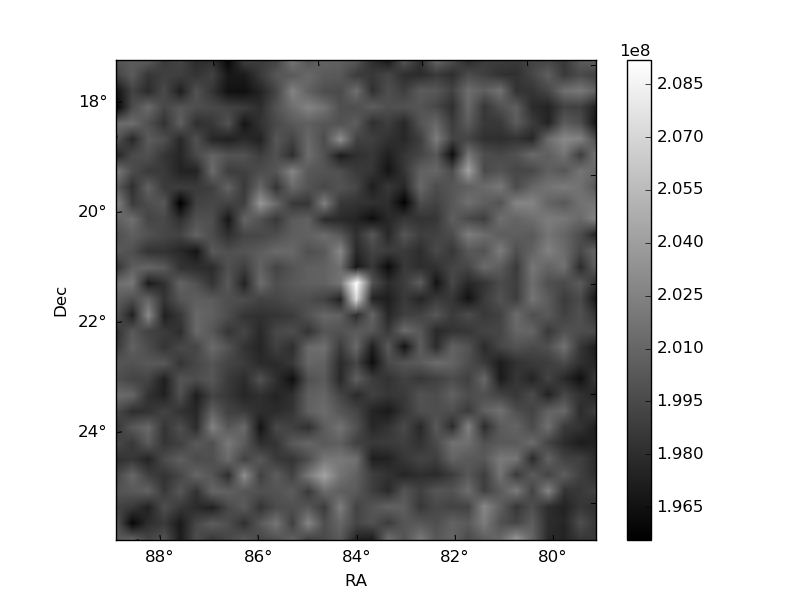
Histogram calculated using DETX and DETY for each event in the final _common_clean file
| Quadrant A | 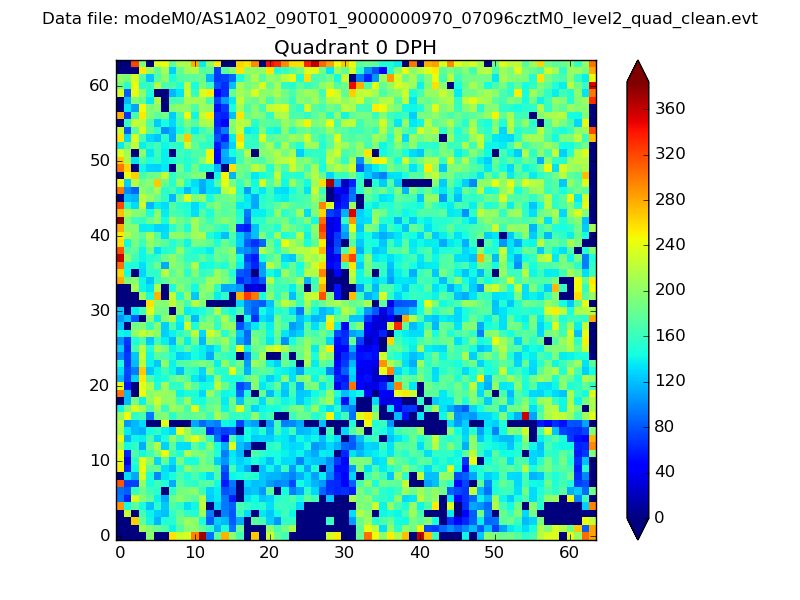 |
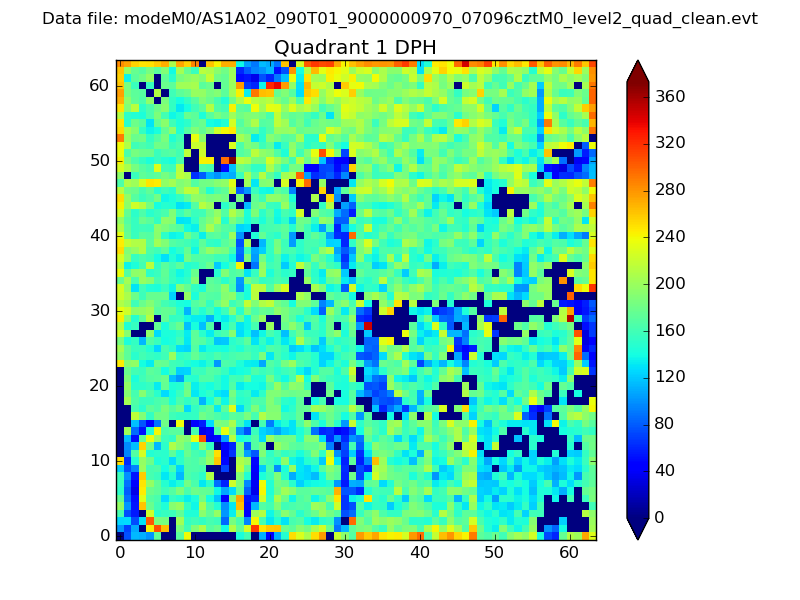 |
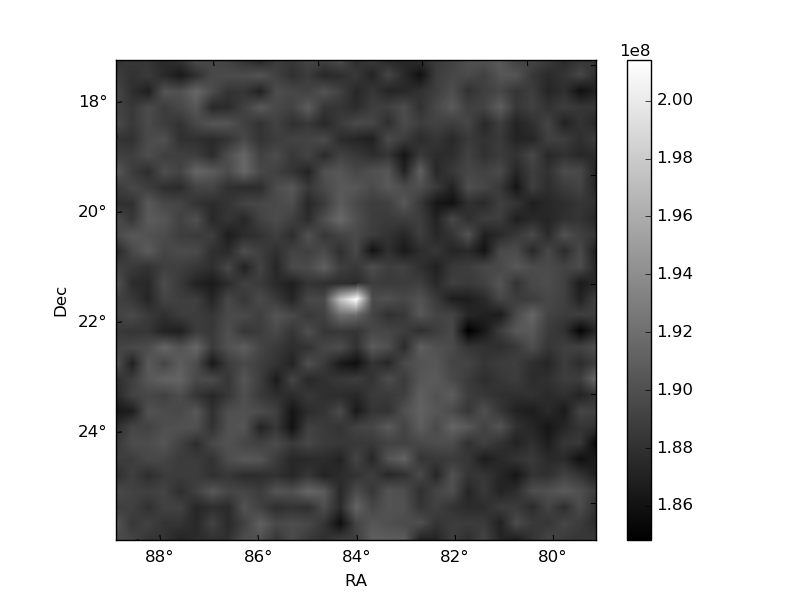
Quadrant B |
|---|---|---|---|
| Quadrant D | 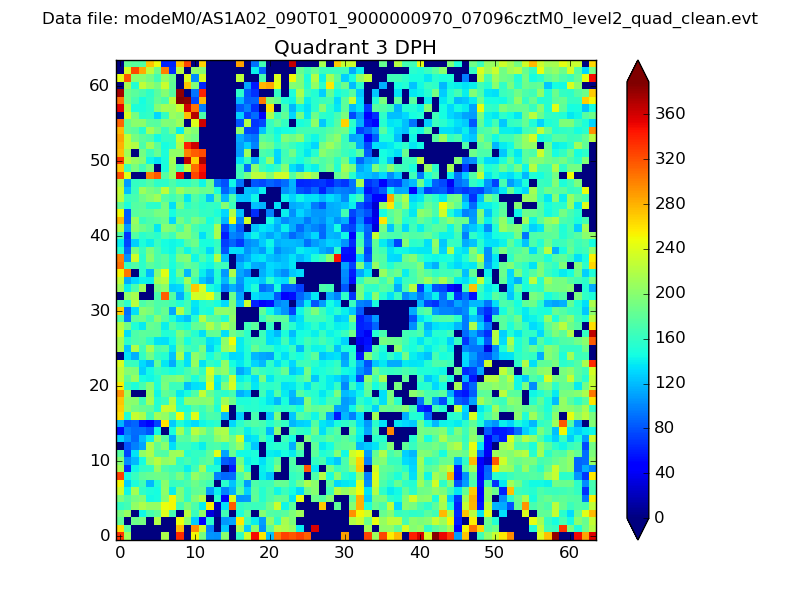 |
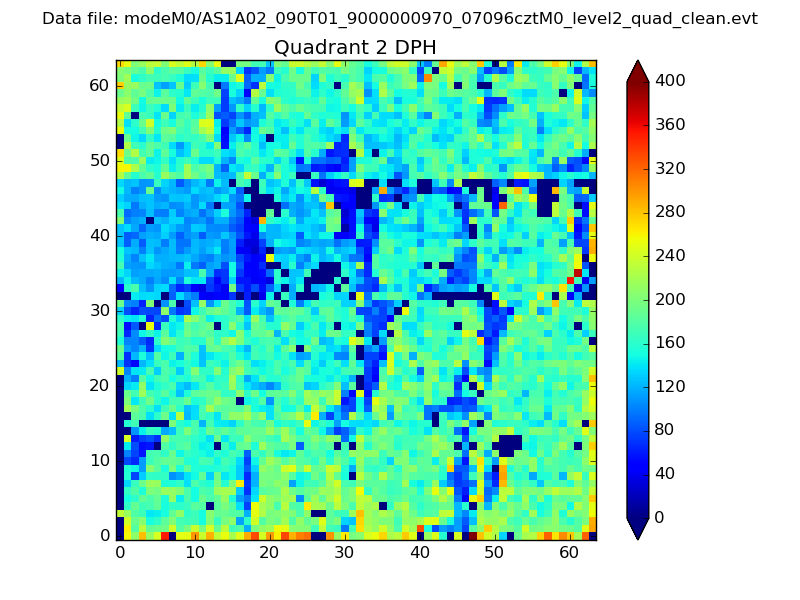 |
Quadrant C |
| Plot type | Count rate plots | Images |
|---|---|---|
| Comparison with Poisson distribution Blue bars denote a histogram of data divided into 1 sec bins. Red curve is a Poisson curve with rate = median count rate of data. |
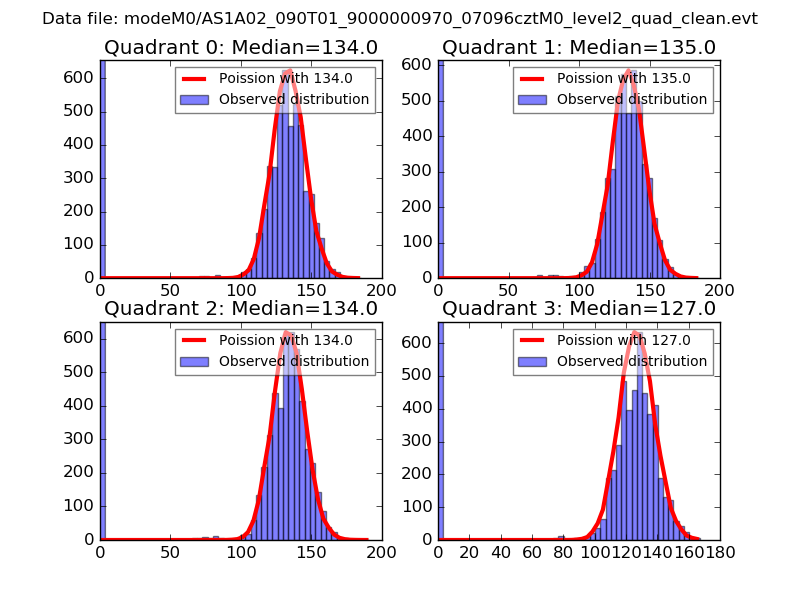 |
 |
| Quadrant-wise count rates Data is divided into 100 sec bins |
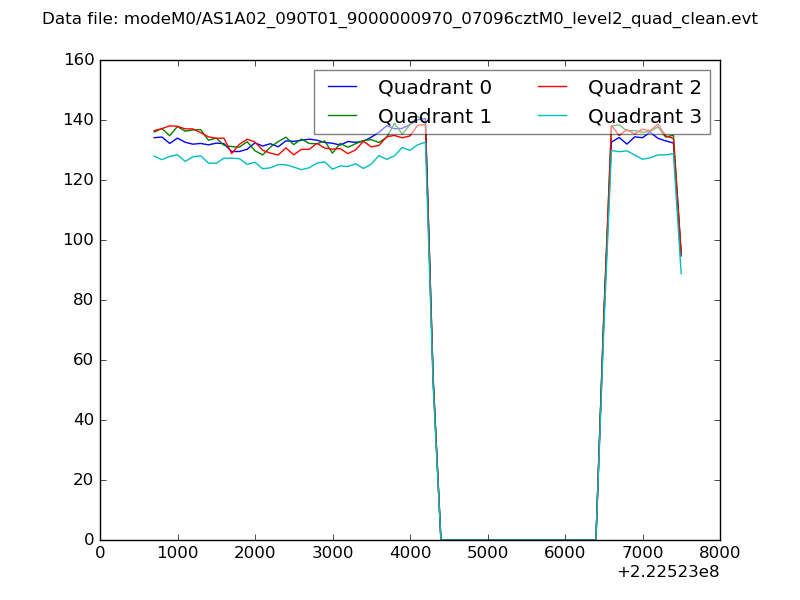 |
|
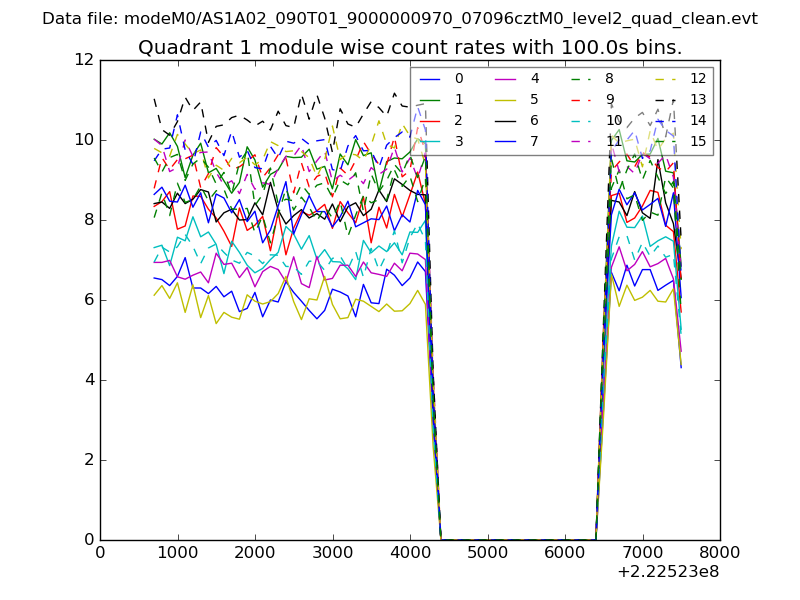
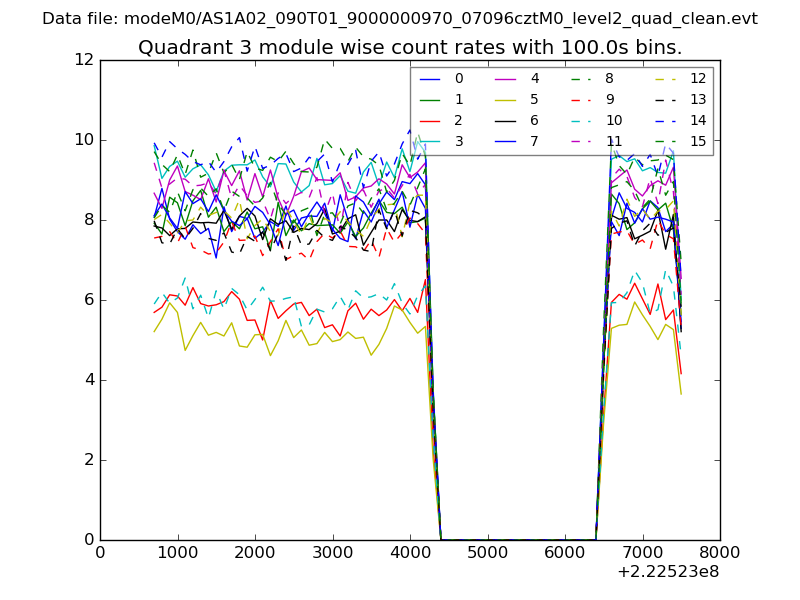
| Module-wise count rates for Quadrant A Data is divided into 100 sec bins |
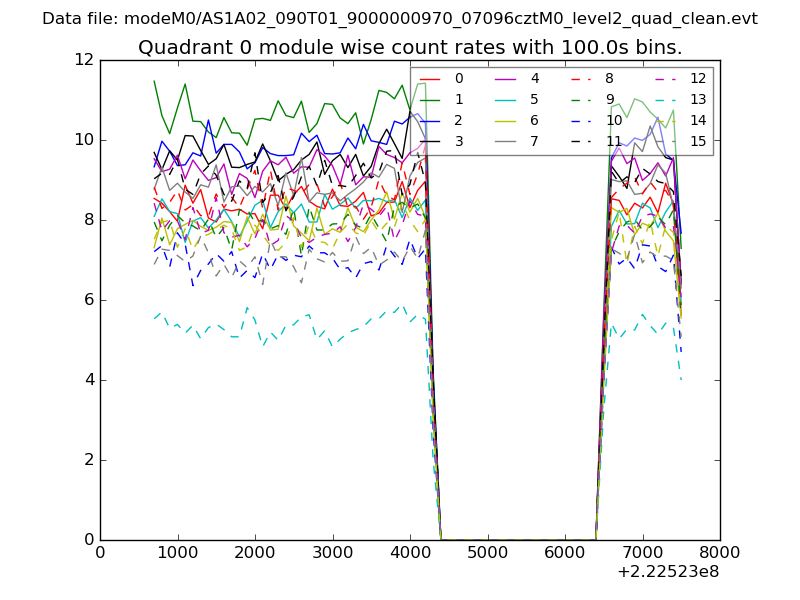 |
 |
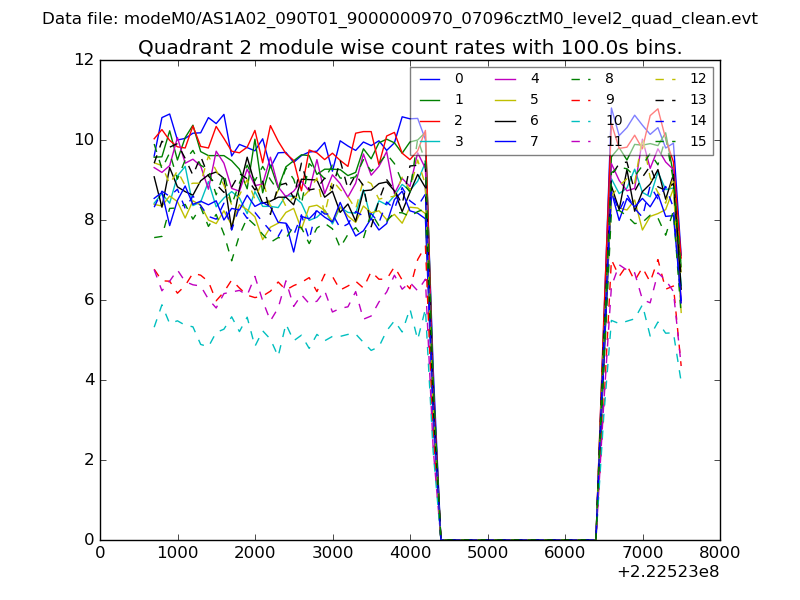
| Module-wise count rates for Quadrant B Data is divided into 100 sec bins |
 |
 |
| Module-wise count rates for Quadrant C Data is divided into 100 sec bins |
 |
 |
| Module-wise count rates for Quadrant D Data is divided into 100 sec bins |
 |
 |
| Parameter | Plot |
|---|---|
| CZT HV Monitor | 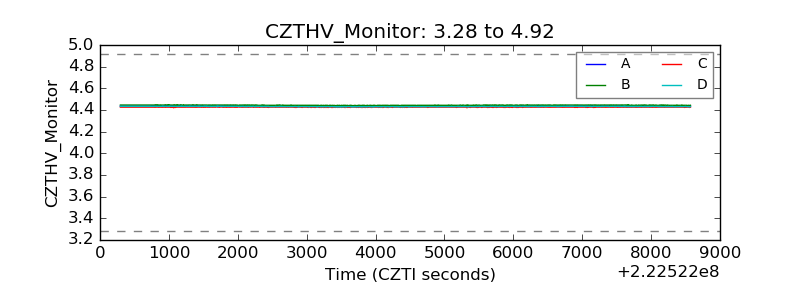 |
| D_VDD | 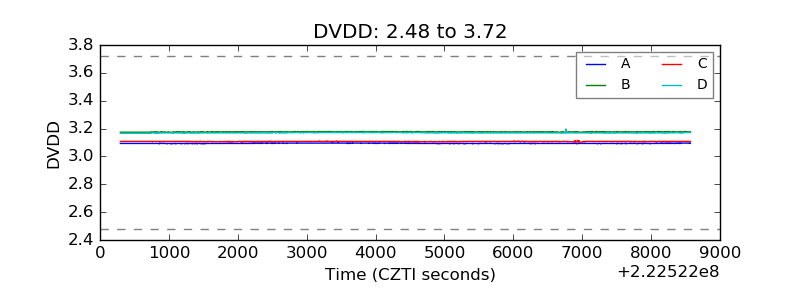 |
| Temperature 1 | 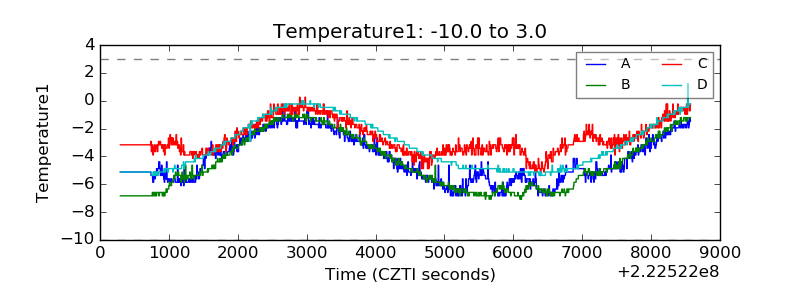 |
| Veto HV Monitor | 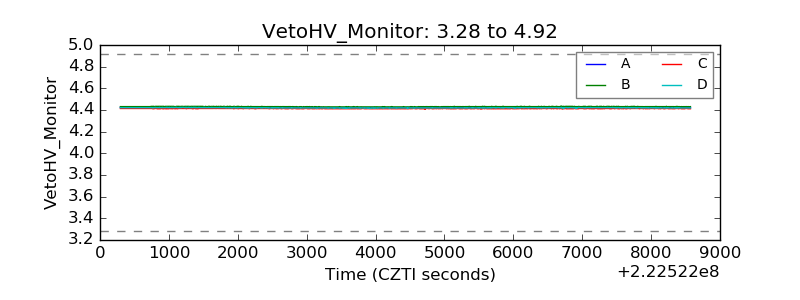 |
| Veto LLD | 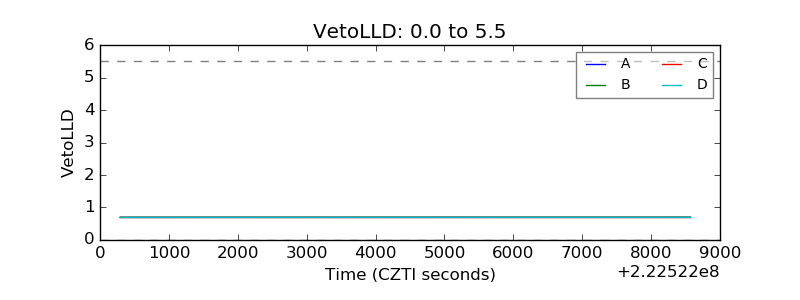 |
| Alpha Counter | 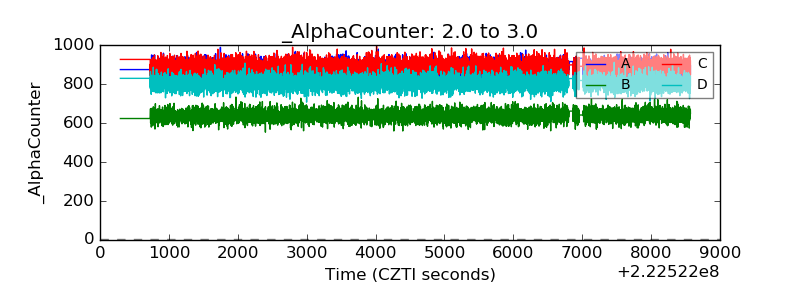 |
| _CPM_Rate | 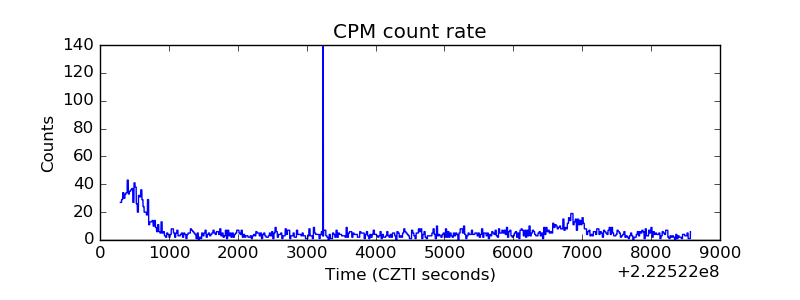 |
| CZT Counter | 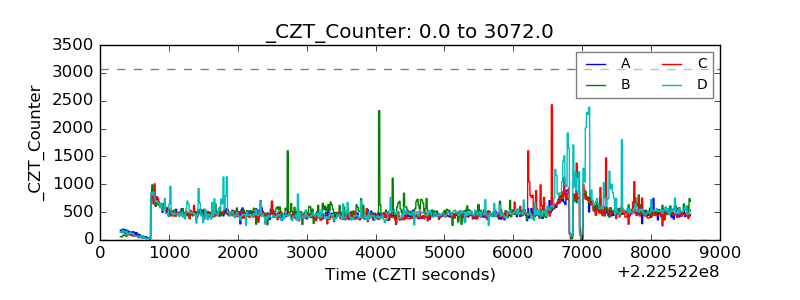 |
| +2.5 Volts monitor |  |
| +5 Volts monitor |  |
| _ROLL_ROT | 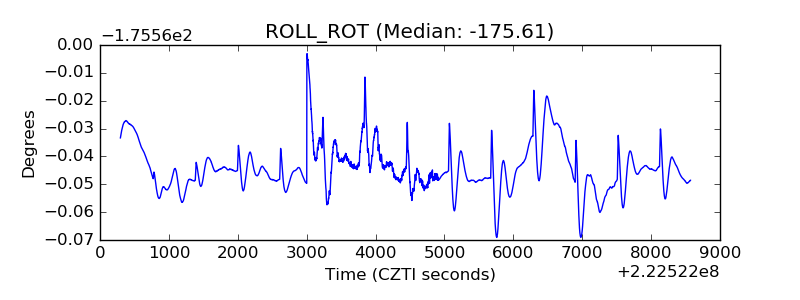 |
| _Roll_DEC | 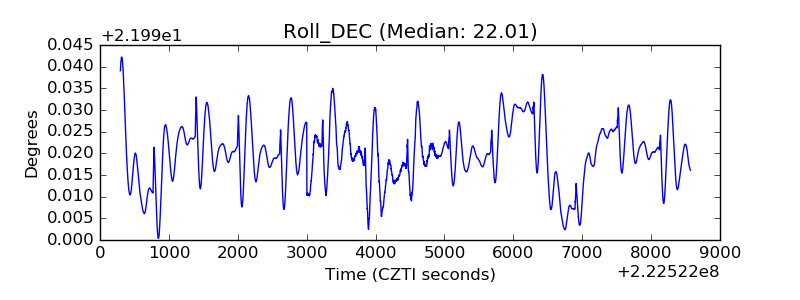 |
| _Roll_RA | 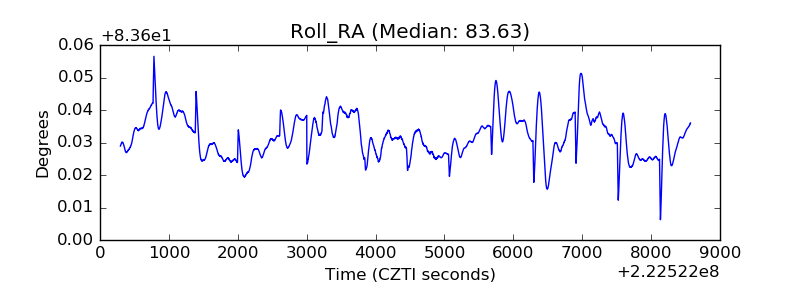 |
| Veto Counter | 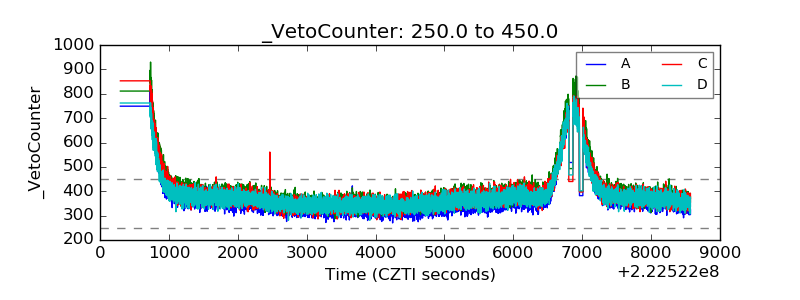 |