| Param | Original file | Final file |
|---|---|---|
| Filename | modeM0/AS1A02_090T01_9000000970_07097cztM0_level2.evt | modeM0/AS1A02_090T01_9000000970_07097cztM0_level2_quad_clean.evt |
| Size (bytes) | 480,274,560 | 100,327,680 |
| Size | 458.0 MB | 95.7 MB |
| Events in quadrant A | 3,307,190 | 645,418 |
| Events in quadrant B | 3,571,032 | 651,049 |
| Events in quadrant C | 3,308,934 | 646,324 |
| Events in quadrant D | 3,886,296 | 612,263 |
| Mode M0 | |||
|---|---|---|---|
| Quadrant | BADHDUFLAG | Total packets | Discarded packets |
| A | 0 | 14431 | 2 |
| B | 0 | 14957 | 1 |
| C | 0 | 14549 | 1 |
| D | 0 | 15574 | 1 |
| Mode M9 | |||
|---|---|---|---|
| Quadrant | BADHDUFLAG | Total packets | Discarded packets |
| A | 0 | 1 | 0 |
| B | 0 | 1 | 0 |
| C | 0 | 1 | 0 |
| D | 0 | 1 | 0 |
| Mode SS | |||
|---|---|---|---|
| Quadrant | BADHDUFLAG | Total packets | Discarded packets |
| A | 0 | 140 | 0 |
| B | 0 | 140 | 0 |
| C | 0 | 140 | 0 |
| D | 0 | 140 | 0 |
| Quadrant | Total seconds | Saturated seconds | Saturation percentage |
|---|---|---|---|
| A | 6942 | 210 | 3.025065% |
| B | 6942 | 219 | 3.154710% |
| C | 6942 | 139 | 2.002305% |
| D | 6942 | 184 | 2.650533% |
Noise dominated data is calculated using 1-second bins in cleaned event files. If a bin has >2000 counts, and if more than 50% of those come from <1% of pixels, then it is considered to be noise-dominated and hence unusable.
| Quadrant | # 1 sec bins | Bins with >0 counts | Bins with >2000 counts | High rate bins dominated by noise | Noise dominated (total time) | Noise dominated (detector-on time) | Marked lightcurve |
|---|---|---|---|---|---|---|---|
| A | 7067 | 6942 | 0 | 0 | 0.00% | 0.00% | 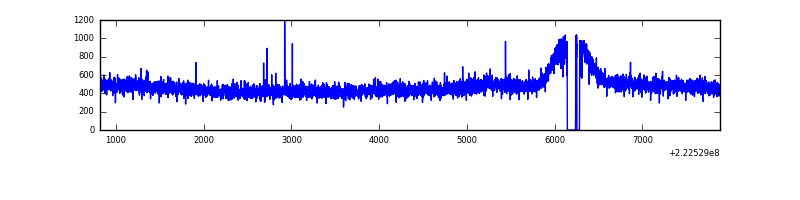 |
| B | 7067 | 6942 | 7 | 7 | 0.10% | 0.10% | 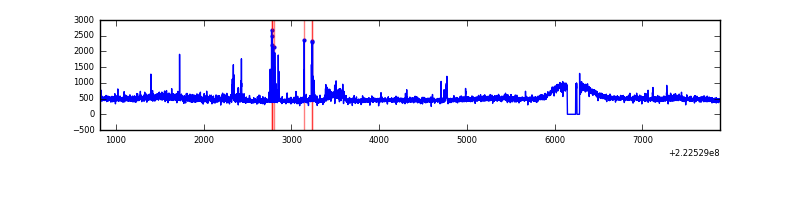 |
| C | 7067 | 6942 | 3 | 3 | 0.04% | 0.04% | 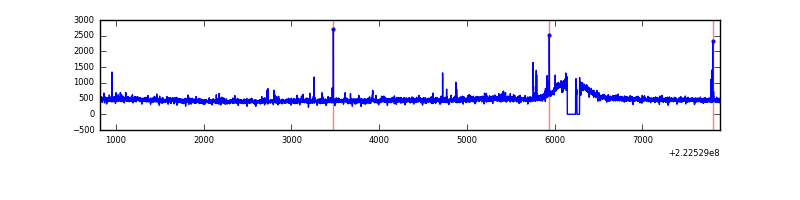 |
| D | 7067 | 6942 | 9 | 9 | 0.13% | 0.13% | 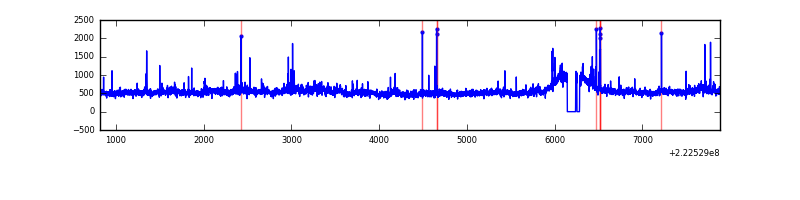 |
Top three noisy pixels from each quadrant. If the there are fewer than three noisy pixels in the level2.evt file, extra rows are filled as -1
| Pixel properties | Quadrant properties | ||||||
|---|---|---|---|---|---|---|---|
| Quadrant | DetID | PixID | Counts | Sigma | Mean | Median | Sigma |
| A | 0 | 226 | 7978 | 40.2 | 856 | 838 | 177.6 |
| A | 12 | 194 | 7699 | 38.63 | 856 | 838 | 177.6 |
| A | 13 | 14 | 5968 | 28.88 | 856 | 838 | 177.6 |
| B | 0 | 214 | 110912 | 662.51 | 858 | 836 | 166.2 |
| B | 0 | 219 | 107259 | 640.52 | 858 | 836 | 166.2 |
| B | 12 | 111 | 16072 | 91.7 | 858 | 836 | 166.2 |
| C | 4 | 254 | 63011 | 317.2 | 831 | 838 | 196.0 |
| C | 13 | 61 | 6461 | 28.69 | 831 | 838 | 196.0 |
| C | 1 | 3 | 3850 | 15.37 | 831 | 838 | 196.0 |
| D | 8 | 195 | 347522 | 1684.83 | 832 | 808 | 205.8 |
| D | 1 | 20 | 299111 | 1449.58 | 832 | 808 | 205.8 |
| D | 2 | 14 | 63833 | 306.27 | 832 | 808 | 205.8 |
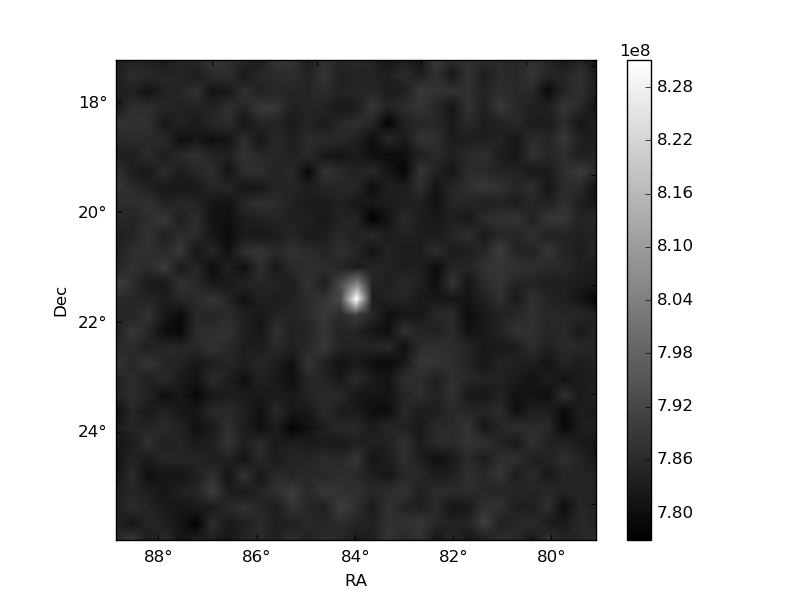
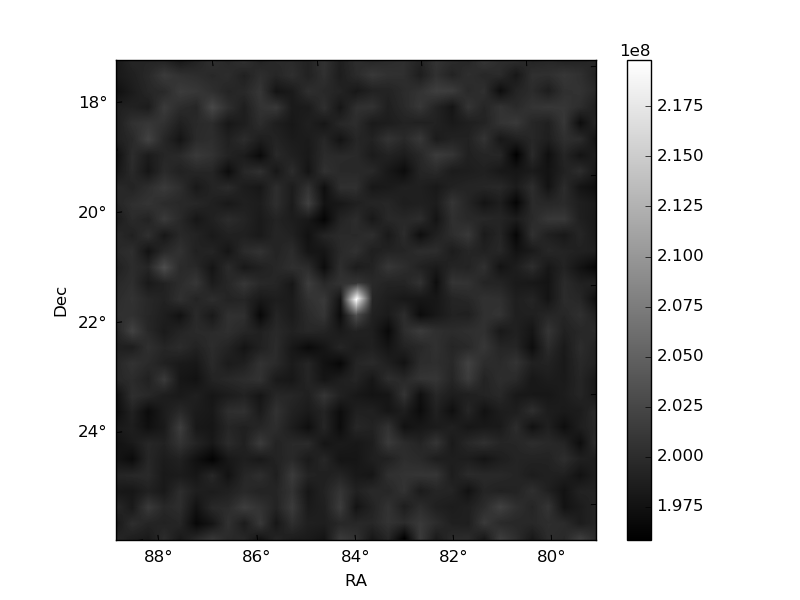
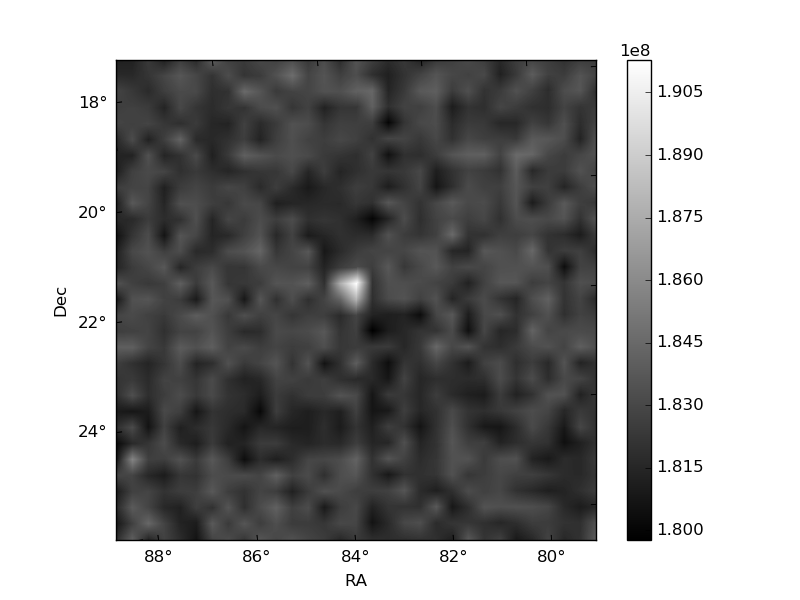
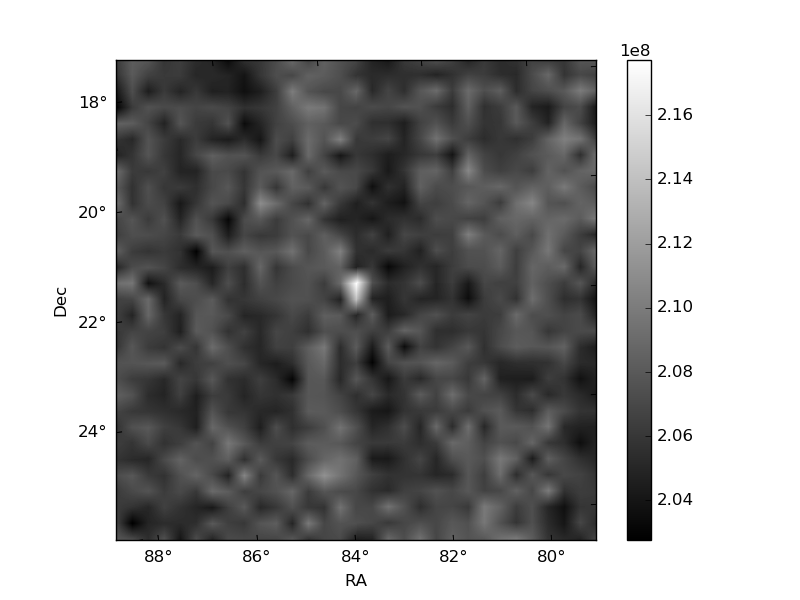
Histogram calculated using DETX and DETY for each event in the final _common_clean file
| Quadrant A | 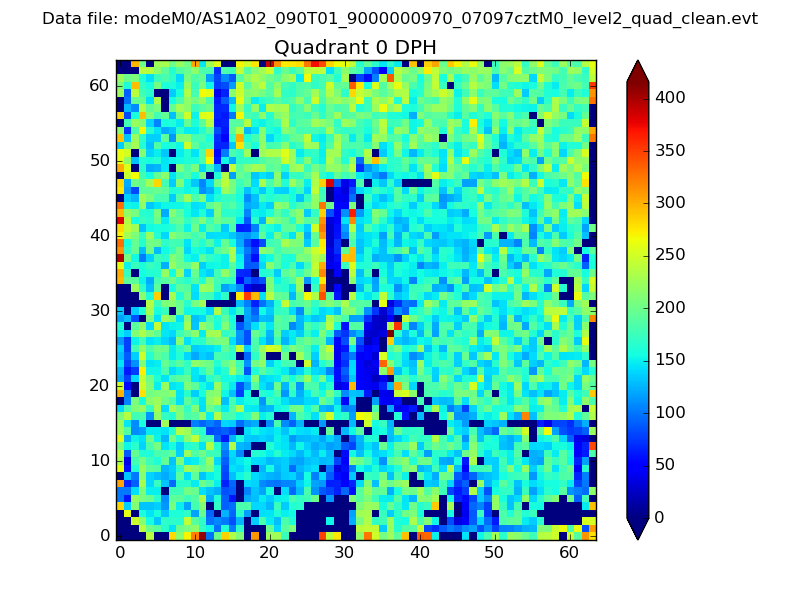 |
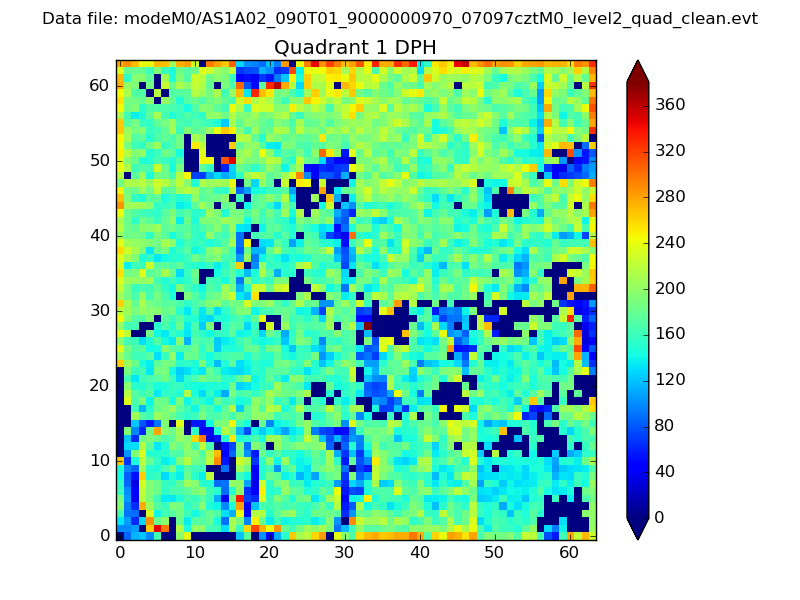 |
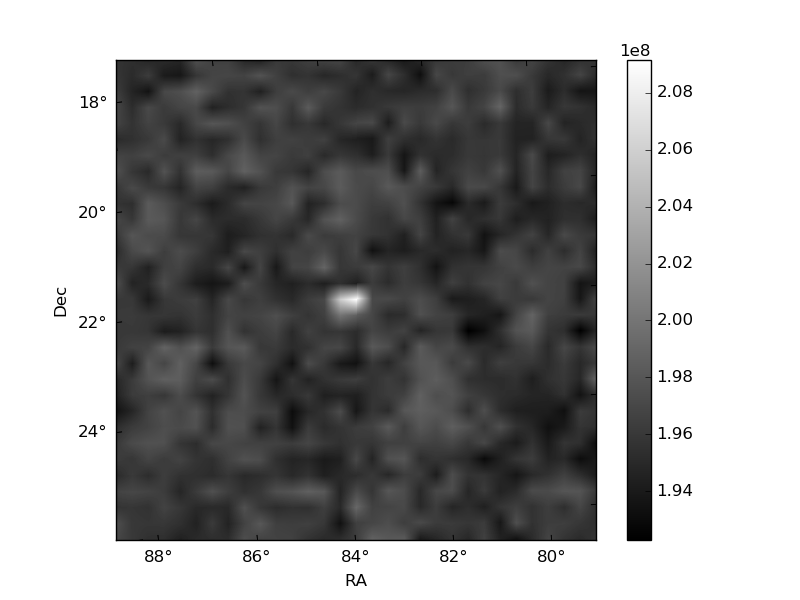
Quadrant B |
|---|---|---|---|
| Quadrant D | 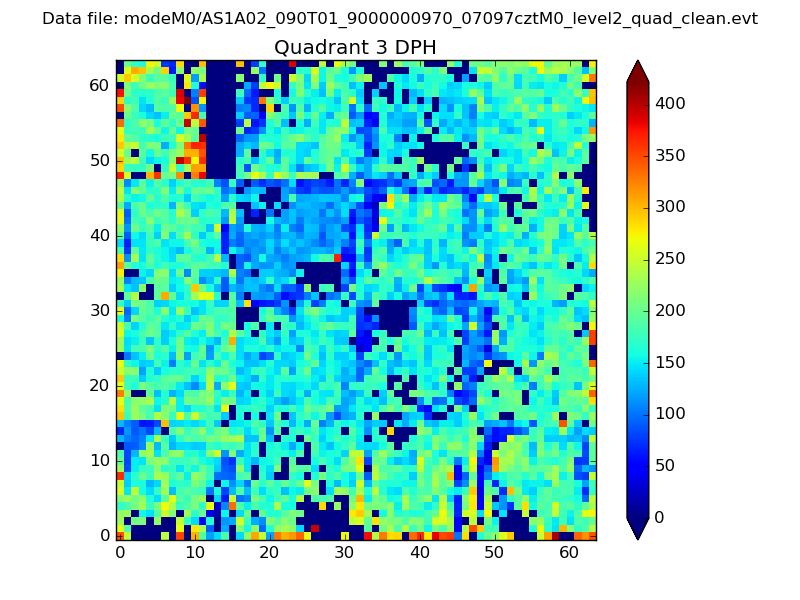 |
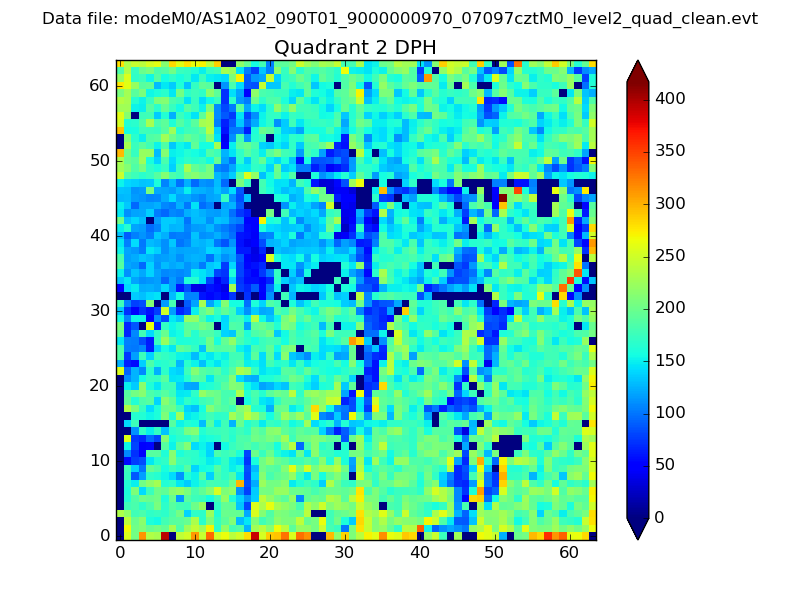 |
Quadrant C |
| Plot type | Count rate plots | Images |
|---|---|---|
| Comparison with Poisson distribution Blue bars denote a histogram of data divided into 1 sec bins. Red curve is a Poisson curve with rate = median count rate of data. |
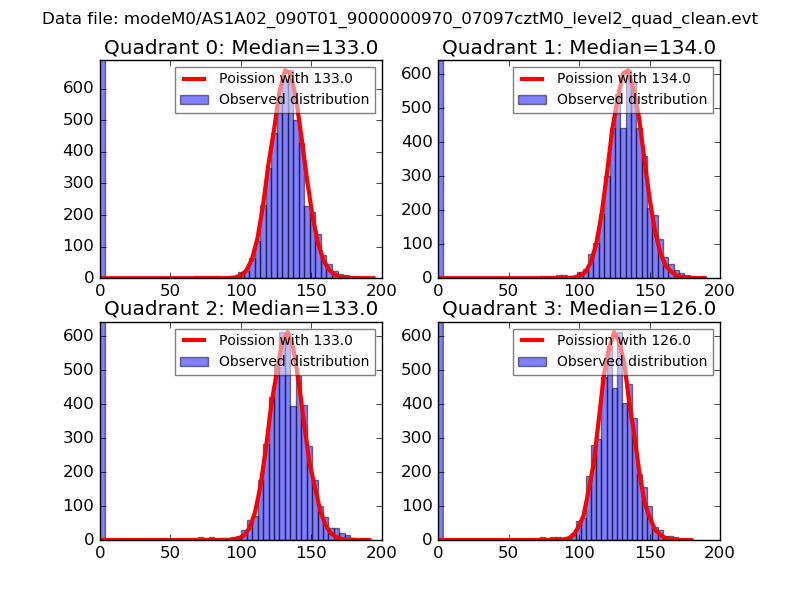 |
 |
| Quadrant-wise count rates Data is divided into 100 sec bins |
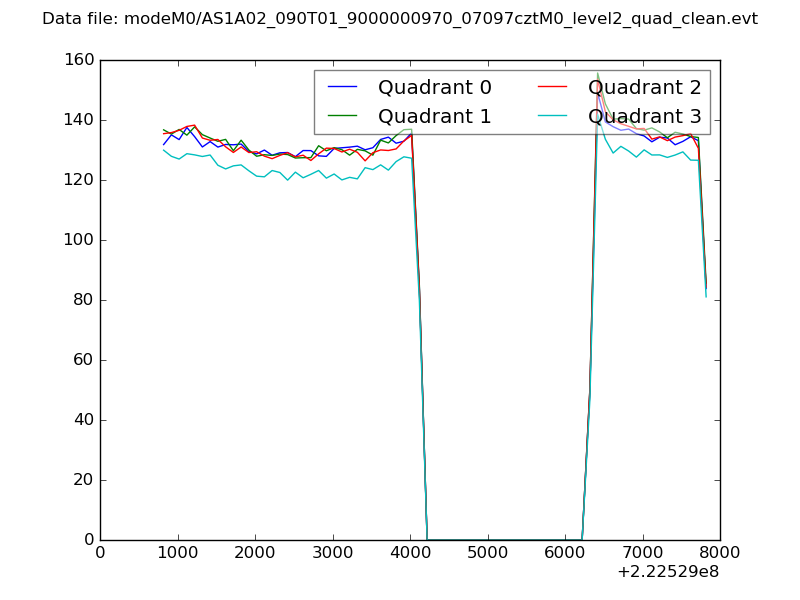 |
|
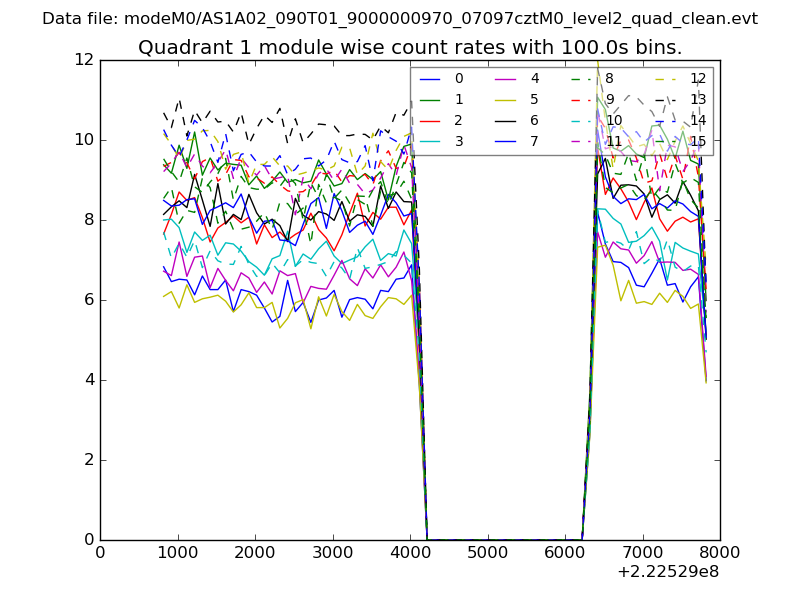
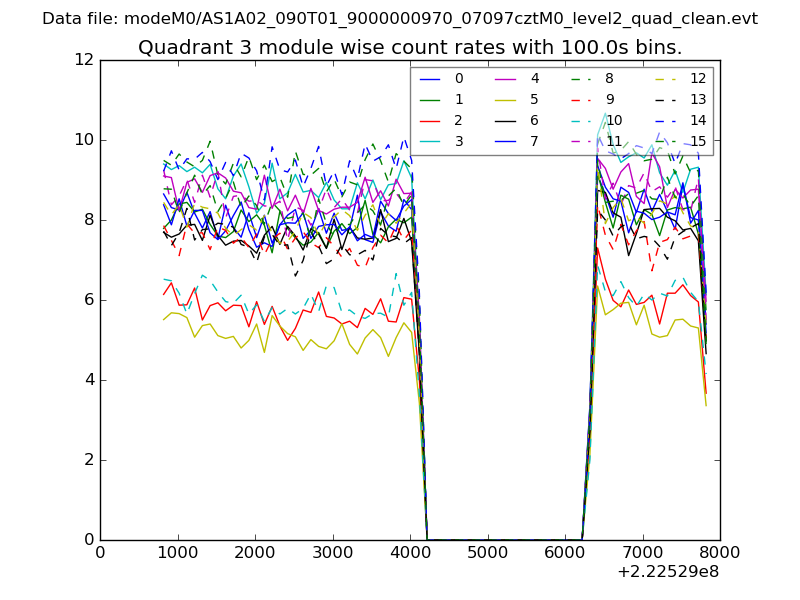
| Module-wise count rates for Quadrant A Data is divided into 100 sec bins |
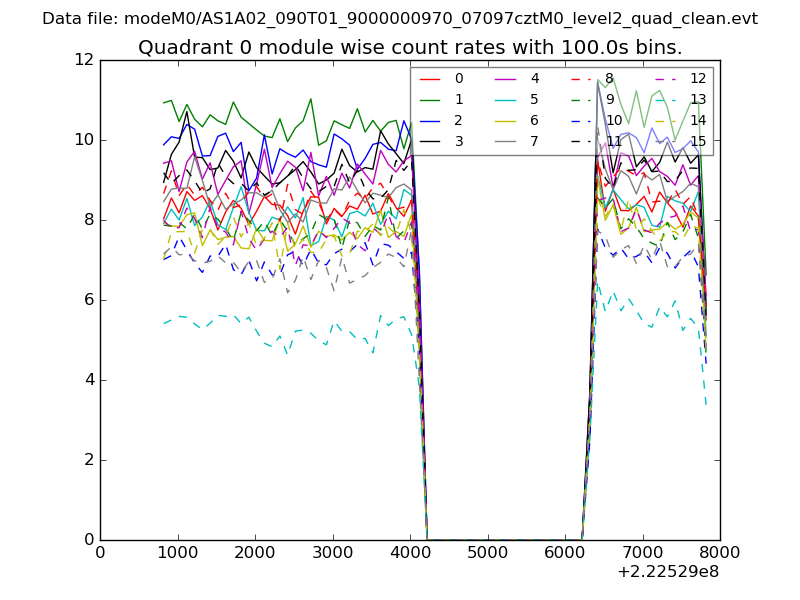 |
 |
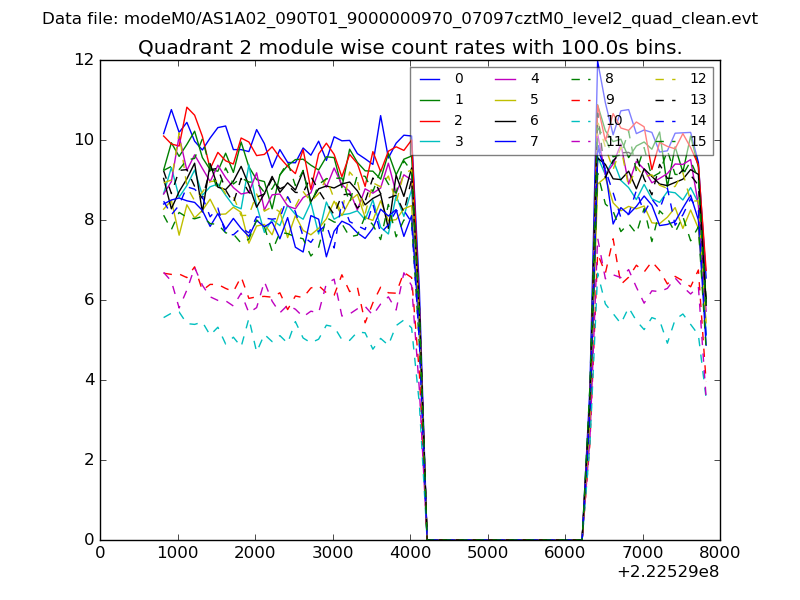
| Module-wise count rates for Quadrant B Data is divided into 100 sec bins |
 |
 |
| Module-wise count rates for Quadrant C Data is divided into 100 sec bins |
 |
 |
| Module-wise count rates for Quadrant D Data is divided into 100 sec bins |
 |
 |
| Parameter | Plot |
|---|---|
| CZT HV Monitor | 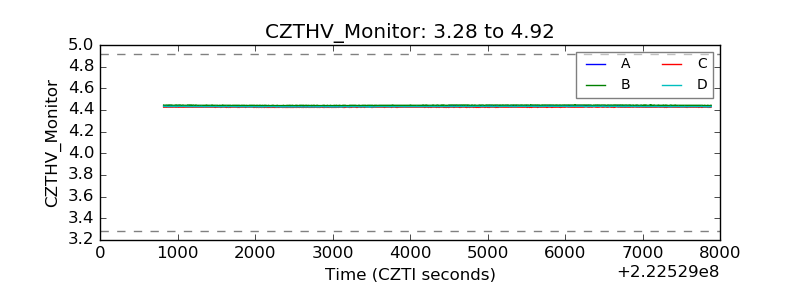 |
| D_VDD | 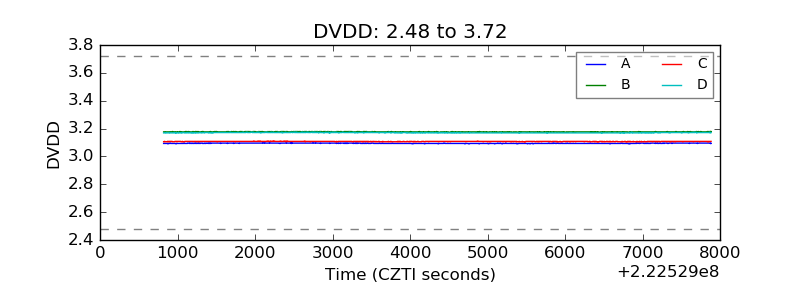 |
| Temperature 1 | 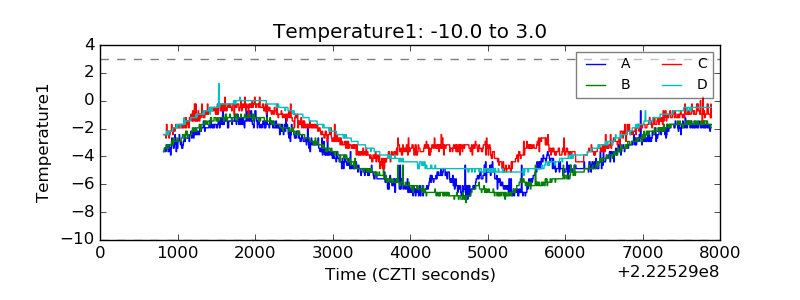 |
| Veto HV Monitor | 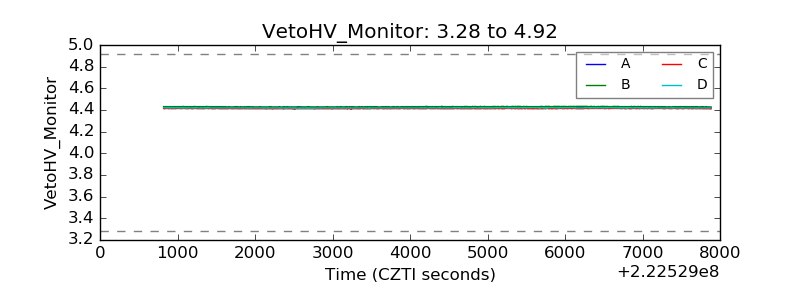 |
| Veto LLD | 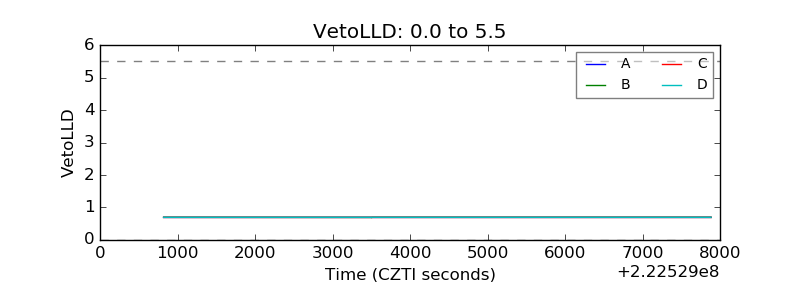 |
| Alpha Counter | 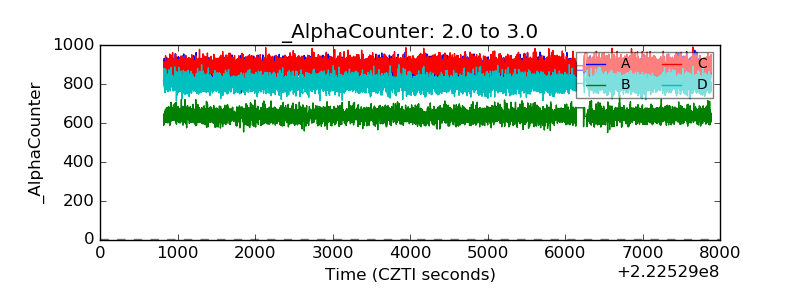 |
| _CPM_Rate | 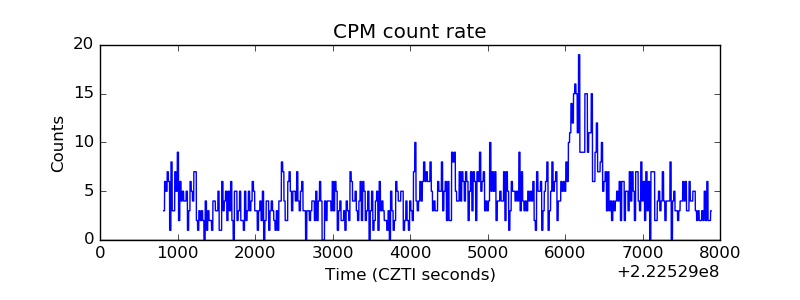 |
| CZT Counter | 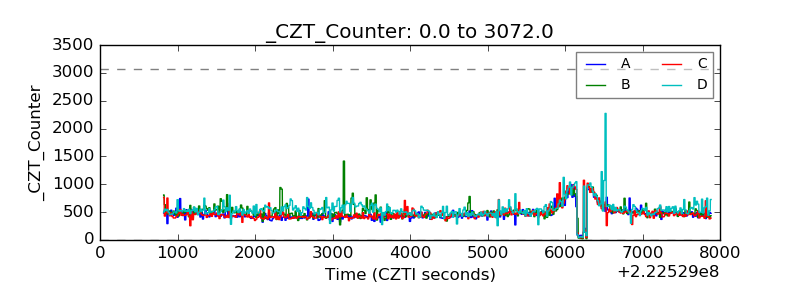 |
| +2.5 Volts monitor |  |
| +5 Volts monitor |  |
| _ROLL_ROT | 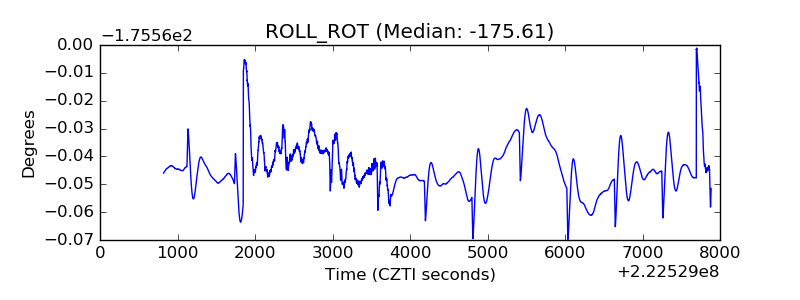 |
| _Roll_DEC | 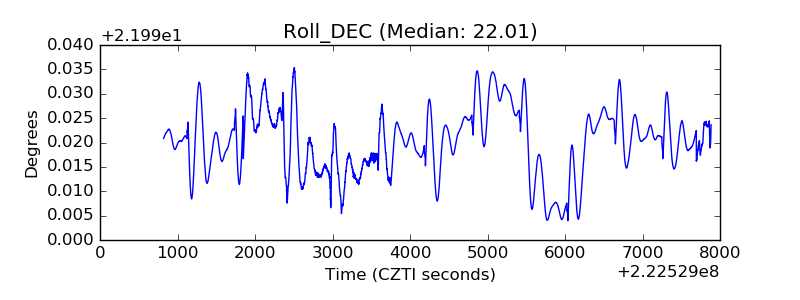 |
| _Roll_RA | 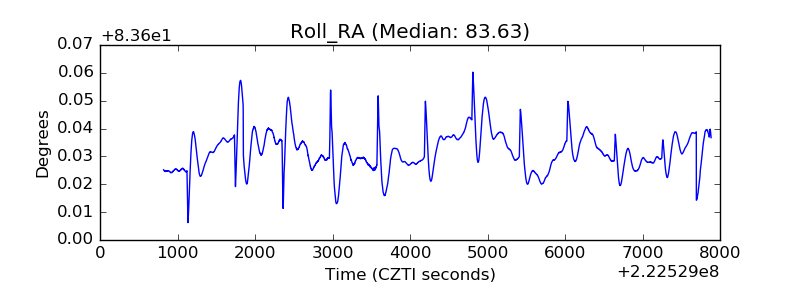 |
| Veto Counter | 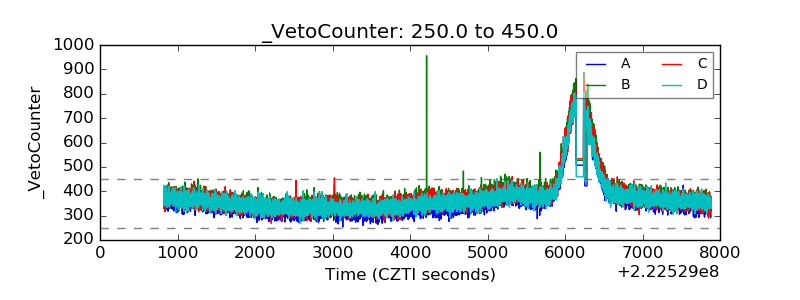 |