| Param | Original file | Final file |
|---|---|---|
| Filename | modeM0/AS1A02_090T01_9000000970_07100cztM0_level2.evt | modeM0/AS1A02_090T01_9000000970_07100cztM0_level2_quad_clean.evt |
| Size (bytes) | 1,115,861,760 | 204,344,640 |
| Size | 1.0 GB | 194.9 MB |
| Events in quadrant A | 7,415,946 | 1,285,886 |
| Events in quadrant B | 7,904,092 | 1,291,959 |
| Events in quadrant C | 7,436,191 | 1,275,730 |
| Events in quadrant D | 9,934,978 | 1,210,833 |
| Mode M0 | |||
|---|---|---|---|
| Quadrant | BADHDUFLAG | Total packets | Discarded packets |
| A | 0 | 33346 | 3 |
| B | 0 | 34202 | 2 |
| C | 0 | 33391 | 2 |
| D | 0 | 40497 | 2 |
| Mode M9 | |||
|---|---|---|---|
| Quadrant | BADHDUFLAG | Total packets | Discarded packets |
| A | 0 | 9 | 0 |
| B | 0 | 9 | 0 |
| C | 0 | 9 | 0 |
| D | 0 | 9 | 0 |
| Mode SS | |||
|---|---|---|---|
| Quadrant | BADHDUFLAG | Total packets | Discarded packets |
| A | 0 | 332 | 0 |
| B | 0 | 332 | 0 |
| C | 0 | 332 | 0 |
| D | 0 | 332 | 0 |
| Quadrant | Total seconds | Saturated seconds | Saturation percentage |
|---|---|---|---|
| A | 16296 | 162 | 0.994109% |
| B | 16296 | 156 | 0.957290% |
| C | 16296 | 97 | 0.595238% |
| D | 16296 | 260 | 1.595484% |
Noise dominated data is calculated using 1-second bins in cleaned event files. If a bin has >2000 counts, and if more than 50% of those come from <1% of pixels, then it is considered to be noise-dominated and hence unusable.
| Quadrant | # 1 sec bins | Bins with >0 counts | Bins with >2000 counts | High rate bins dominated by noise | Noise dominated (total time) | Noise dominated (detector-on time) | Marked lightcurve |
|---|---|---|---|---|---|---|---|
| A | 17241 | 16297 | 0 | 0 | 0.00% | 0.00% | 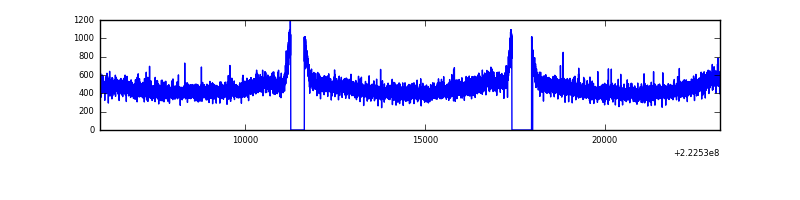 |
| B | 17241 | 16296 | 1 | 1 | 0.01% | 0.01% | 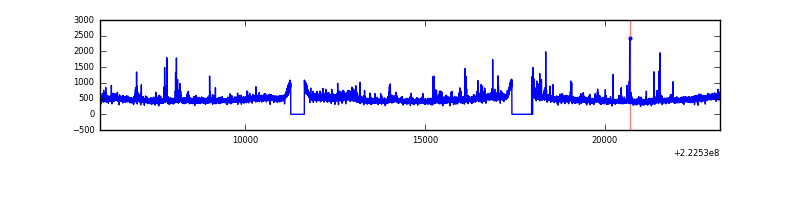 |
| C | 17241 | 16297 | 9 | 9 | 0.05% | 0.06% | 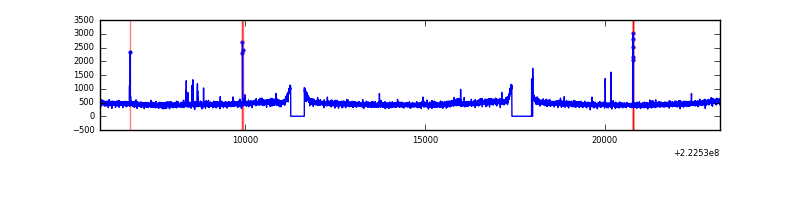 |
| D | 17241 | 16297 | 120 | 120 | 0.70% | 0.74% | 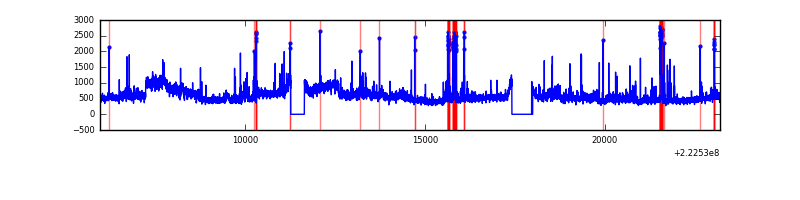 |
Top three noisy pixels from each quadrant. If the there are fewer than three noisy pixels in the level2.evt file, extra rows are filled as -1
| Pixel properties | Quadrant properties | ||||||
|---|---|---|---|---|---|---|---|
| Quadrant | DetID | PixID | Counts | Sigma | Mean | Median | Sigma |
| A | 0 | 226 | 18243 | 41.65 | 1921 | 1881 | 392.8 |
| A | 12 | 194 | 16634 | 37.56 | 1921 | 1881 | 392.8 |
| A | 13 | 14 | 13576 | 29.77 | 1921 | 1881 | 392.8 |
| B | 0 | 219 | 172519 | 460.44 | 1937 | 1891 | 370.6 |
| B | 0 | 214 | 110754 | 293.77 | 1937 | 1891 | 370.6 |
| B | 4 | 81 | 72976 | 191.82 | 1937 | 1891 | 370.6 |
| C | 4 | 254 | 50889 | 113.05 | 1871 | 1886 | 433.4 |
| C | 9 | 68 | 34794 | 75.92 | 1871 | 1886 | 433.4 |
| C | 1 | 3 | 21615 | 45.52 | 1871 | 1886 | 433.4 |
| D | 1 | 20 | 1253284 | 2751.56 | 1860 | 1808 | 454.8 |
| D | 8 | 195 | 1073874 | 2357.1 | 1860 | 1808 | 454.8 |
| D | 2 | 14 | 317345 | 693.76 | 1860 | 1808 | 454.8 |
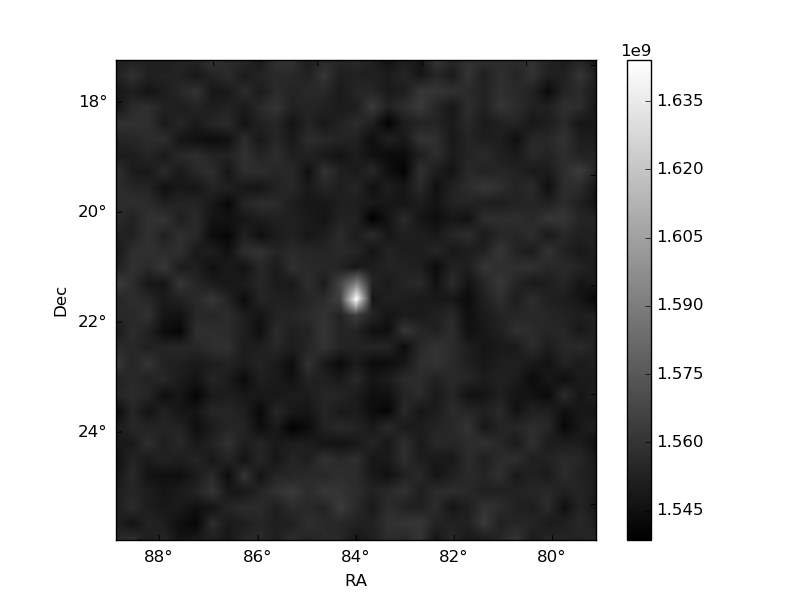
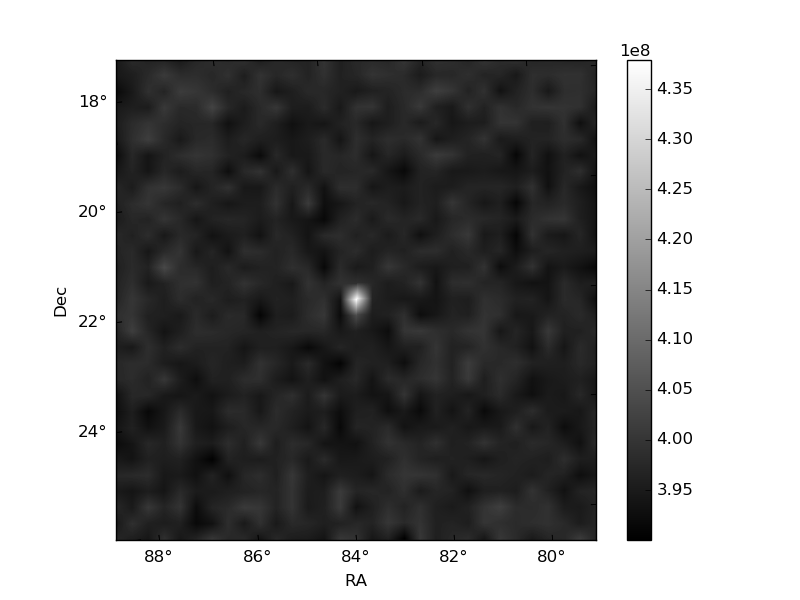
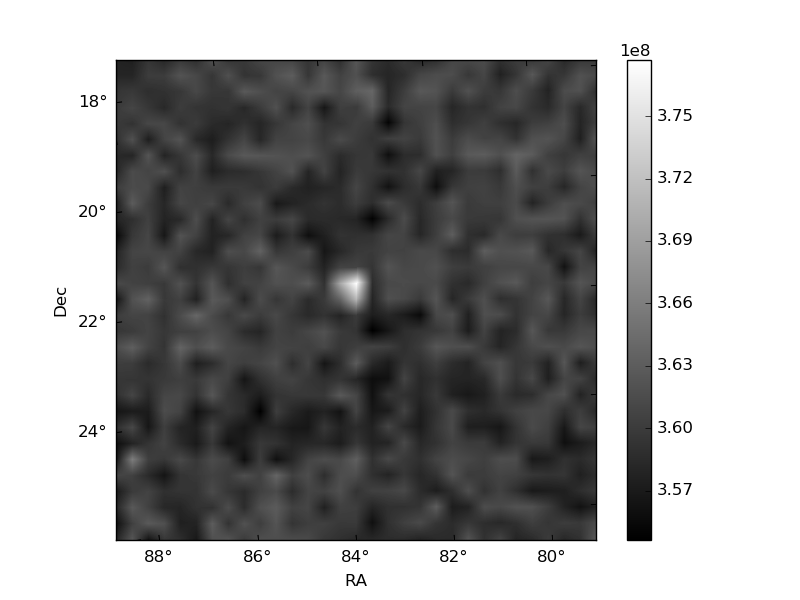
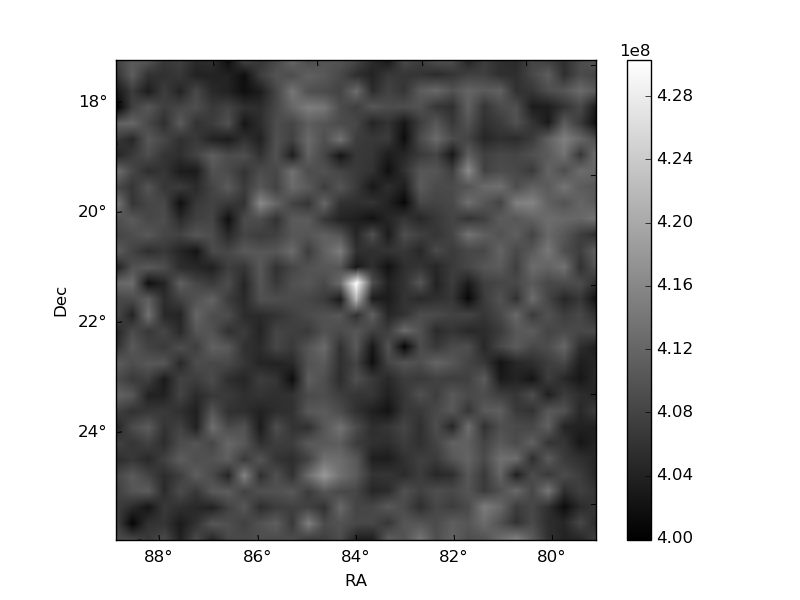
Histogram calculated using DETX and DETY for each event in the final _common_clean file
| Quadrant A | 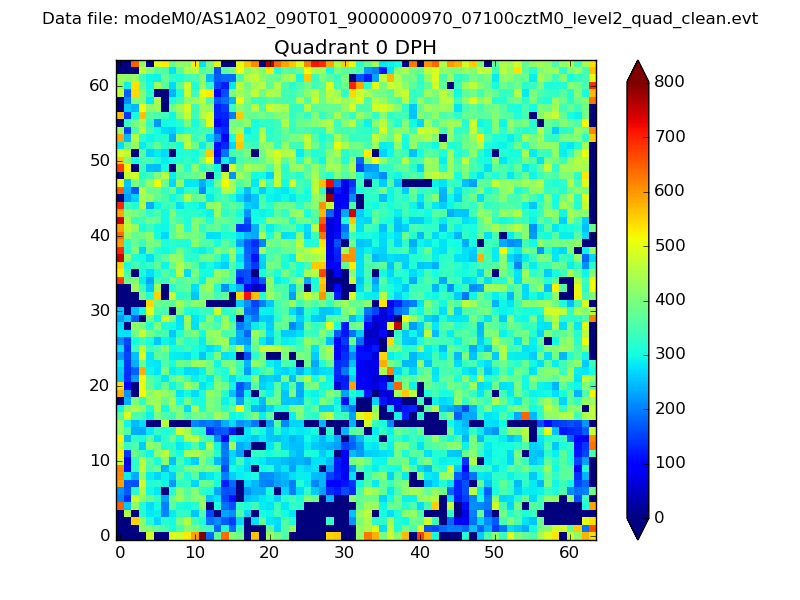 |
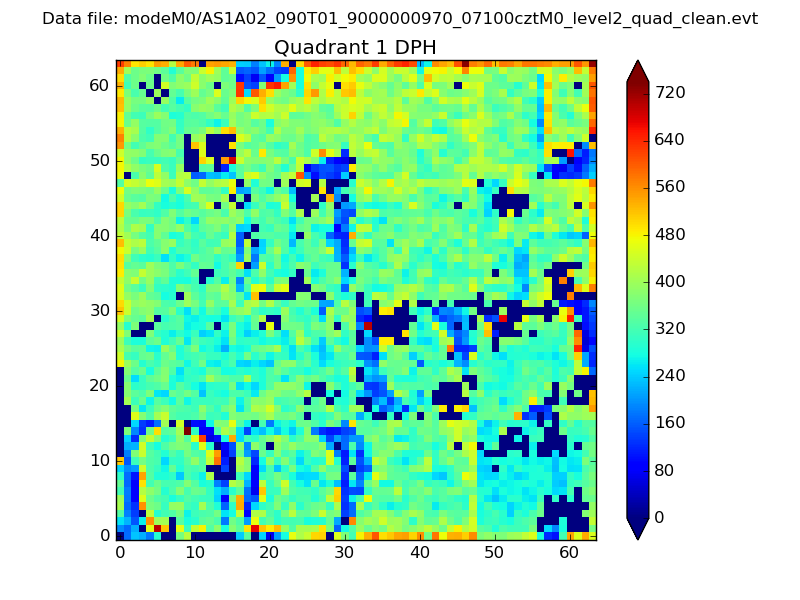 |
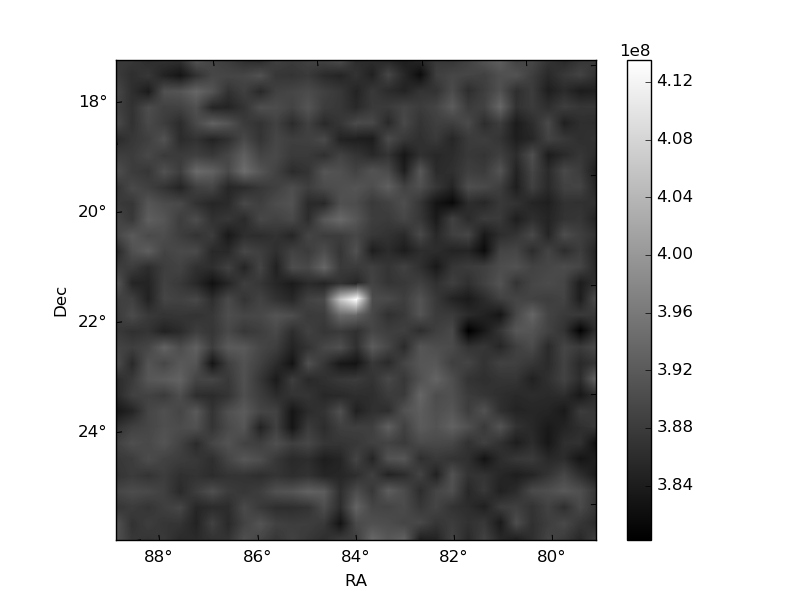
Quadrant B |
|---|---|---|---|
| Quadrant D | 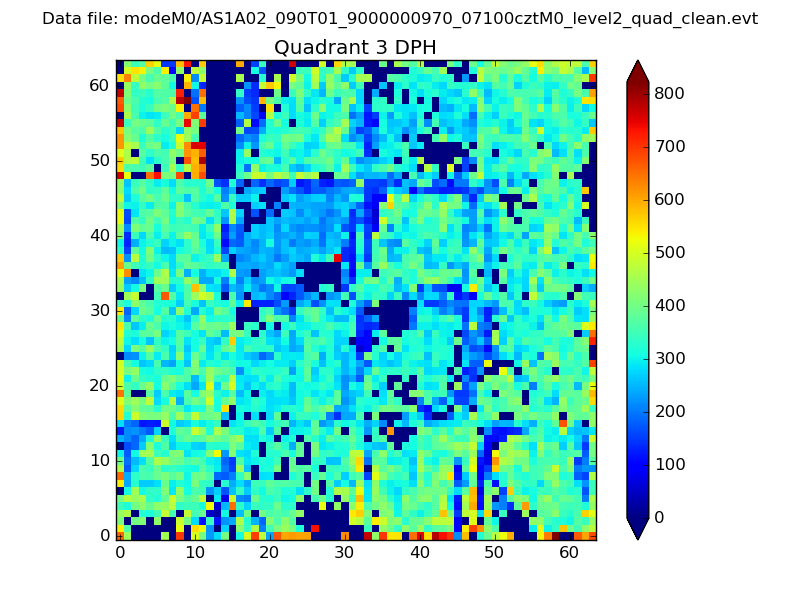 |
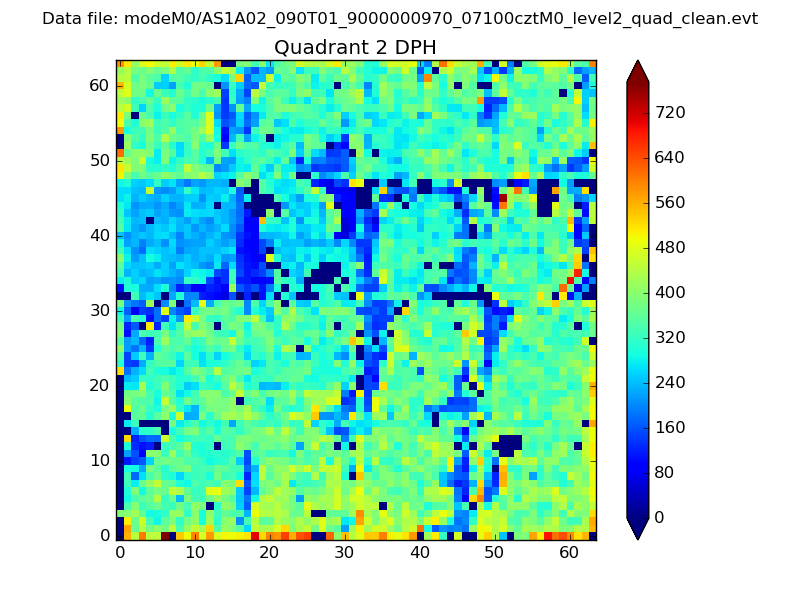 |
Quadrant C |
| Plot type | Count rate plots | Images |
|---|---|---|
| Comparison with Poisson distribution Blue bars denote a histogram of data divided into 1 sec bins. Red curve is a Poisson curve with rate = median count rate of data. |
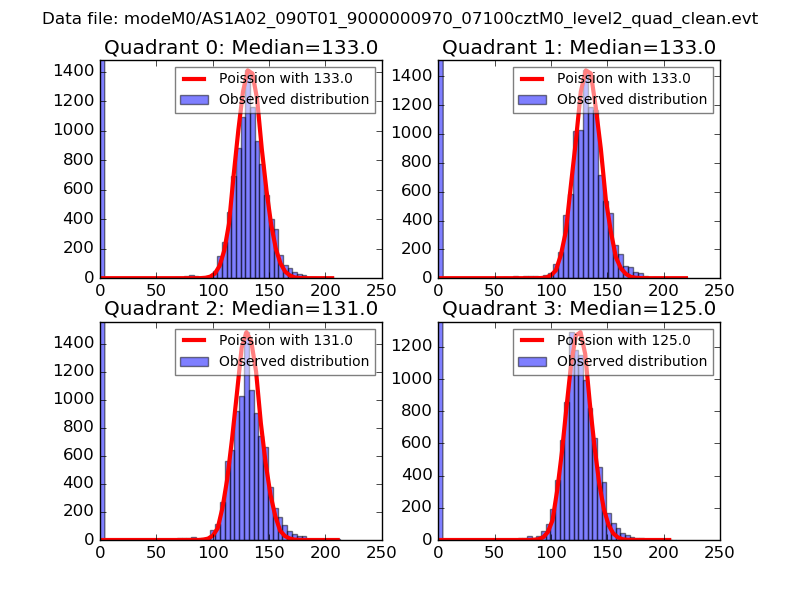 |
 |
| Quadrant-wise count rates Data is divided into 100 sec bins |
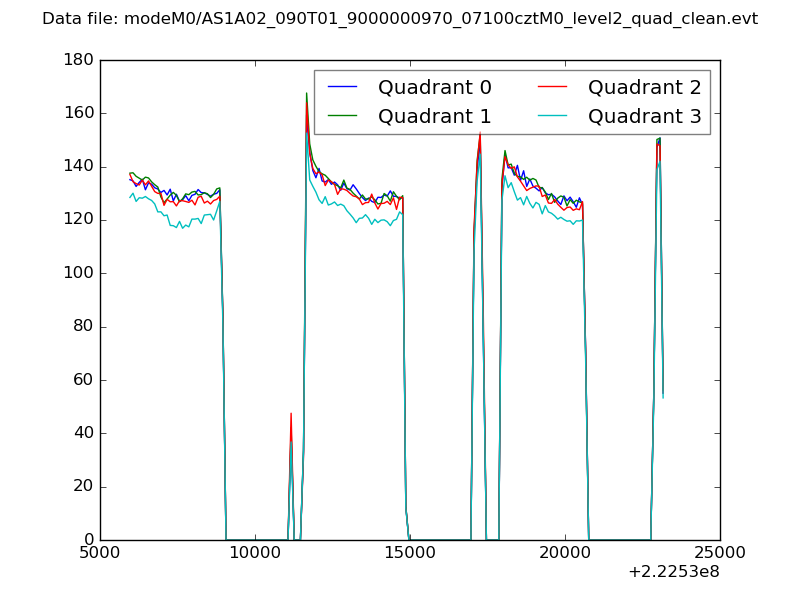 |
|
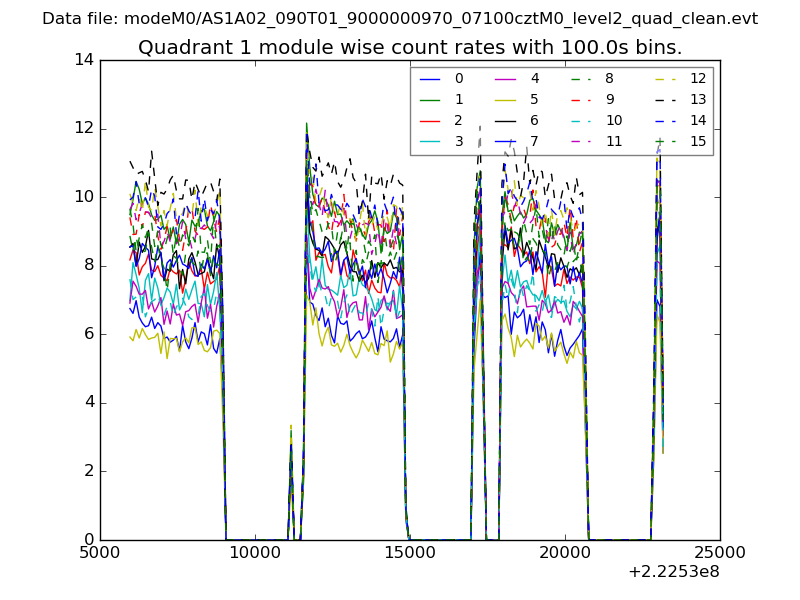
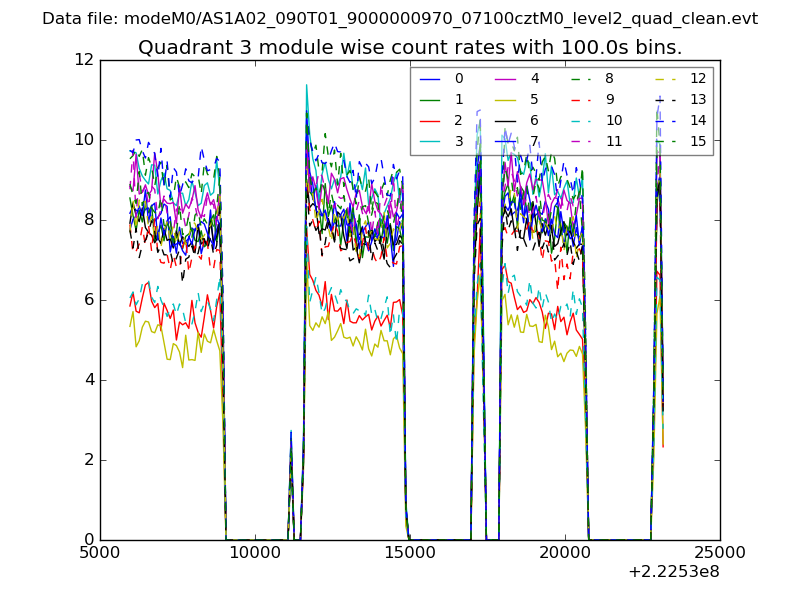
| Module-wise count rates for Quadrant A Data is divided into 100 sec bins |
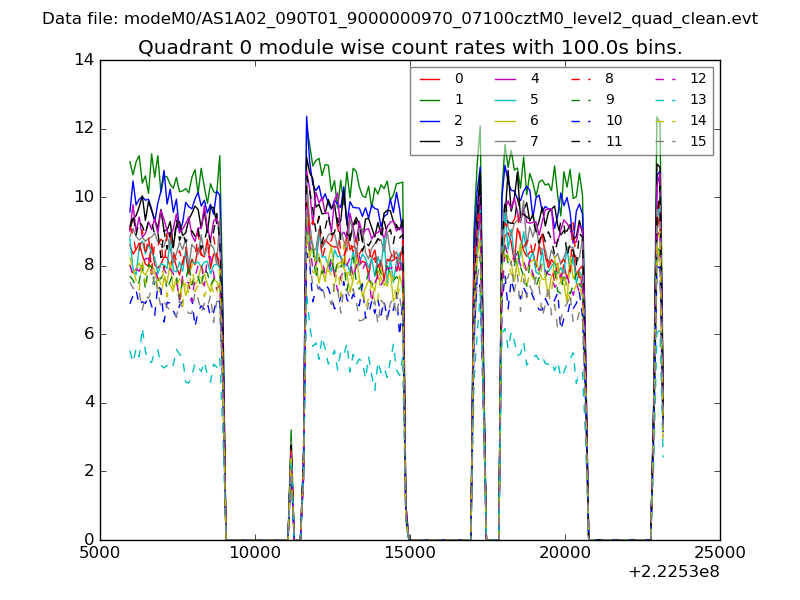 |
 |
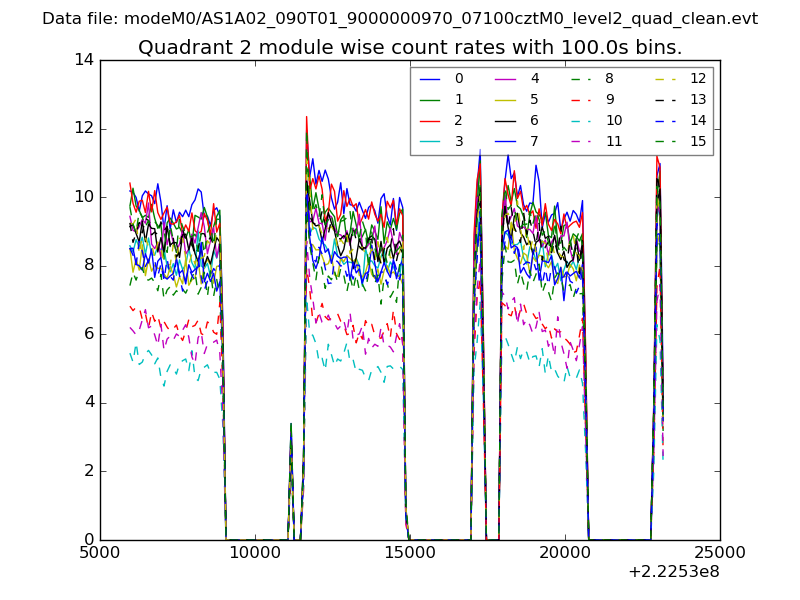
| Module-wise count rates for Quadrant B Data is divided into 100 sec bins |
 |
 |
| Module-wise count rates for Quadrant C Data is divided into 100 sec bins |
 |
 |
| Module-wise count rates for Quadrant D Data is divided into 100 sec bins |
 |
 |
| Parameter | Plot |
|---|---|
| CZT HV Monitor | 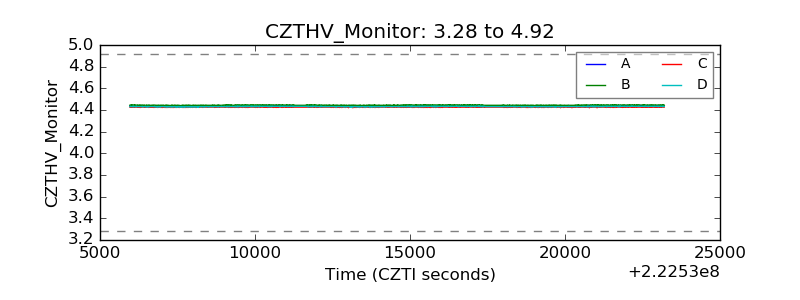 |
| D_VDD | 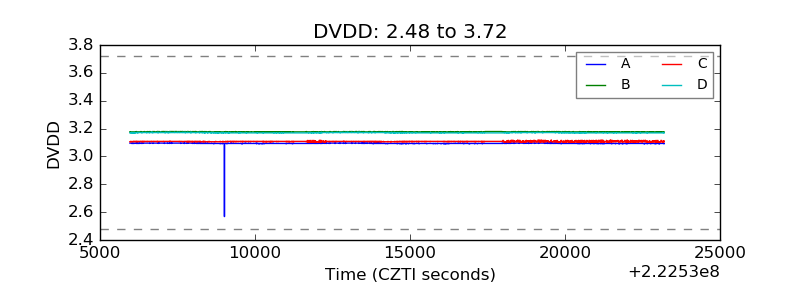 |
| Temperature 1 | 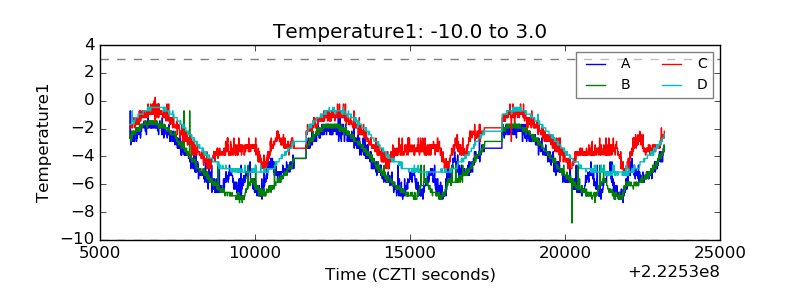 |
| Veto HV Monitor | 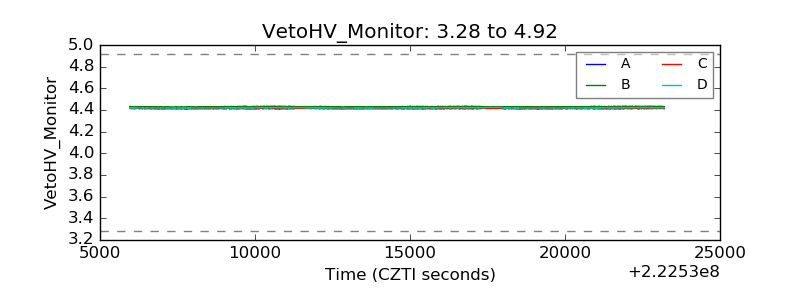 |
| Veto LLD | 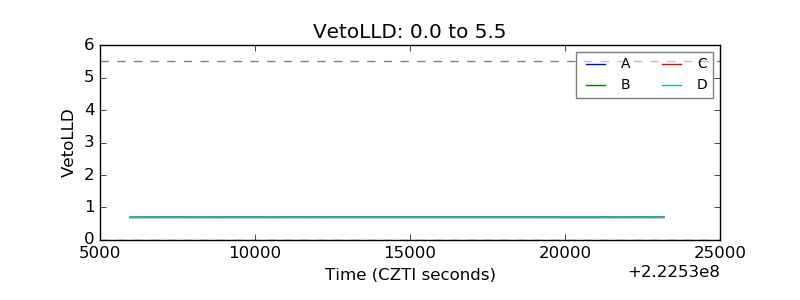 |
| Alpha Counter | 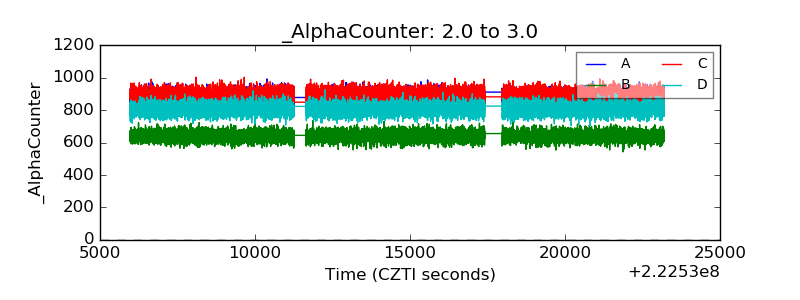 |
| _CPM_Rate | 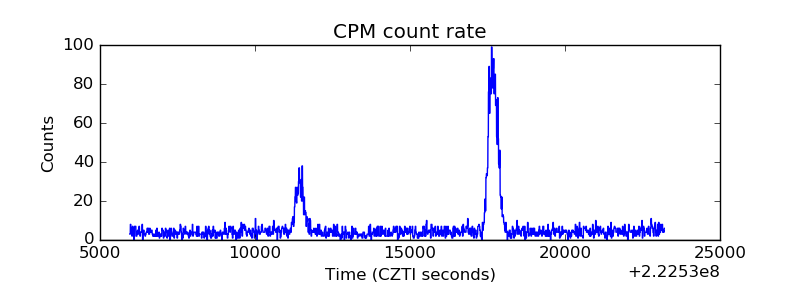 |
| CZT Counter | 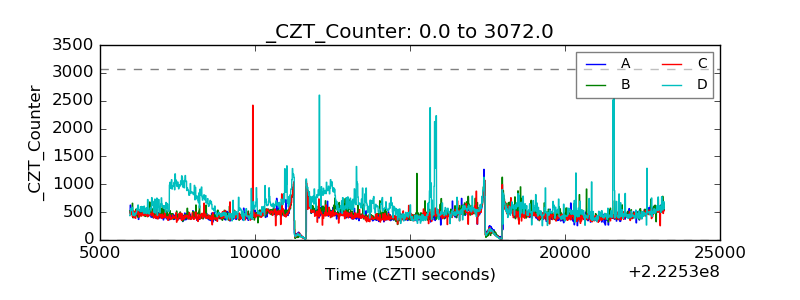 |
| +2.5 Volts monitor |  |
| +5 Volts monitor |  |
| _ROLL_ROT | 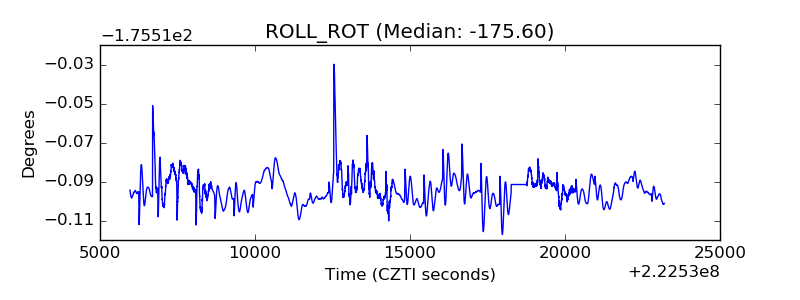 |
| _Roll_DEC | 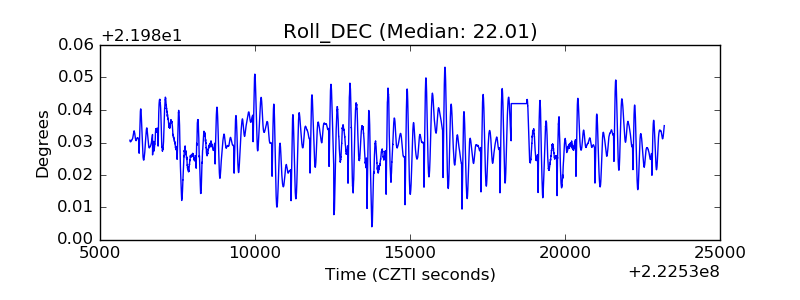 |
| _Roll_RA | 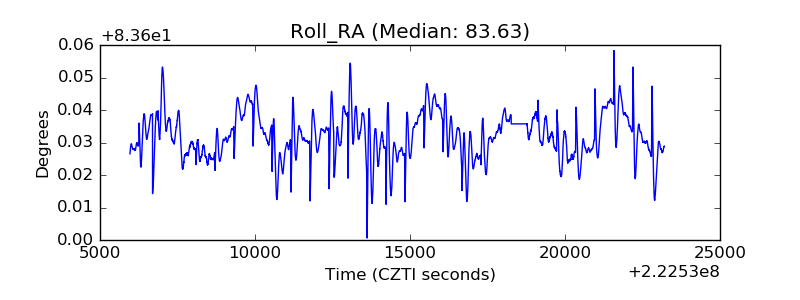 |
| Veto Counter | 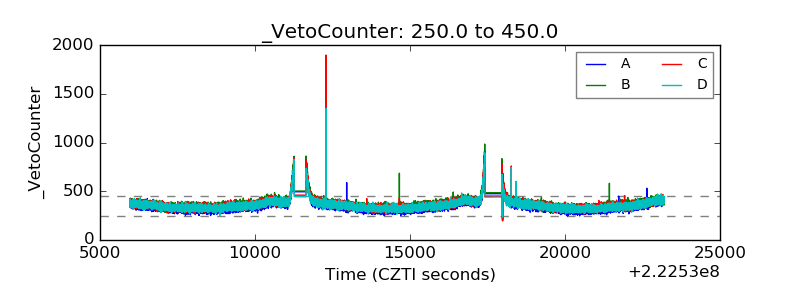 |