| Param | Original file | Final file |
|---|---|---|
| Filename | modeM0/AS1A02_090T01_9000000970_07102cztM0_level2.evt | modeM0/AS1A02_090T01_9000000970_07102cztM0_level2_quad_clean.evt |
| Size (bytes) | 414,714,240 | 84,516,480 |
| Size | 395.5 MB | 80.6 MB |
| Events in quadrant A | 2,749,883 | 544,943 |
| Events in quadrant B | 2,887,256 | 552,175 |
| Events in quadrant C | 2,791,783 | 539,648 |
| Events in quadrant D | 3,719,801 | 500,658 |
| Mode M0 | |||
|---|---|---|---|
| Quadrant | BADHDUFLAG | Total packets | Discarded packets |
| A | 0 | 12300 | 2 |
| B | 0 | 12560 | 1 |
| C | 0 | 12334 | 1 |
| D | 0 | 15018 | 1 |
| Mode M9 | |||
|---|---|---|---|
| Quadrant | BADHDUFLAG | Total packets | Discarded packets |
| A | 0 | 10 | 0 |
| B | 0 | 10 | 0 |
| C | 0 | 10 | 0 |
| D | 0 | 10 | 0 |
| Mode SS | |||
|---|---|---|---|
| Quadrant | BADHDUFLAG | Total packets | Discarded packets |
| A | 0 | 124 | 0 |
| B | 0 | 124 | 0 |
| C | 0 | 124 | 0 |
| D | 0 | 124 | 0 |
| Quadrant | Total seconds | Saturated seconds | Saturation percentage |
|---|---|---|---|
| A | 6035 | 16 | 0.265120% |
| B | 6035 | 19 | 0.314830% |
| C | 6035 | 16 | 0.265120% |
| D | 6035 | 171 | 2.833471% |
Noise dominated data is calculated using 1-second bins in cleaned event files. If a bin has >2000 counts, and if more than 50% of those come from <1% of pixels, then it is considered to be noise-dominated and hence unusable.
| Quadrant | # 1 sec bins | Bins with >0 counts | Bins with >2000 counts | High rate bins dominated by noise | Noise dominated (total time) | Noise dominated (detector-on time) | Marked lightcurve |
|---|---|---|---|---|---|---|---|
| A | 7105 | 6036 | 0 | 0 | 0.00% | 0.00% | 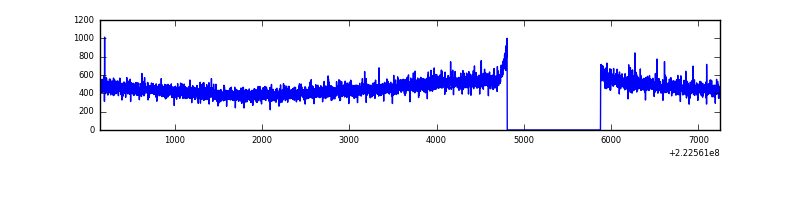 |
| B | 7105 | 6035 | 1 | 1 | 0.01% | 0.02% | 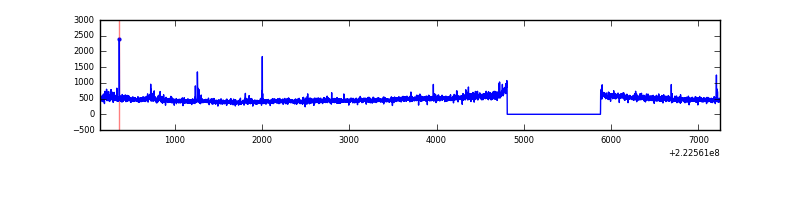 |
| C | 7105 | 6036 | 3 | 3 | 0.04% | 0.05% | 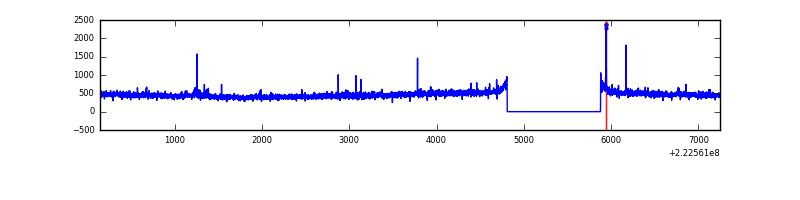 |
| D | 7105 | 6036 | 116 | 116 | 1.63% | 1.92% | 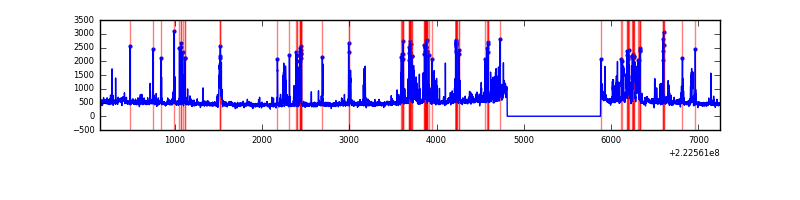 |
Top three noisy pixels from each quadrant. If the there are fewer than three noisy pixels in the level2.evt file, extra rows are filled as -1
| Pixel properties | Quadrant properties | ||||||
|---|---|---|---|---|---|---|---|
| Quadrant | DetID | PixID | Counts | Sigma | Mean | Median | Sigma |
| A | 0 | 226 | 6813 | 41.74 | 713 | 701 | 146.4 |
| A | 12 | 194 | 6332 | 38.45 | 713 | 701 | 146.4 |
| A | 8 | 15 | 2945 | 15.32 | 713 | 701 | 146.4 |
| B | 0 | 214 | 43452 | 308.37 | 722 | 705 | 138.6 |
| B | 0 | 219 | 33441 | 236.15 | 722 | 705 | 138.6 |
| B | 12 | 111 | 13440 | 91.87 | 722 | 705 | 138.6 |
| C | 9 | 68 | 24777 | 147.78 | 697 | 702 | 162.9 |
| C | 4 | 254 | 17236 | 101.49 | 697 | 702 | 162.9 |
| C | 8 | 128 | 11201 | 64.45 | 697 | 702 | 162.9 |
| D | 2 | 216 | 406480 | 2407.98 | 683 | 662 | 168.5 |
| D | 8 | 195 | 285503 | 1690.15 | 683 | 662 | 168.5 |
| D | 12 | 233 | 193420 | 1143.76 | 683 | 662 | 168.5 |
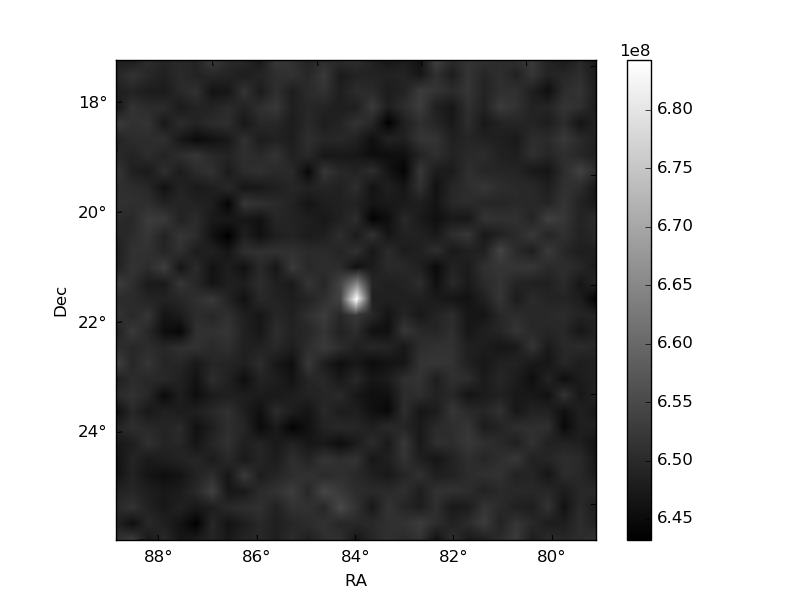
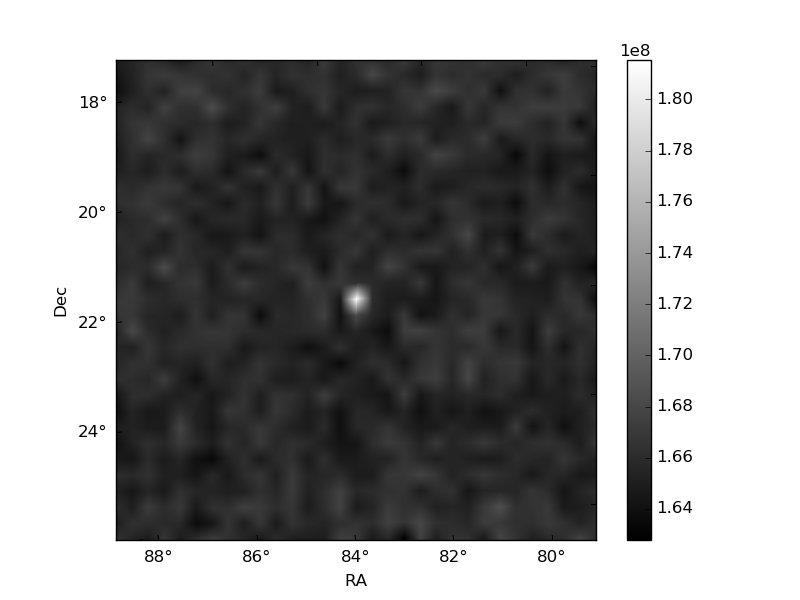
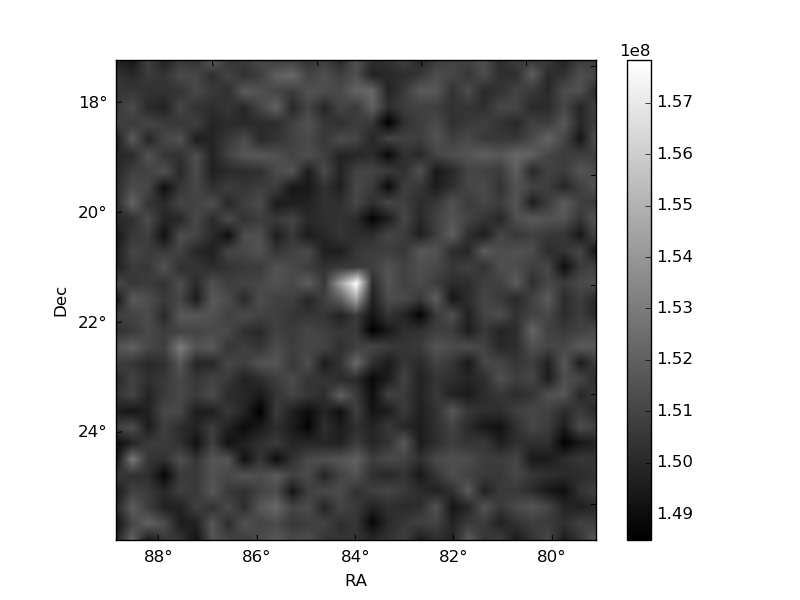
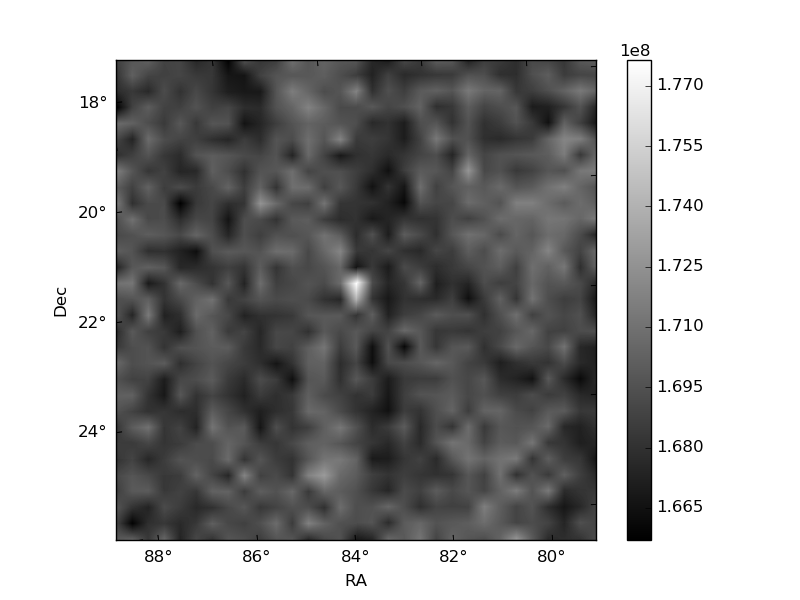
Histogram calculated using DETX and DETY for each event in the final _common_clean file
| Quadrant A | 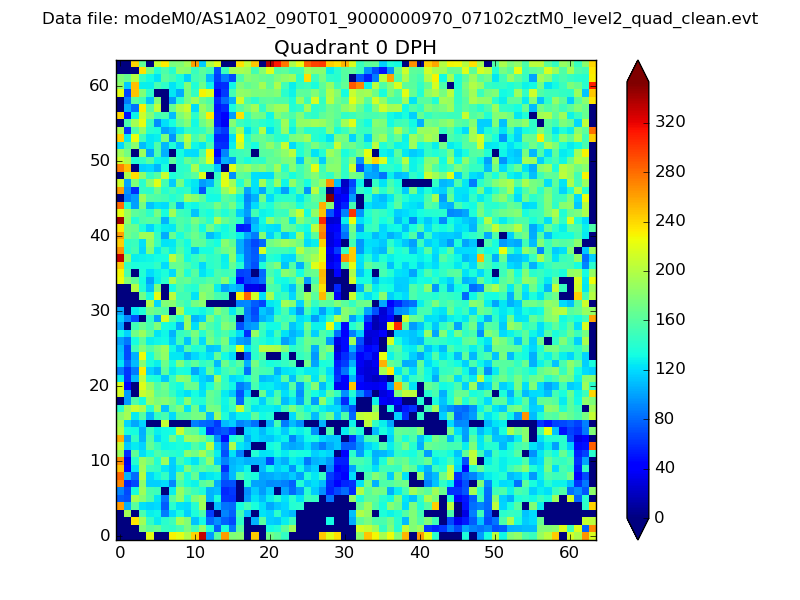 |
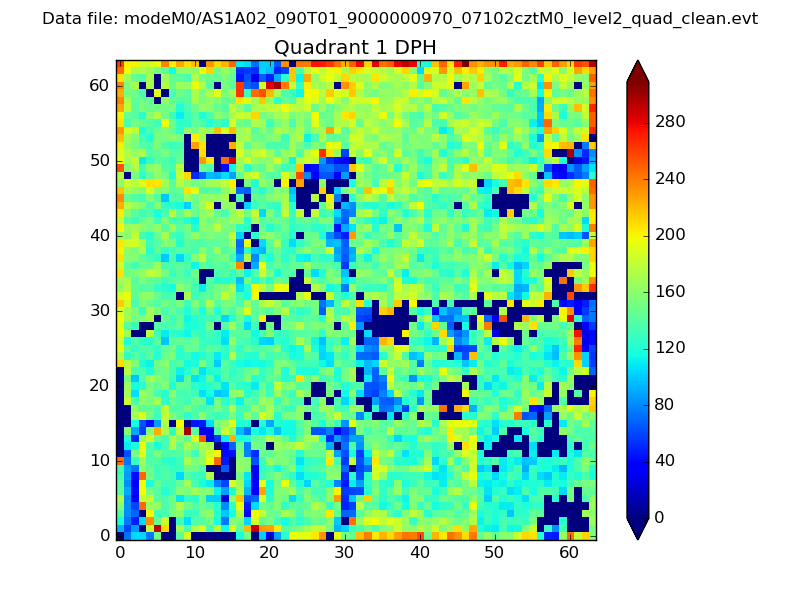 |
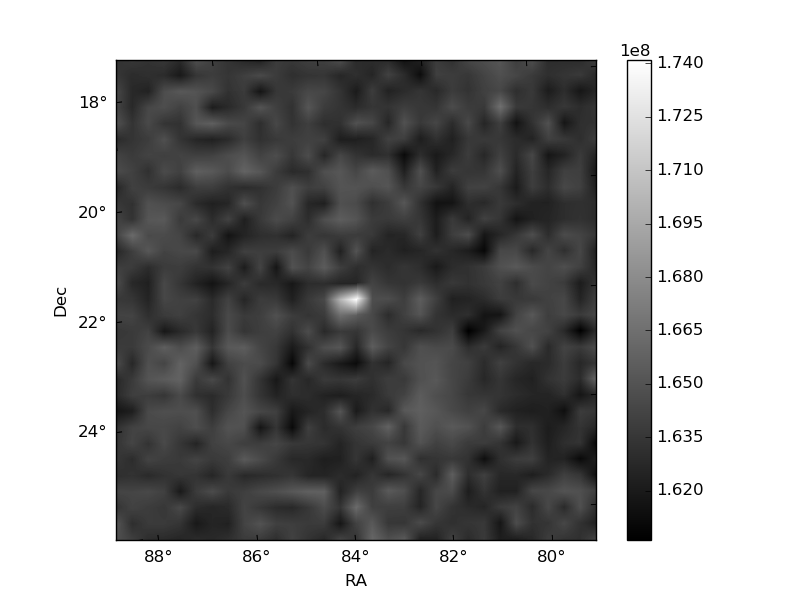
Quadrant B |
|---|---|---|---|
| Quadrant D | 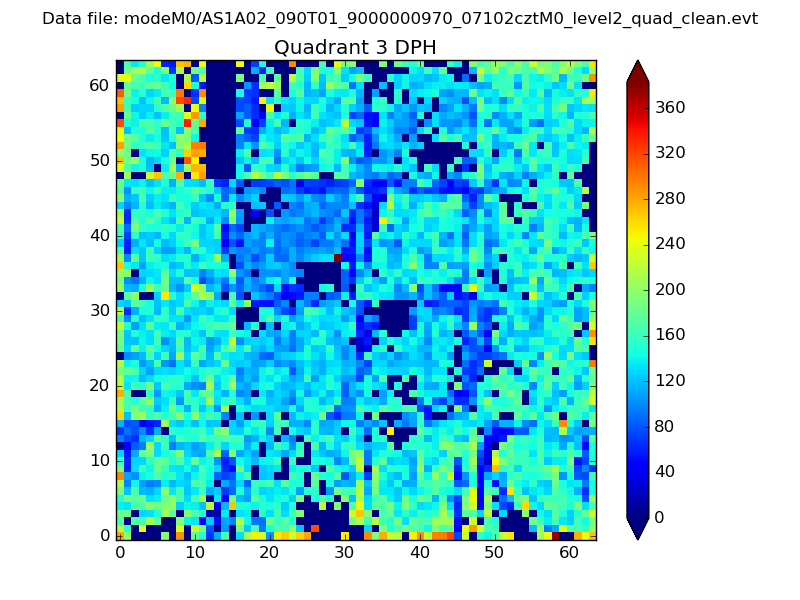 |
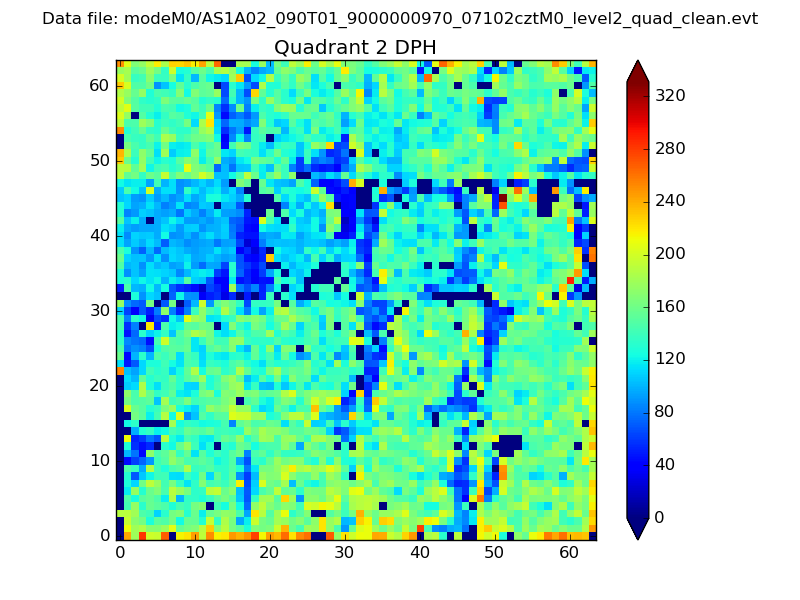 |
Quadrant C |
| Plot type | Count rate plots | Images |
|---|---|---|
| Comparison with Poisson distribution Blue bars denote a histogram of data divided into 1 sec bins. Red curve is a Poisson curve with rate = median count rate of data. |
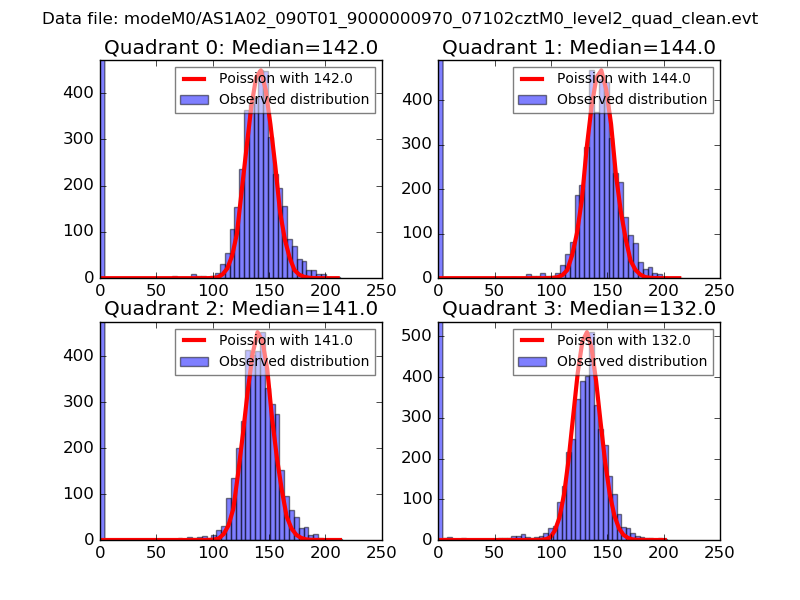 |
 |
| Quadrant-wise count rates Data is divided into 100 sec bins |
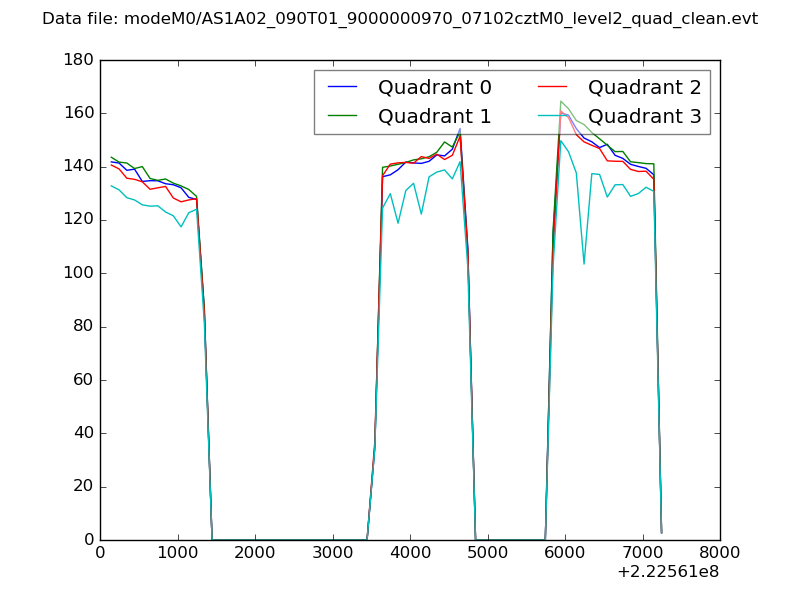 |
|
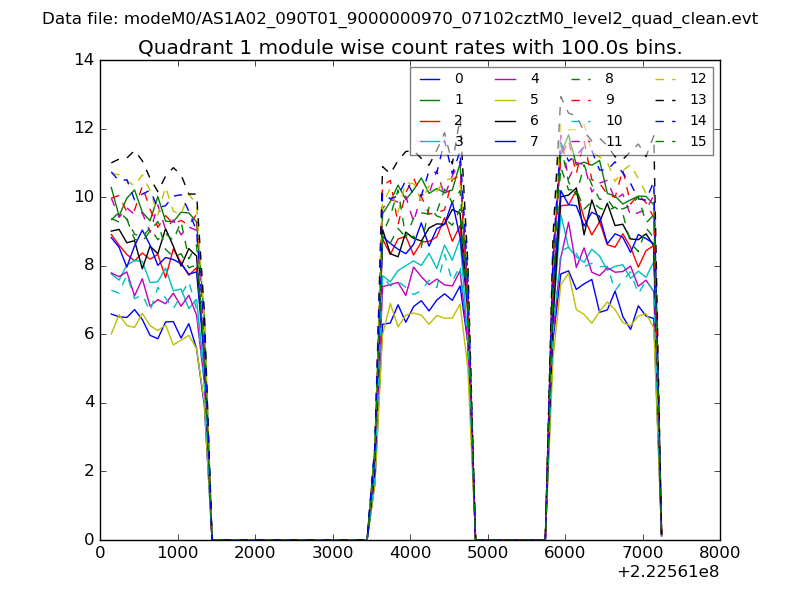
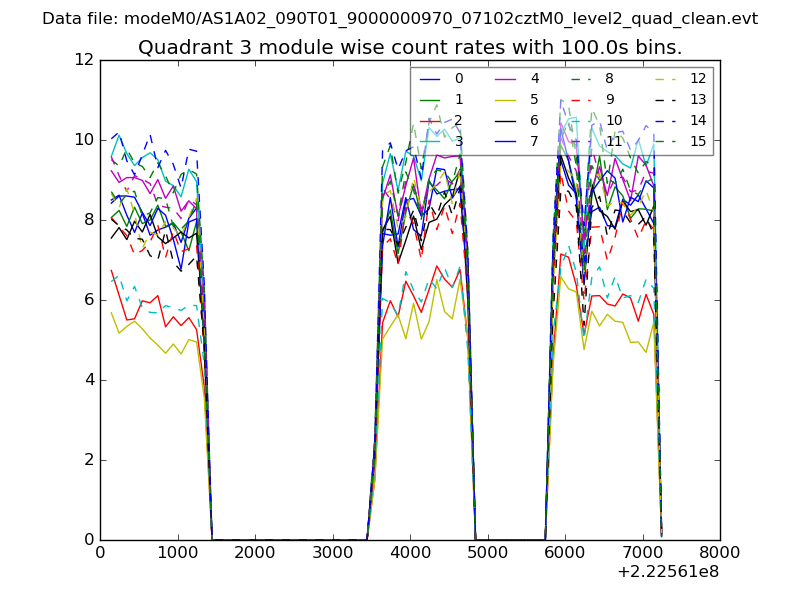
| Module-wise count rates for Quadrant A Data is divided into 100 sec bins |
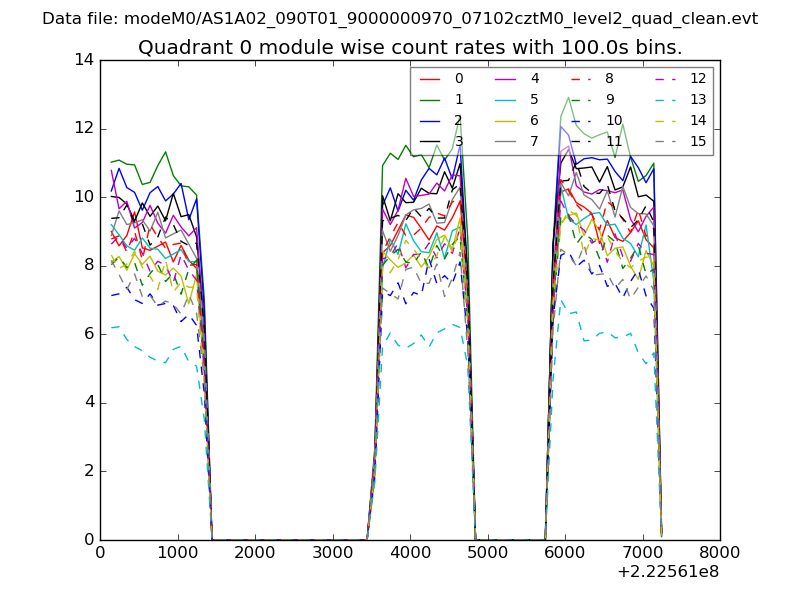 |
 |
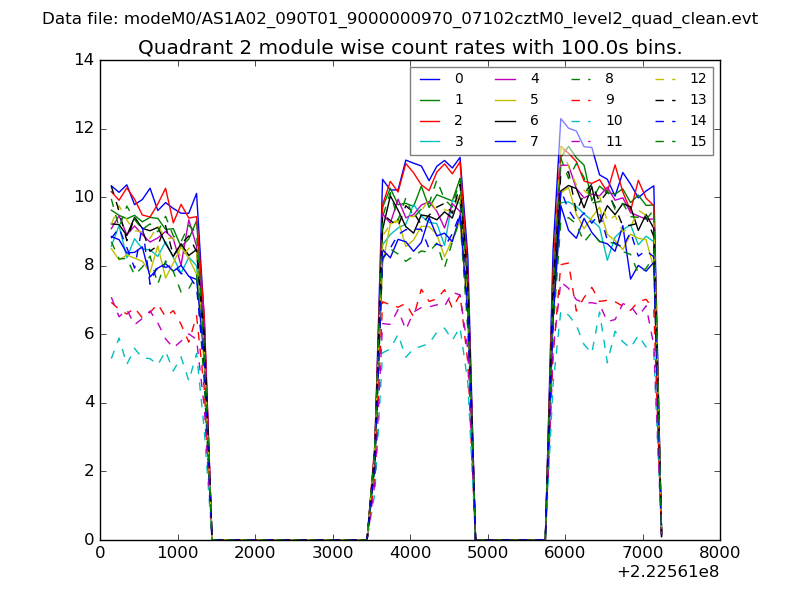
| Module-wise count rates for Quadrant B Data is divided into 100 sec bins |
 |
 |
| Module-wise count rates for Quadrant C Data is divided into 100 sec bins |
 |
 |
| Module-wise count rates for Quadrant D Data is divided into 100 sec bins |
 |
 |
| Parameter | Plot |
|---|---|
| CZT HV Monitor | 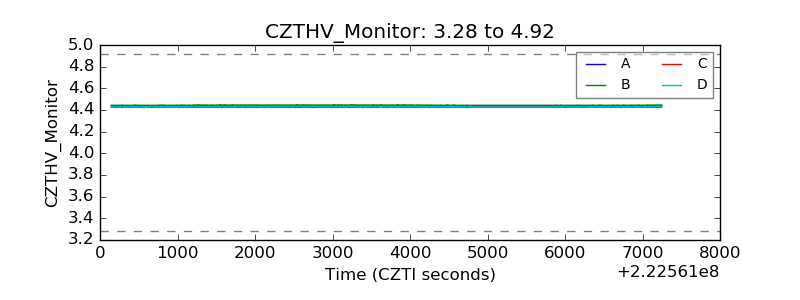 |
| D_VDD | 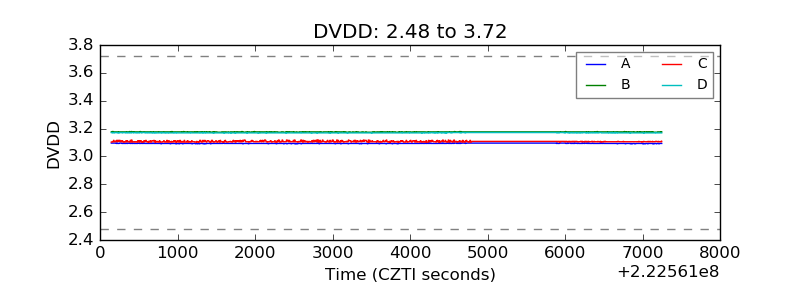 |
| Temperature 1 | 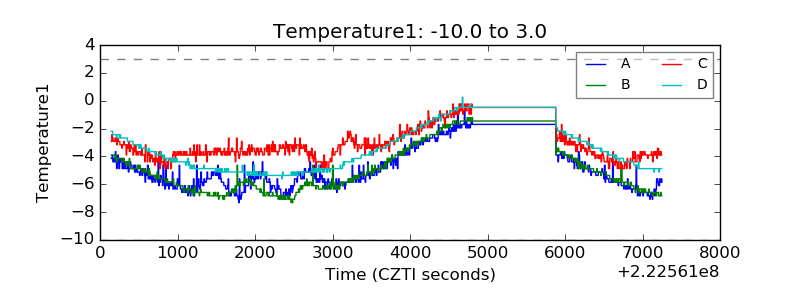 |
| Veto HV Monitor | 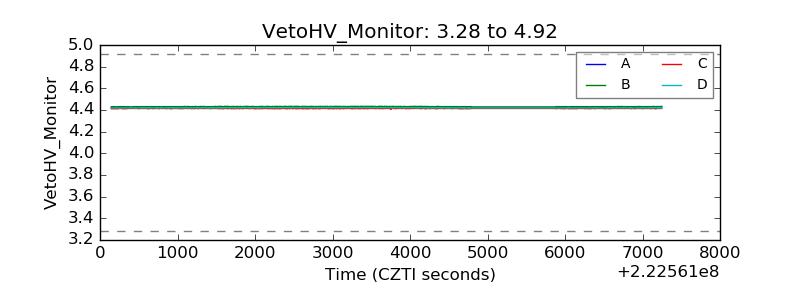 |
| Veto LLD | 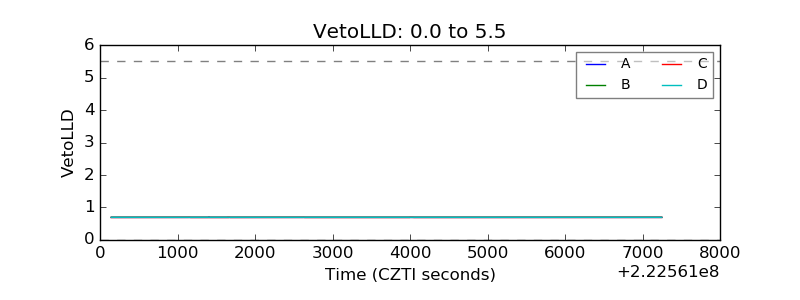 |
| Alpha Counter | 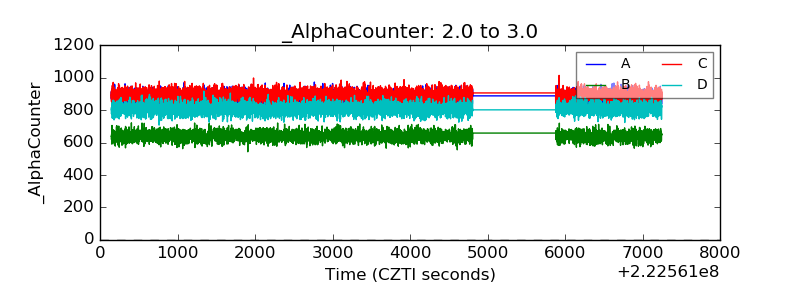 |
| _CPM_Rate | 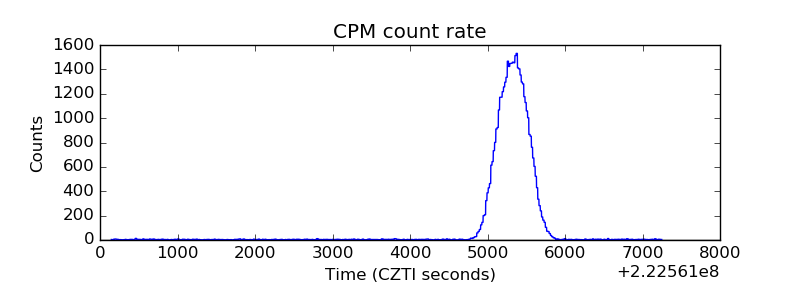 |
| CZT Counter | 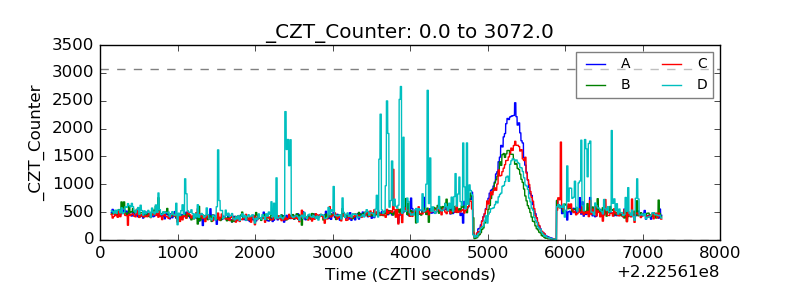 |
| +2.5 Volts monitor | 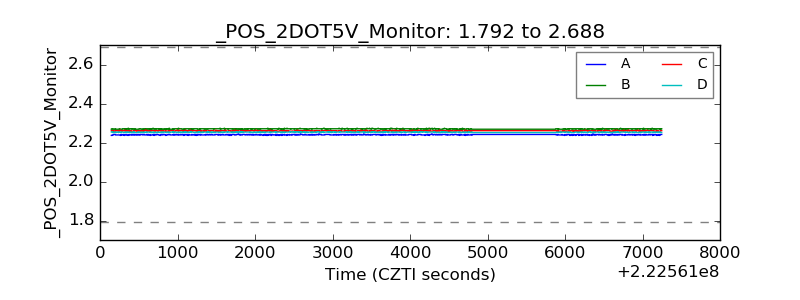 |
| +5 Volts monitor |  |
| _ROLL_ROT | 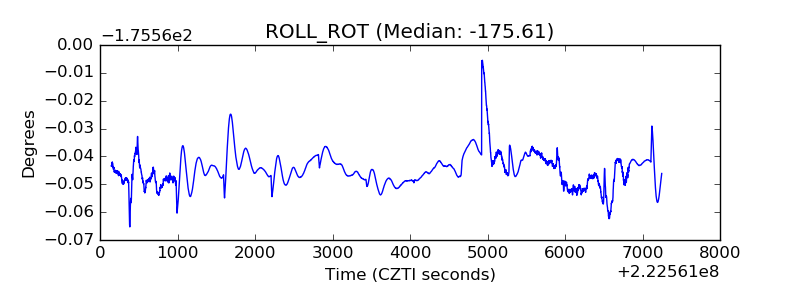 |
| _Roll_DEC | 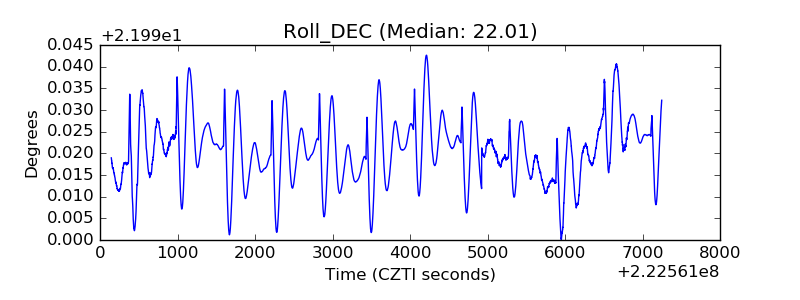 |
| _Roll_RA | 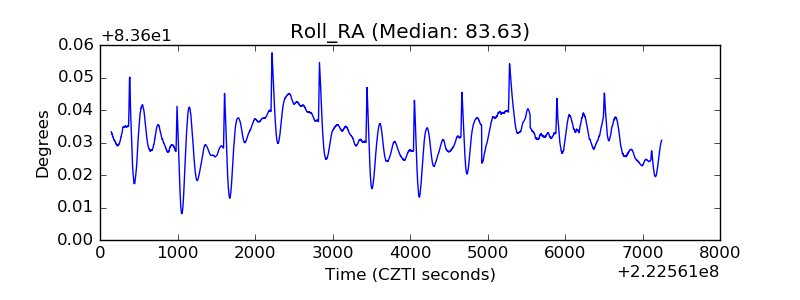 |
| Veto Counter | 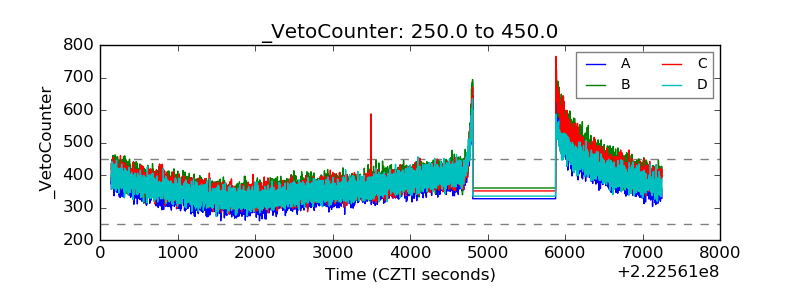 |