| Param | Original file | Final file |
|---|---|---|
| Filename | modeM0/AS1A02_090T01_9000000970_07104cztM0_level2.evt | modeM0/AS1A02_090T01_9000000970_07104cztM0_level2_quad_clean.evt |
| Size (bytes) | 414,624,960 | 82,146,240 |
| Size | 395.4 MB | 78.3 MB |
| Events in quadrant A | 2,822,901 | 524,025 |
| Events in quadrant B | 3,013,096 | 534,319 |
| Events in quadrant C | 2,831,618 | 521,309 |
| Events in quadrant D | 3,475,679 | 483,272 |
| Mode M0 | |||
|---|---|---|---|
| Quadrant | BADHDUFLAG | Total packets | Discarded packets |
| A | 0 | 12392 | 2 |
| B | 0 | 12890 | 1 |
| C | 0 | 12413 | 1 |
| D | 0 | 14427 | 1 |
| Mode M9 | |||
|---|---|---|---|
| Quadrant | BADHDUFLAG | Total packets | Discarded packets |
| A | 0 | 12 | 0 |
| B | 0 | 12 | 0 |
| C | 0 | 12 | 0 |
| D | 0 | 12 | 0 |
| Mode SS | |||
|---|---|---|---|
| Quadrant | BADHDUFLAG | Total packets | Discarded packets |
| A | 0 | 124 | 0 |
| B | 0 | 124 | 0 |
| C | 0 | 124 | 0 |
| D | 0 | 124 | 0 |
| Quadrant | Total seconds | Saturated seconds | Saturation percentage |
|---|---|---|---|
| A | 6079 | 11 | 0.180951% |
| B | 6079 | 19 | 0.312551% |
| C | 6079 | 8 | 0.131601% |
| D | 6079 | 120 | 1.974009% |
Noise dominated data is calculated using 1-second bins in cleaned event files. If a bin has >2000 counts, and if more than 50% of those come from <1% of pixels, then it is considered to be noise-dominated and hence unusable.
| Quadrant | # 1 sec bins | Bins with >0 counts | Bins with >2000 counts | High rate bins dominated by noise | Noise dominated (total time) | Noise dominated (detector-on time) | Marked lightcurve |
|---|---|---|---|---|---|---|---|
| A | 7264 | 6080 | 0 | 0 | 0.00% | 0.00% | 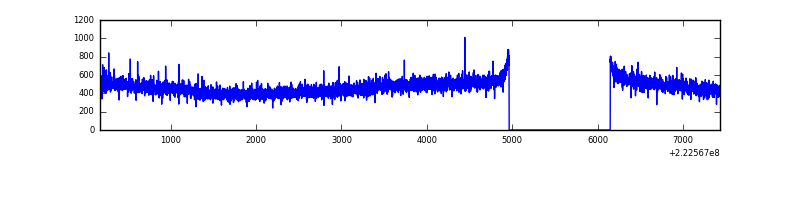 |
| B | 7264 | 6079 | 2 | 2 | 0.03% | 0.03% | 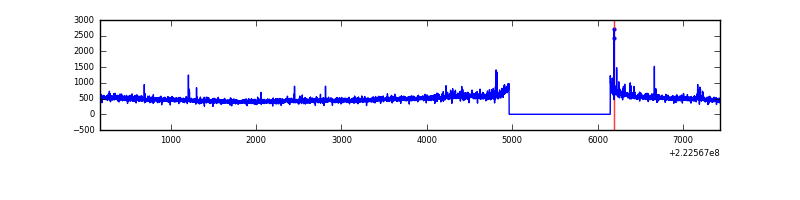 |
| C | 7264 | 6080 | 0 | 0 | 0.00% | 0.00% | 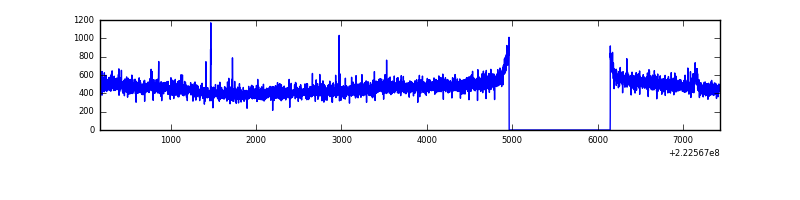 |
| D | 7264 | 6079 | 55 | 55 | 0.76% | 0.90% | 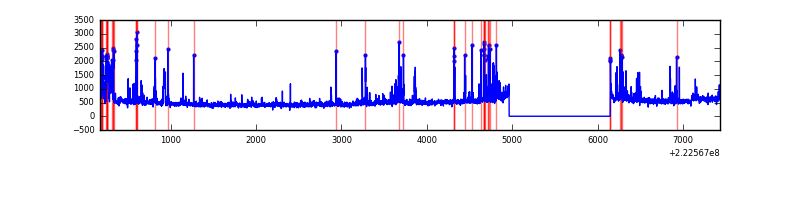 |
Top three noisy pixels from each quadrant. If the there are fewer than three noisy pixels in the level2.evt file, extra rows are filled as -1
| Pixel properties | Quadrant properties | ||||||
|---|---|---|---|---|---|---|---|
| Quadrant | DetID | PixID | Counts | Sigma | Mean | Median | Sigma |
| A | 0 | 226 | 7022 | 41.83 | 732 | 718 | 150.7 |
| A | 12 | 194 | 6541 | 38.64 | 732 | 718 | 150.7 |
| A | 13 | 254 | 2657 | 12.87 | 732 | 718 | 150.7 |
| B | 0 | 214 | 66683 | 463.61 | 744 | 729 | 142.3 |
| B | 0 | 219 | 32262 | 221.66 | 744 | 729 | 142.3 |
| B | 0 | 245 | 17295 | 116.45 | 744 | 729 | 142.3 |
| C | 9 | 68 | 17970 | 103.49 | 717 | 724 | 166.6 |
| C | 4 | 254 | 8897 | 49.05 | 717 | 724 | 166.6 |
| C | 1 | 3 | 6643 | 35.52 | 717 | 724 | 166.6 |
| D | 8 | 195 | 194997 | 1121.44 | 702 | 684 | 173.3 |
| D | 2 | 216 | 165506 | 951.24 | 702 | 684 | 173.3 |
| D | 13 | 137 | 132754 | 762.22 | 702 | 684 | 173.3 |
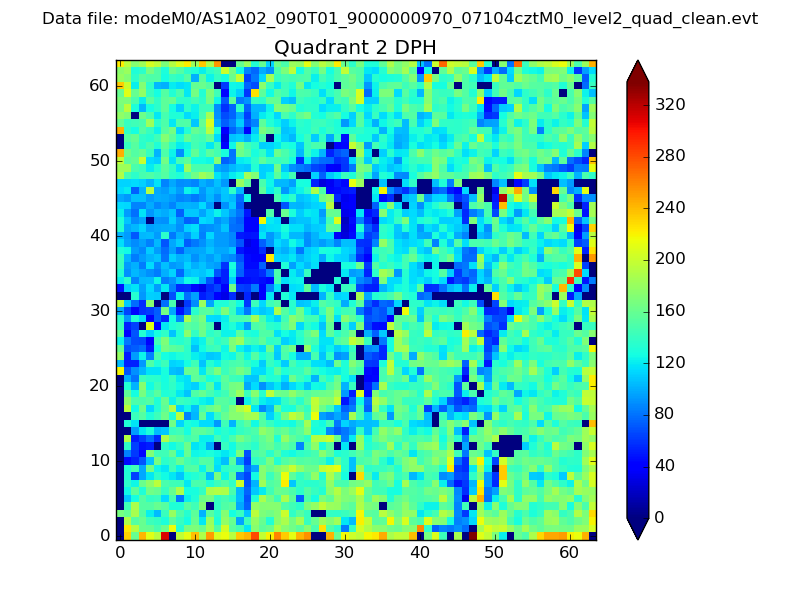
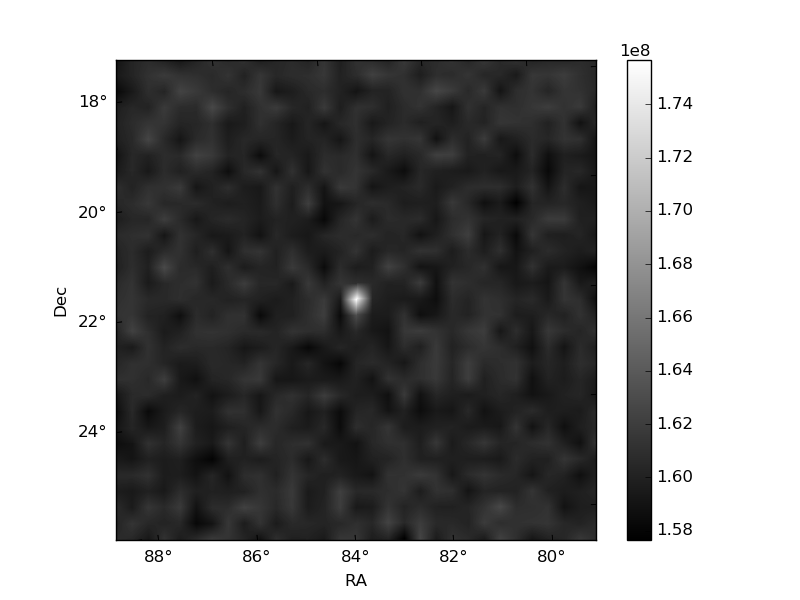
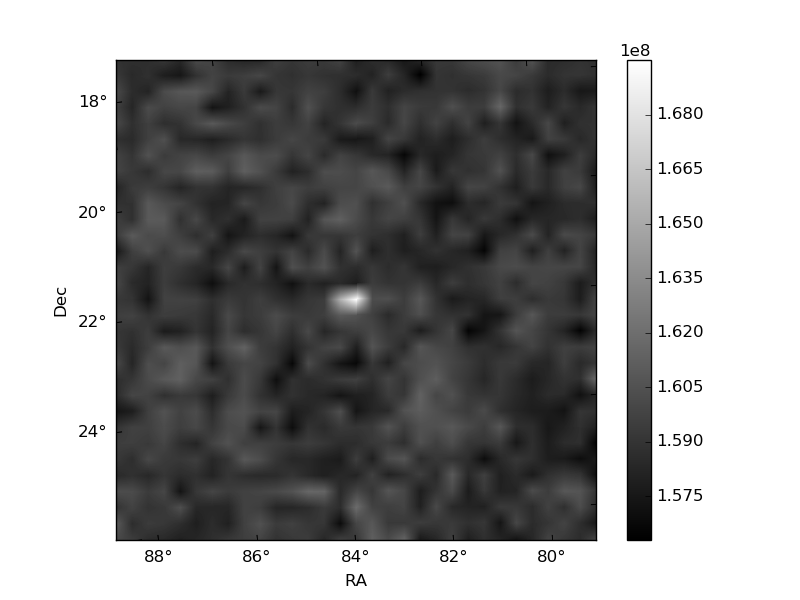
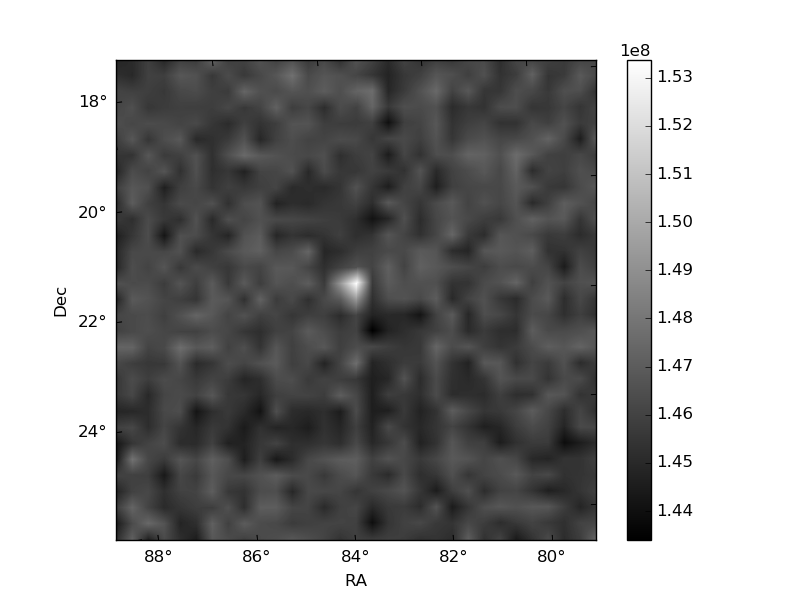
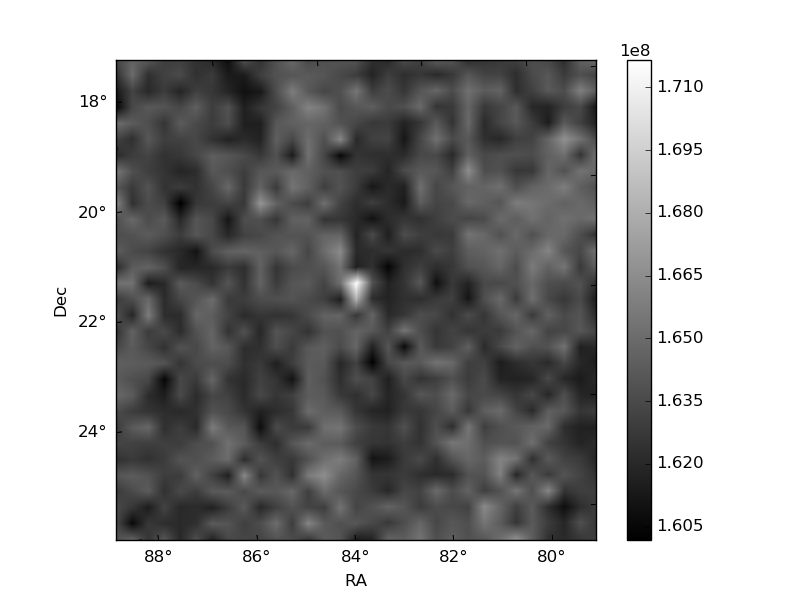
Histogram calculated using DETX and DETY for each event in the final _common_clean file
| Quadrant A | 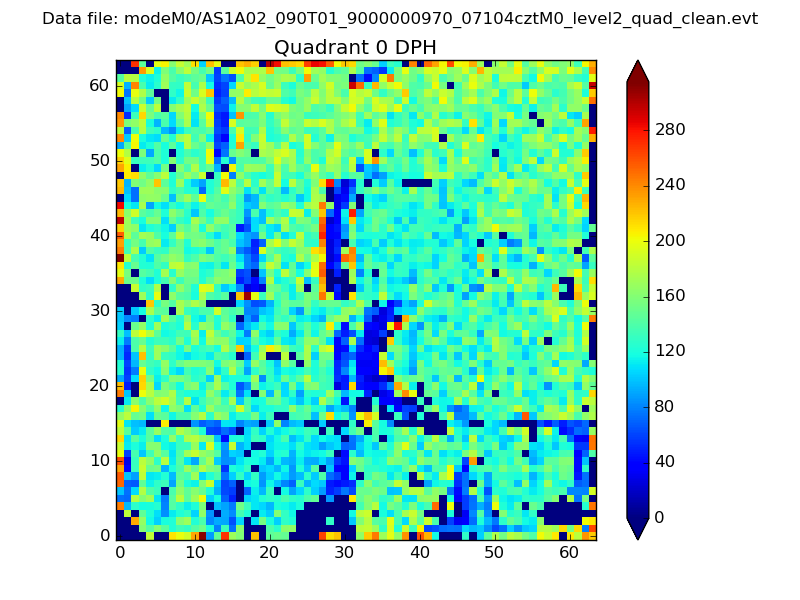 |
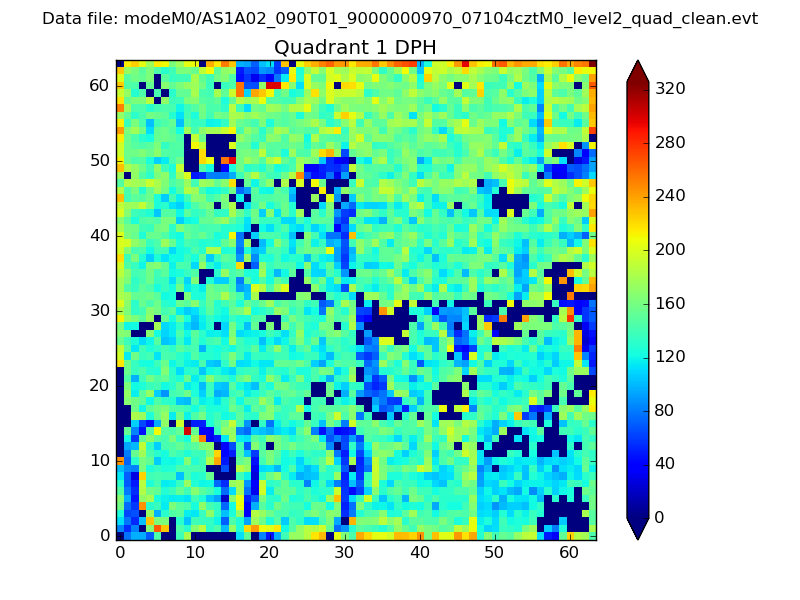 |
Quadrant B |
|---|---|---|---|
| Quadrant D | 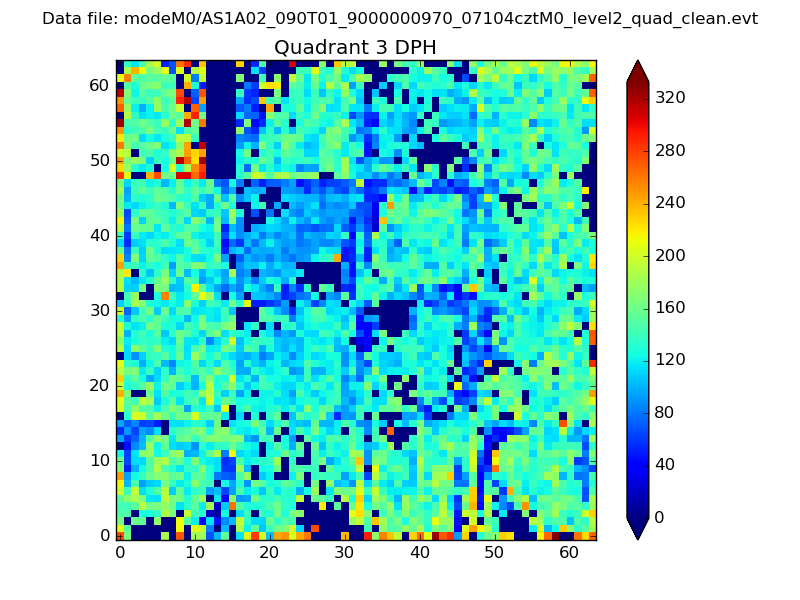 |
 |
Quadrant C |
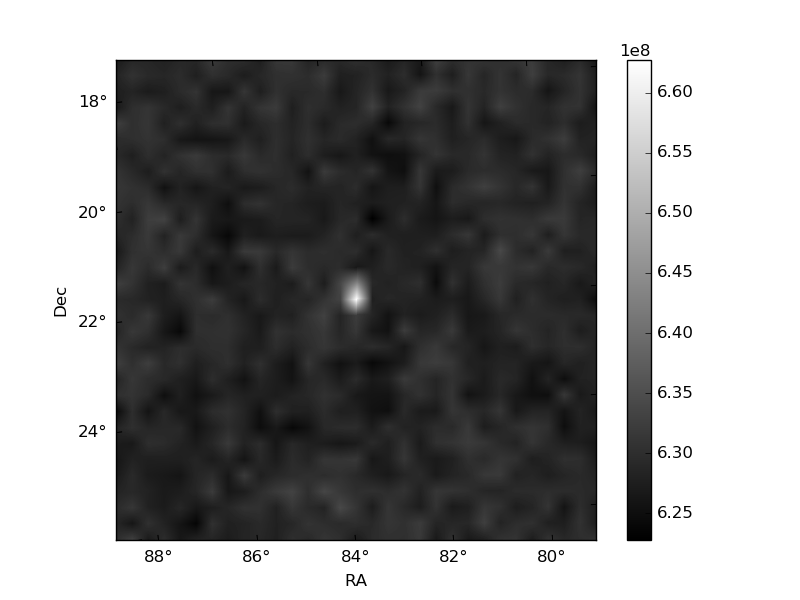
| Plot type | Count rate plots | Images |
|---|---|---|
| Comparison with Poisson distribution Blue bars denote a histogram of data divided into 1 sec bins. Red curve is a Poisson curve with rate = median count rate of data. |
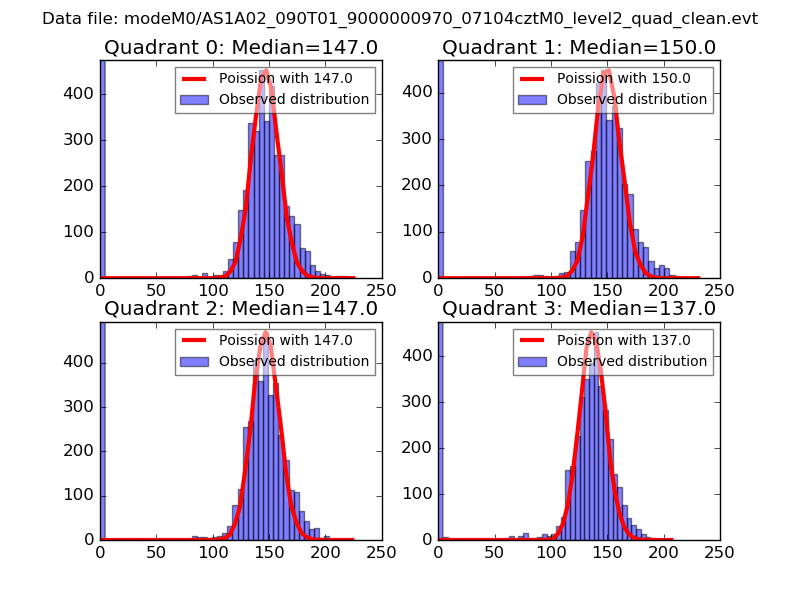 |
 |
| Quadrant-wise count rates Data is divided into 100 sec bins |
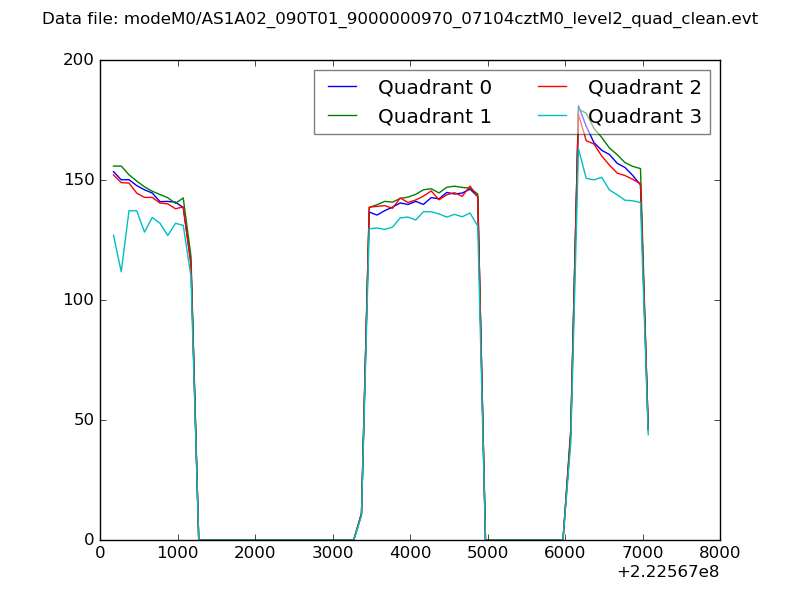 |
|
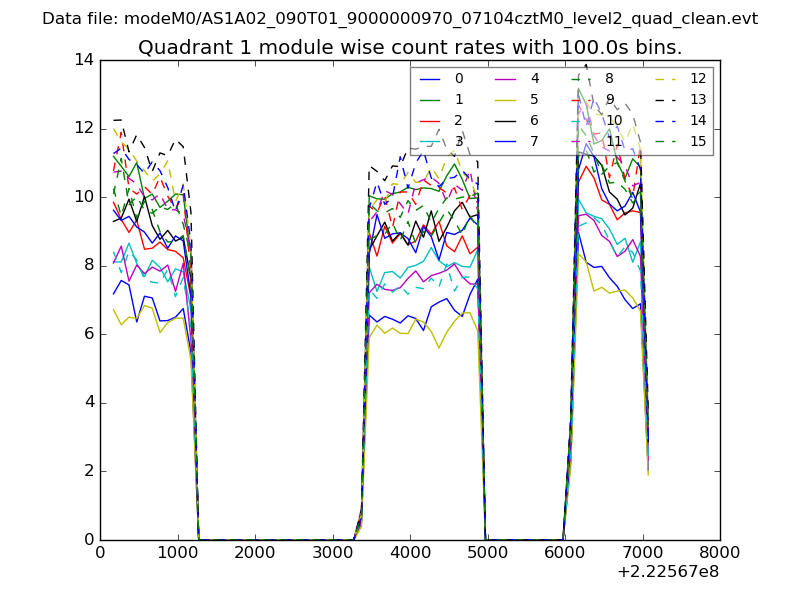
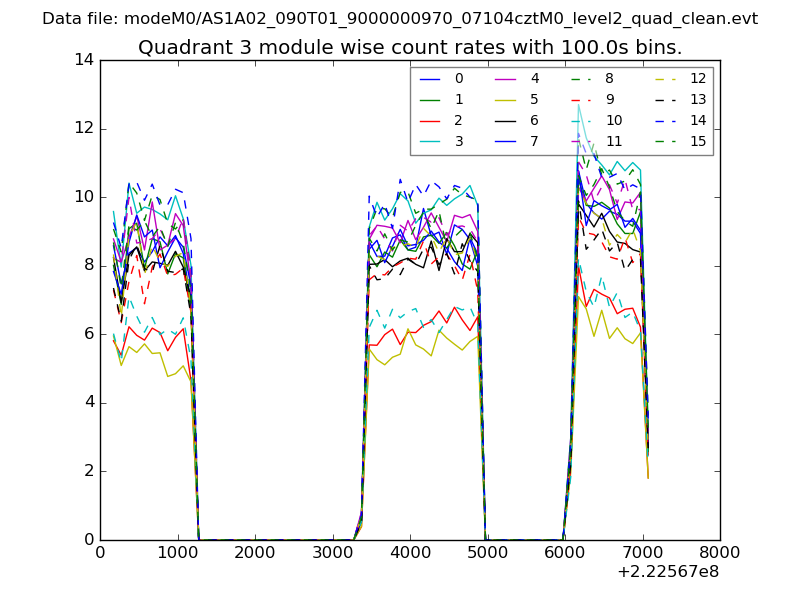
| Module-wise count rates for Quadrant A Data is divided into 100 sec bins |
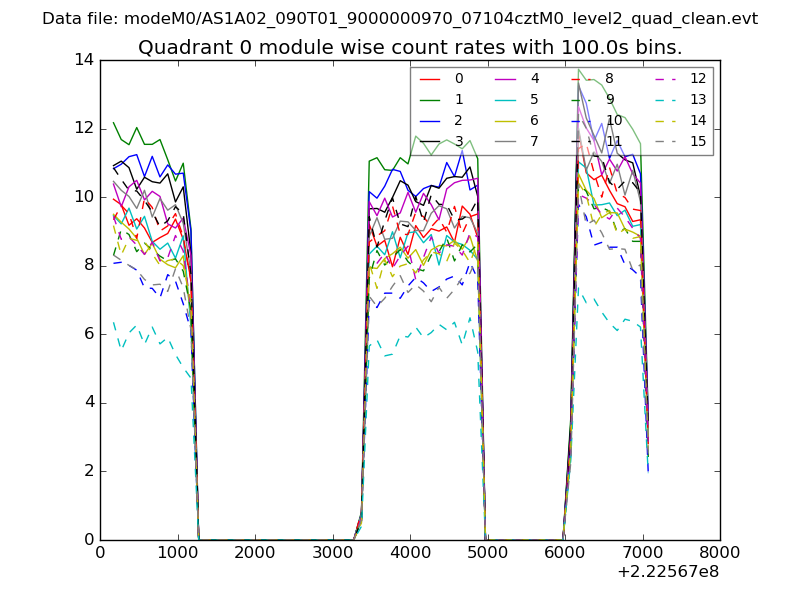 |
 |
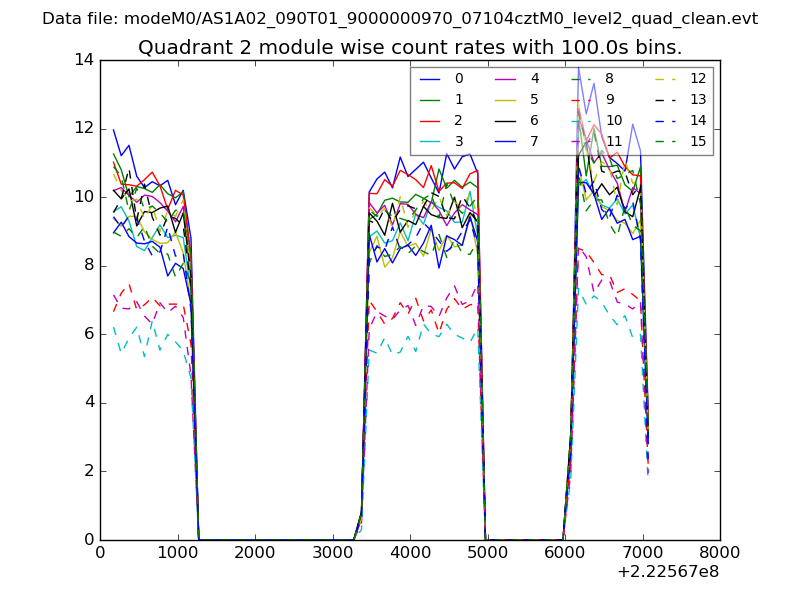
| Module-wise count rates for Quadrant B Data is divided into 100 sec bins |
 |
 |
| Module-wise count rates for Quadrant C Data is divided into 100 sec bins |
 |
 |
| Module-wise count rates for Quadrant D Data is divided into 100 sec bins |
 |
 |
| Parameter | Plot |
|---|---|
| CZT HV Monitor | 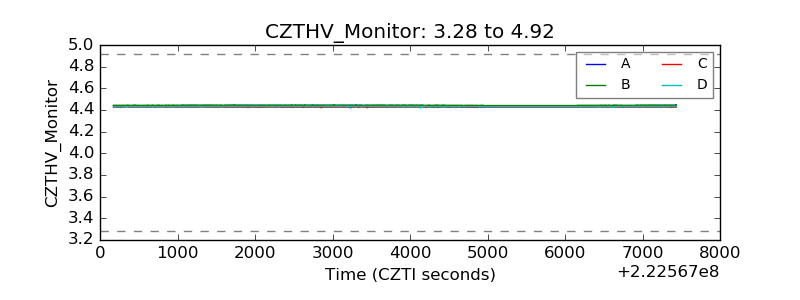 |
| D_VDD | 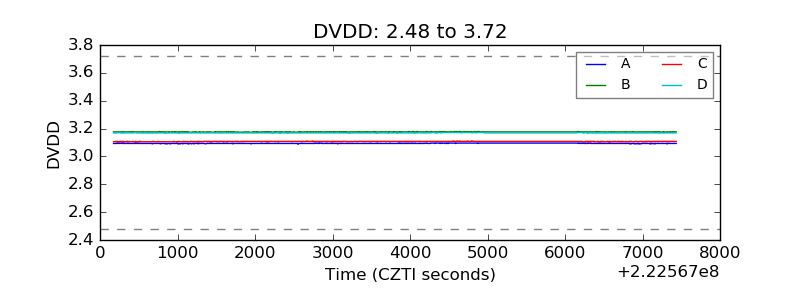 |
| Temperature 1 |  |
| Veto HV Monitor | 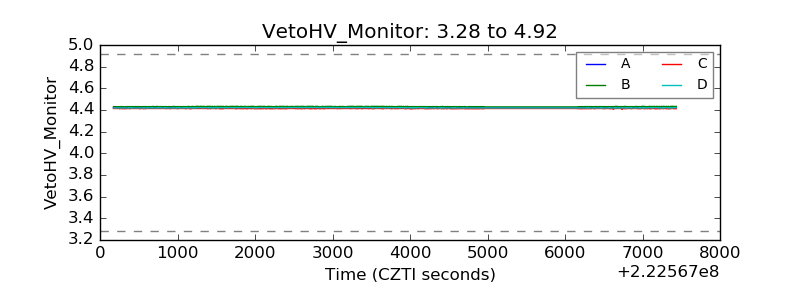 |
| Veto LLD | 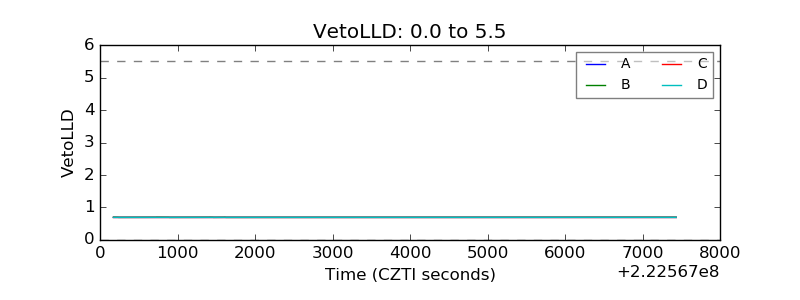 |
| Alpha Counter | 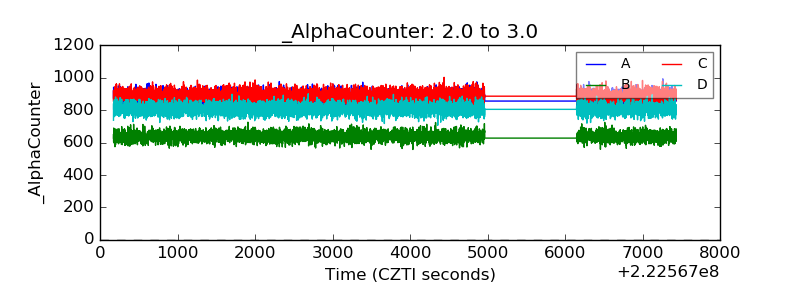 |
| _CPM_Rate | 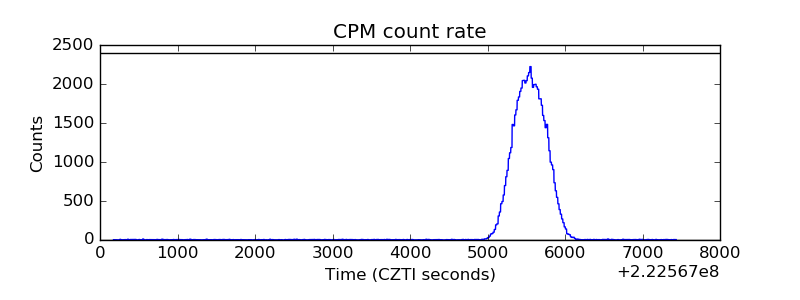 |
| CZT Counter | 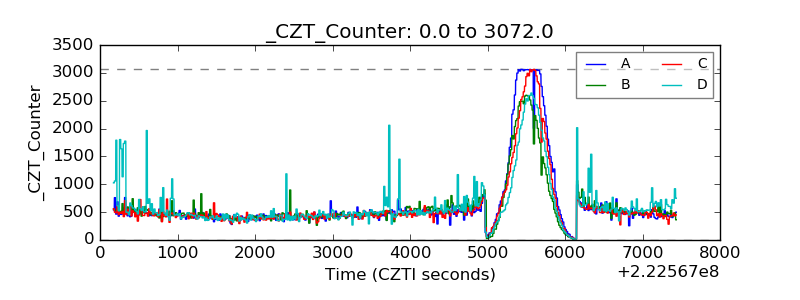 |
| +2.5 Volts monitor | 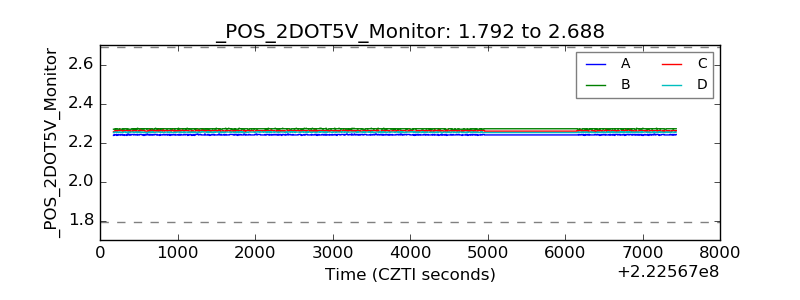 |
| +5 Volts monitor |  |
| _ROLL_ROT | 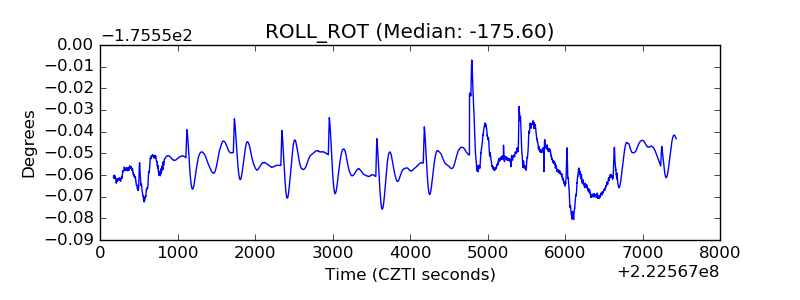 |
| _Roll_DEC | 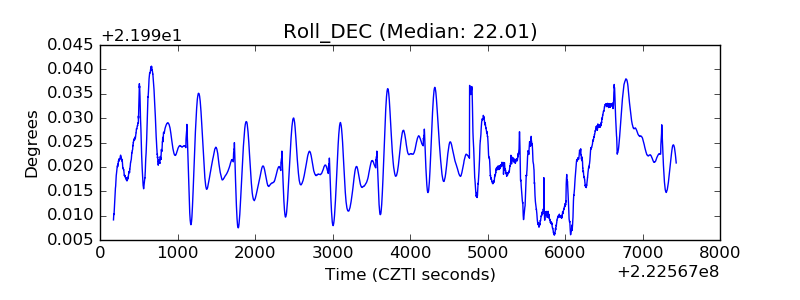 |
| _Roll_RA | 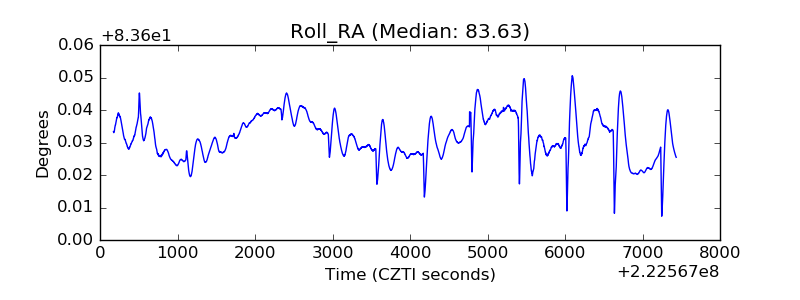 |
| Veto Counter | 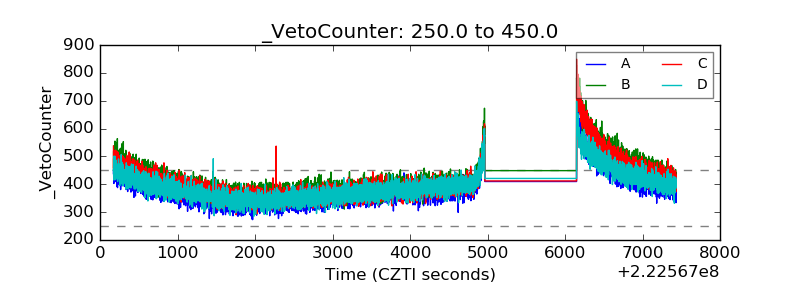 |