| Param | Original file | Final file |
|---|---|---|
| Filename | modeM0/AS1A02_090T01_9000000970_07105cztM0_level2.evt | modeM0/AS1A02_090T01_9000000970_07105cztM0_level2_quad_clean.evt |
| Size (bytes) | 454,587,840 | 82,368,000 |
| Size | 433.5 MB | 78.6 MB |
| Events in quadrant A | 3,125,976 | 518,063 |
| Events in quadrant B | 3,371,794 | 529,227 |
| Events in quadrant C | 3,135,302 | 512,183 |
| Events in quadrant D | 3,691,490 | 480,336 |
| Mode M0 | |||
|---|---|---|---|
| Quadrant | BADHDUFLAG | Total packets | Discarded packets |
| A | 0 | 13399 | 3 |
| B | 0 | 14123 | 2 |
| C | 0 | 13442 | 2 |
| D | 0 | 15137 | 2 |
| Mode M9 | |||
|---|---|---|---|
| Quadrant | BADHDUFLAG | Total packets | Discarded packets |
| A | 0 | 14 | 0 |
| B | 0 | 14 | 0 |
| C | 0 | 14 | 0 |
| D | 0 | 15 | 0 |
| Mode SS | |||
|---|---|---|---|
| Quadrant | BADHDUFLAG | Total packets | Discarded packets |
| A | 0 | 134 | 0 |
| B | 0 | 134 | 0 |
| C | 0 | 134 | 0 |
| D | 0 | 134 | 0 |
| Quadrant | Total seconds | Saturated seconds | Saturation percentage |
|---|---|---|---|
| A | 6509 | 9 | 0.138270% |
| B | 6509 | 27 | 0.414810% |
| C | 6509 | 23 | 0.353357% |
| D | 6509 | 39 | 0.599170% |
Noise dominated data is calculated using 1-second bins in cleaned event files. If a bin has >2000 counts, and if more than 50% of those come from <1% of pixels, then it is considered to be noise-dominated and hence unusable.
| Quadrant | # 1 sec bins | Bins with >0 counts | Bins with >2000 counts | High rate bins dominated by noise | Noise dominated (total time) | Noise dominated (detector-on time) | Marked lightcurve |
|---|---|---|---|---|---|---|---|
| A | 7759 | 6509 | 0 | 0 | 0.00% | 0.00% | 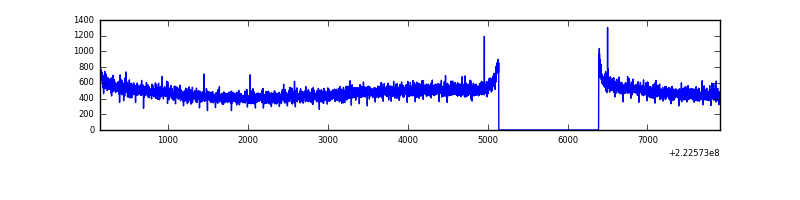 |
| B | 7759 | 6509 | 2 | 2 | 0.03% | 0.03% | 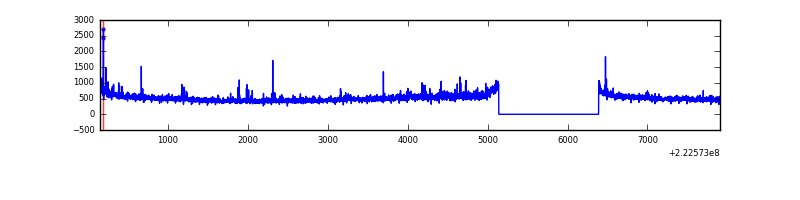 |
| C | 7759 | 6510 | 0 | 0 | 0.00% | 0.00% | 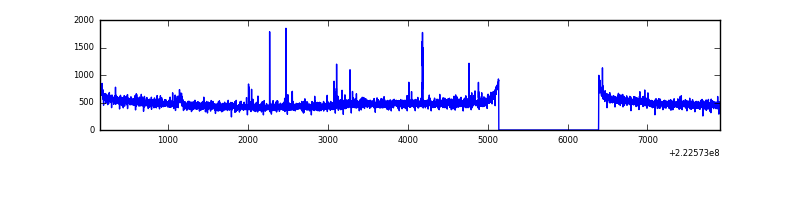 |
| D | 7759 | 6510 | 24 | 24 | 0.31% | 0.37% | 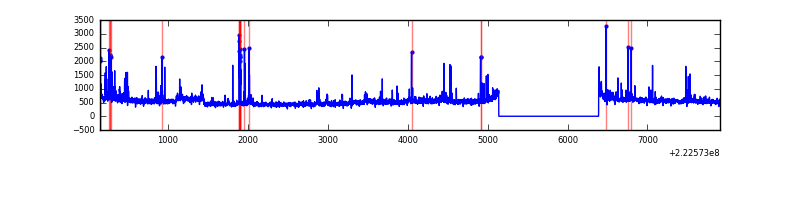 |
Top three noisy pixels from each quadrant. If the there are fewer than three noisy pixels in the level2.evt file, extra rows are filled as -1
| Pixel properties | Quadrant properties | ||||||
|---|---|---|---|---|---|---|---|
| Quadrant | DetID | PixID | Counts | Sigma | Mean | Median | Sigma |
| A | 0 | 226 | 7427 | 40.71 | 809 | 793 | 163.0 |
| A | 12 | 194 | 7407 | 40.59 | 809 | 793 | 163.0 |
| A | 3 | 1 | 5909 | 31.39 | 809 | 793 | 163.0 |
| B | 0 | 214 | 87358 | 556.9 | 825 | 810 | 155.4 |
| B | 4 | 81 | 43375 | 273.89 | 825 | 810 | 155.4 |
| B | 0 | 219 | 33396 | 209.68 | 825 | 810 | 155.4 |
| C | 4 | 254 | 38564 | 206.84 | 790 | 799 | 182.6 |
| C | 9 | 68 | 9459 | 47.43 | 790 | 799 | 182.6 |
| C | 13 | 61 | 6242 | 29.81 | 790 | 799 | 182.6 |
| D | 8 | 195 | 258486 | 1346.07 | 780 | 761 | 191.5 |
| D | 1 | 20 | 206509 | 1074.6 | 780 | 761 | 191.5 |
| D | 2 | 216 | 126441 | 656.41 | 780 | 761 | 191.5 |
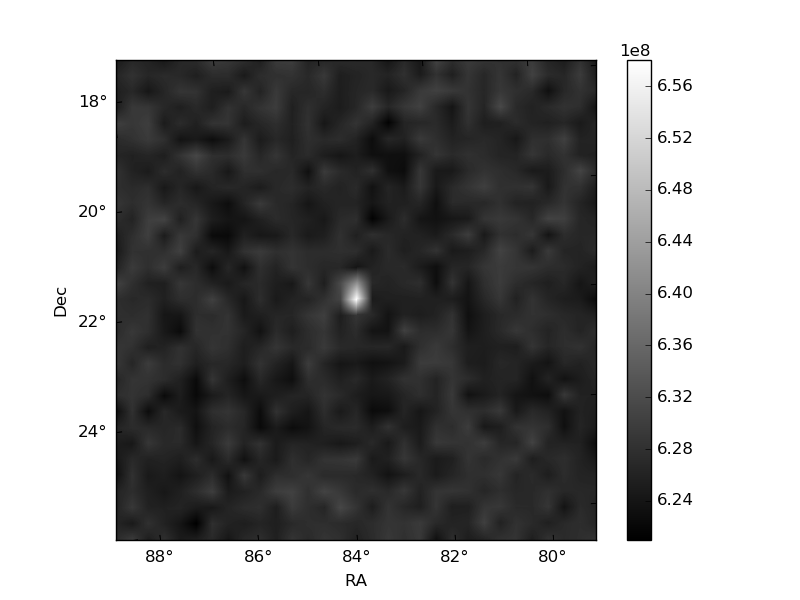
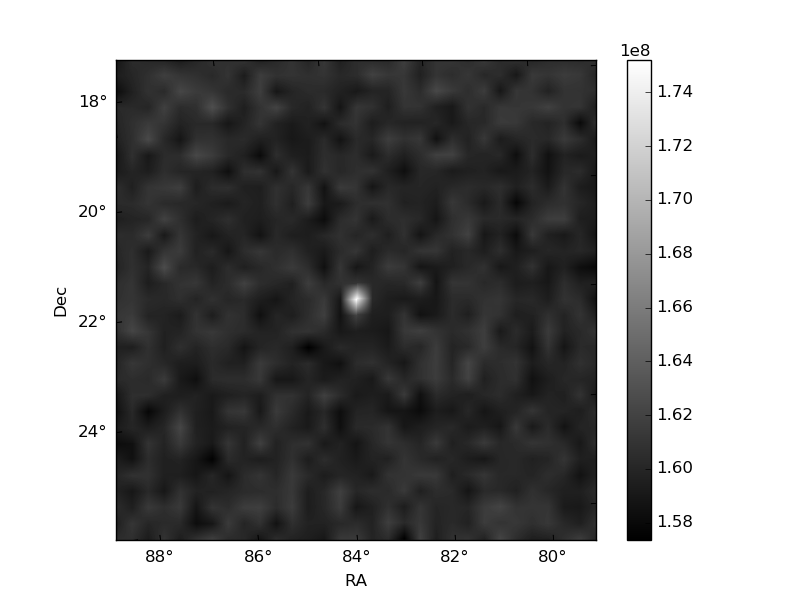
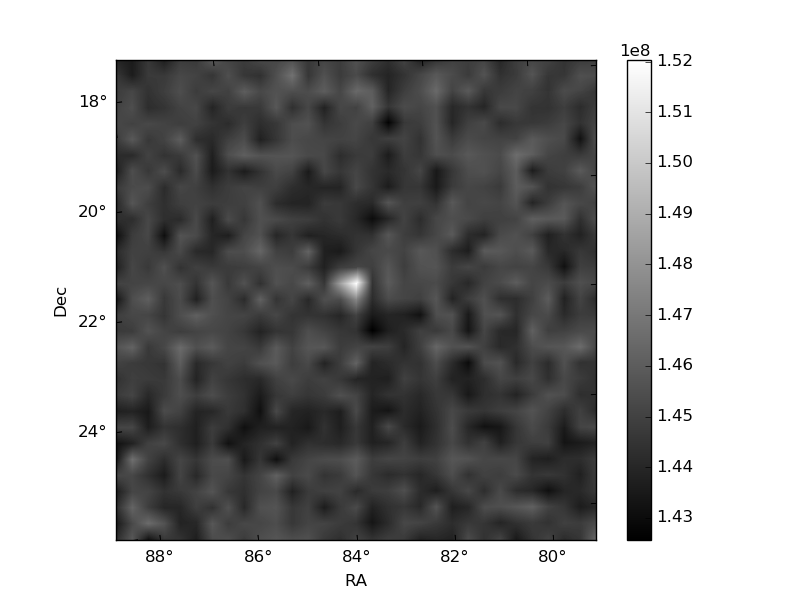
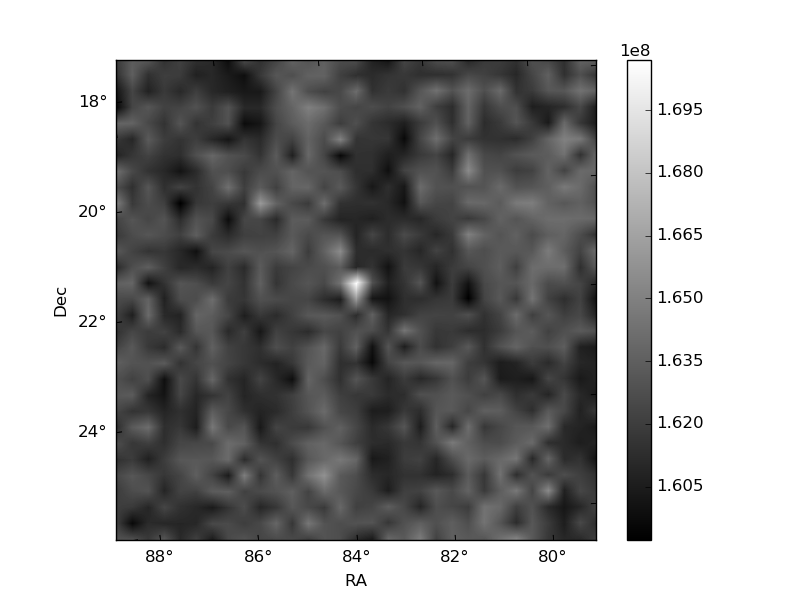
Histogram calculated using DETX and DETY for each event in the final _common_clean file
| Quadrant A | 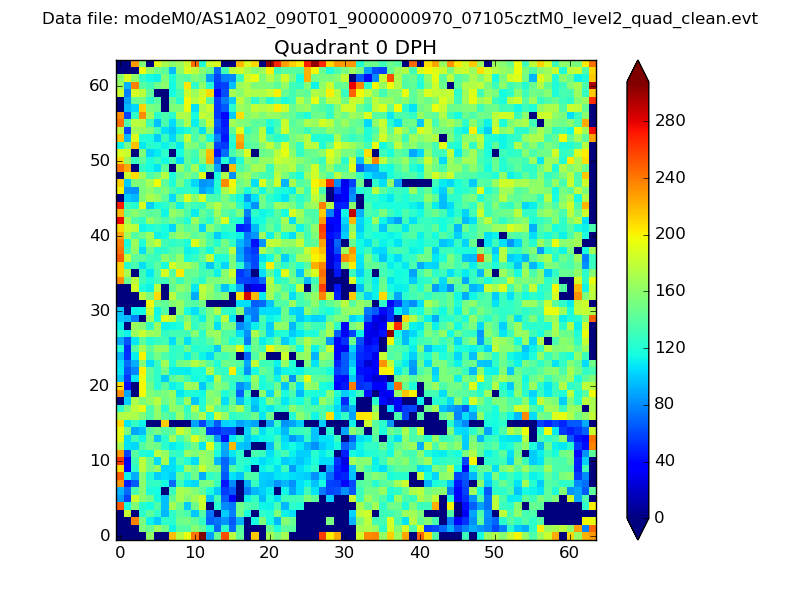 |
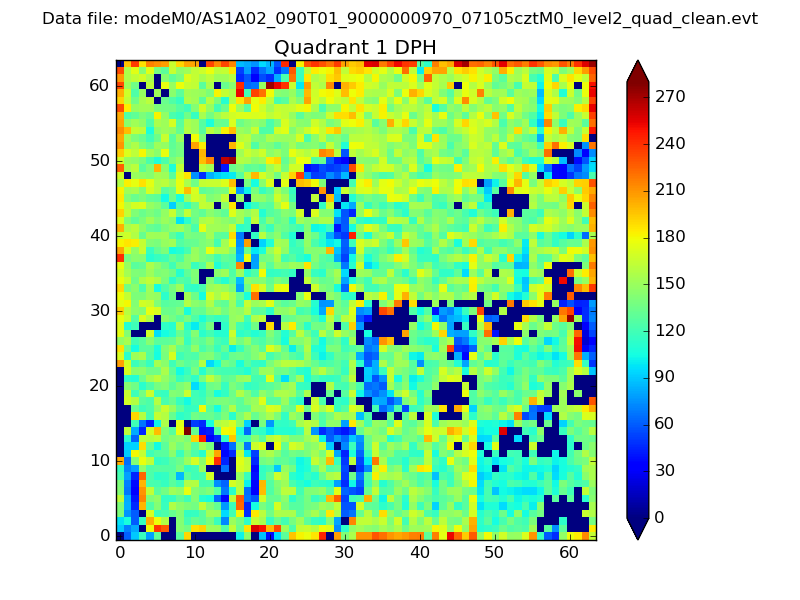 |
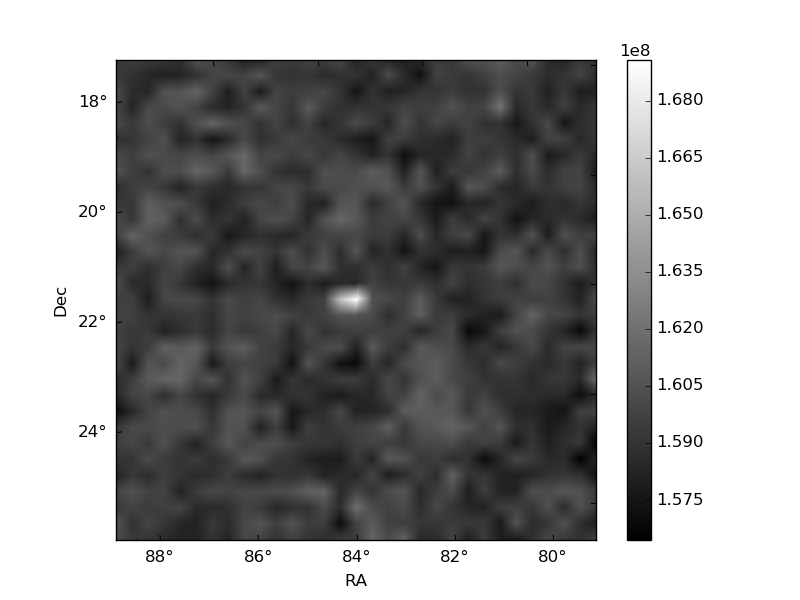
Quadrant B |
|---|---|---|---|
| Quadrant D | 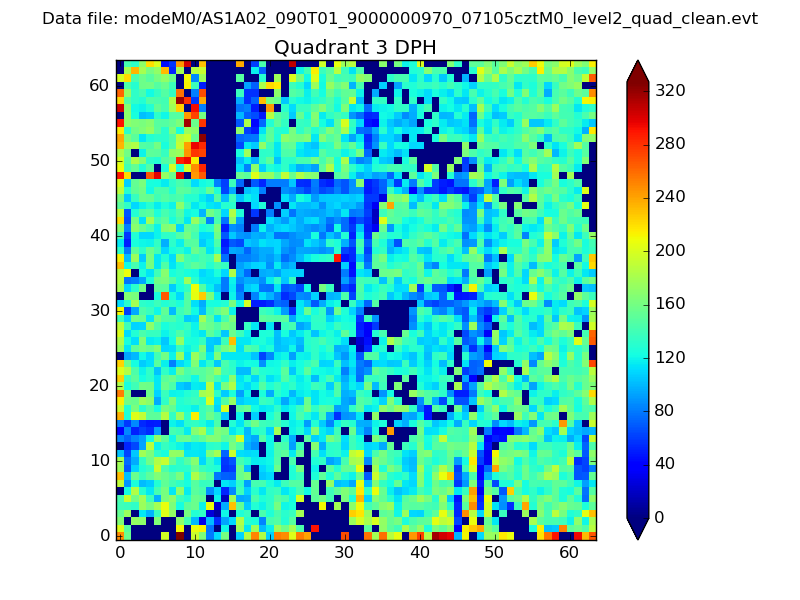 |
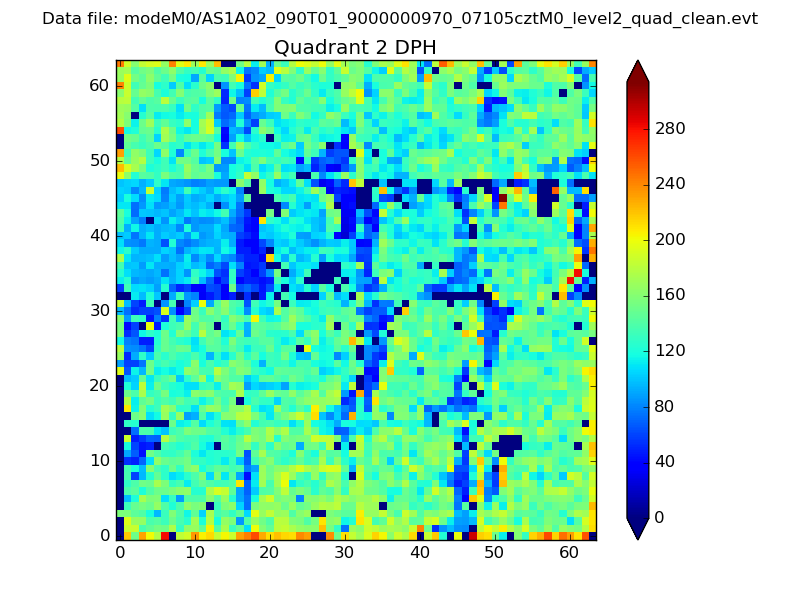 |
Quadrant C |
| Plot type | Count rate plots | Images |
|---|---|---|
| Comparison with Poisson distribution Blue bars denote a histogram of data divided into 1 sec bins. Red curve is a Poisson curve with rate = median count rate of data. |
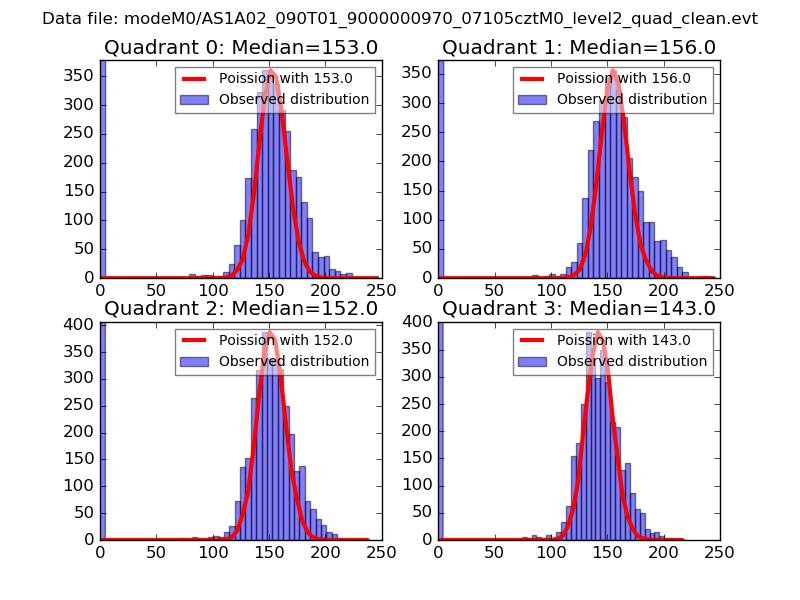 |
 |
| Quadrant-wise count rates Data is divided into 100 sec bins |
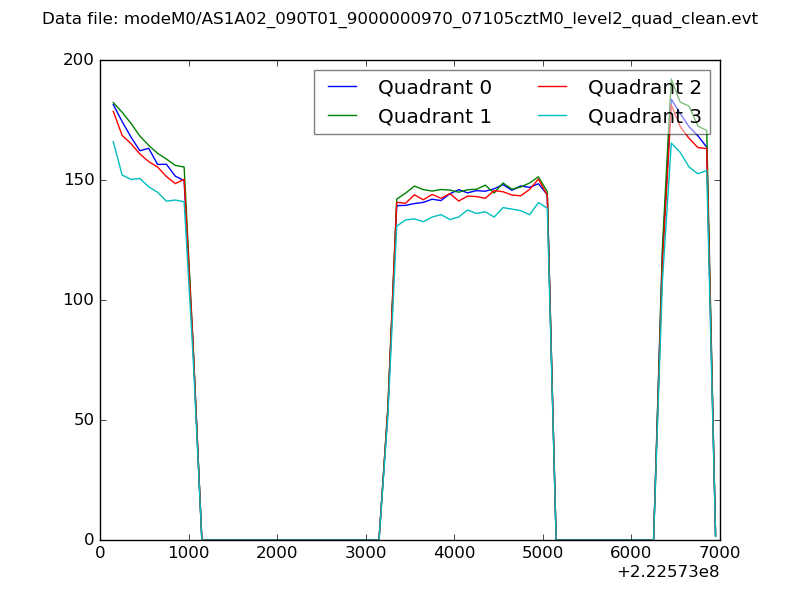 |
|
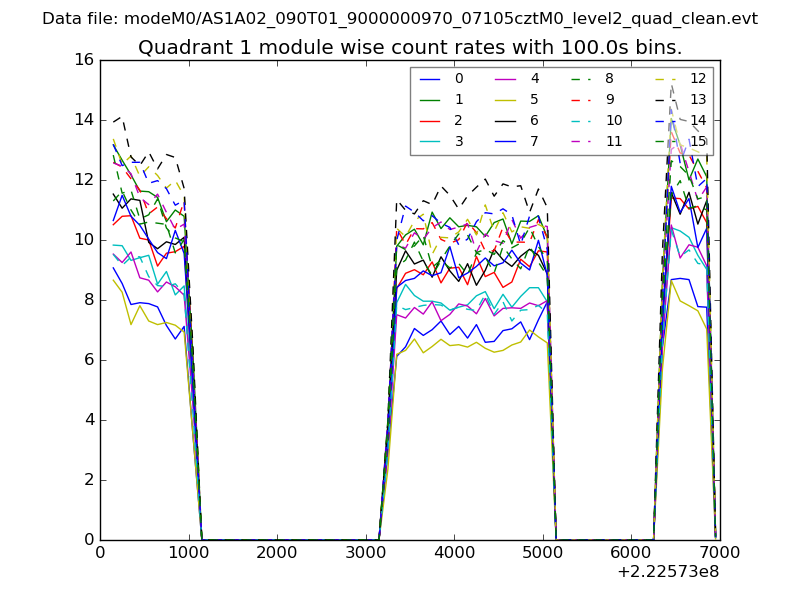
| Module-wise count rates for Quadrant A Data is divided into 100 sec bins |
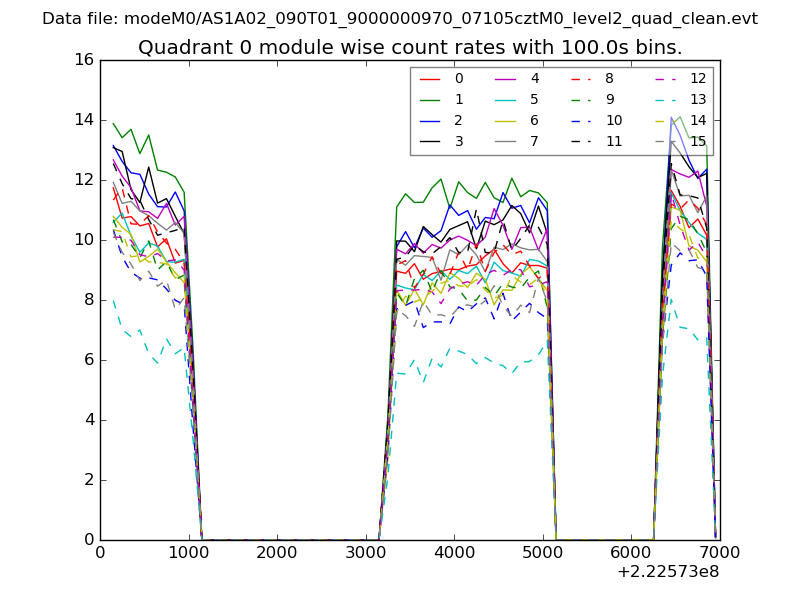 |
 |
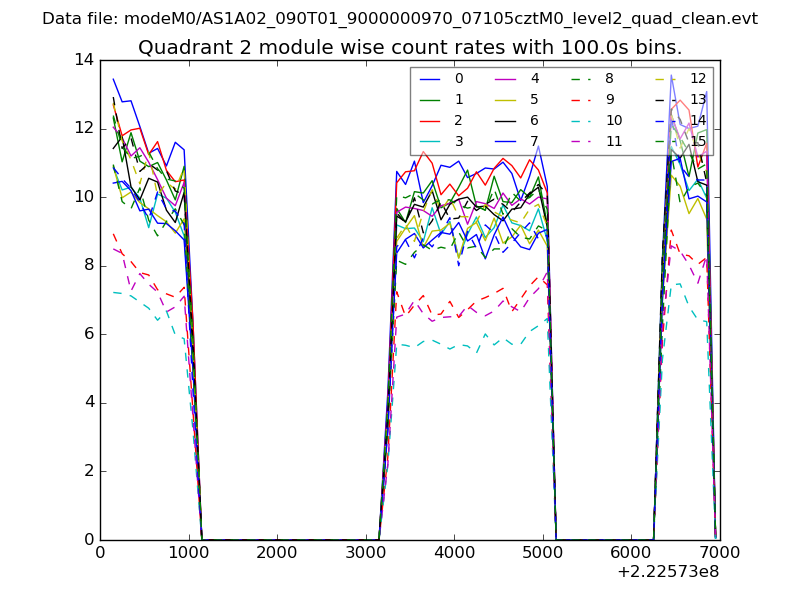
| Module-wise count rates for Quadrant B Data is divided into 100 sec bins |
 |
 |
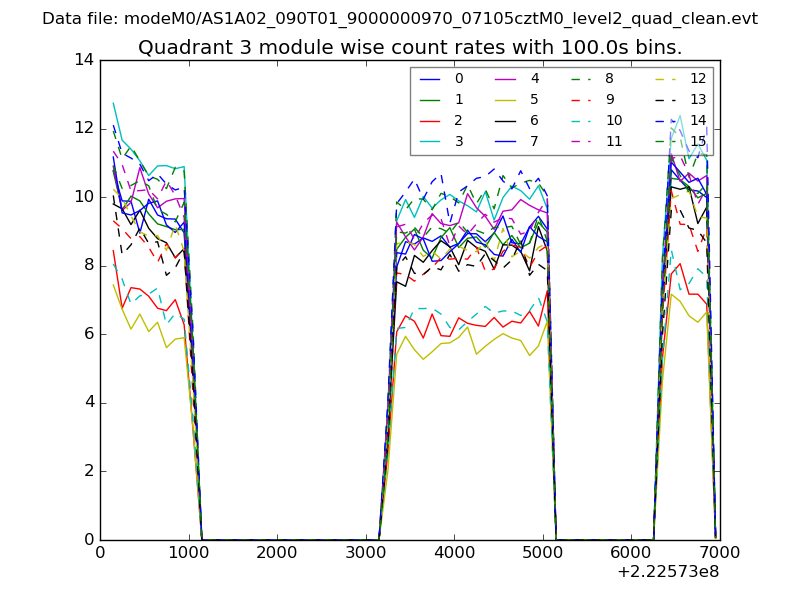
| Module-wise count rates for Quadrant C Data is divided into 100 sec bins |
 |
 |
| Module-wise count rates for Quadrant D Data is divided into 100 sec bins |
 |
 |
| Parameter | Plot |
|---|---|
| CZT HV Monitor | 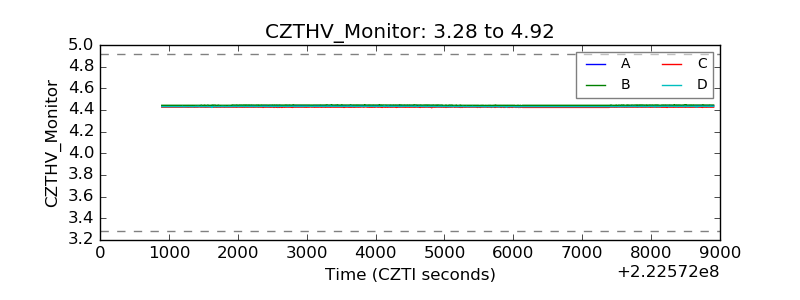 |
| D_VDD | 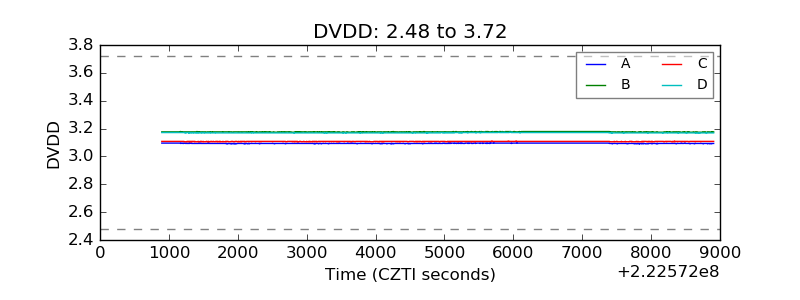 |
| Temperature 1 | 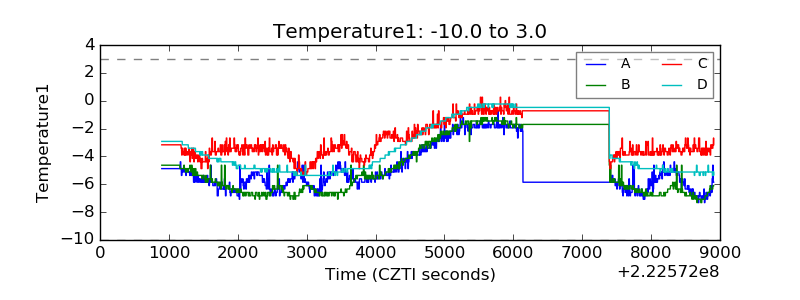 |
| Veto HV Monitor | 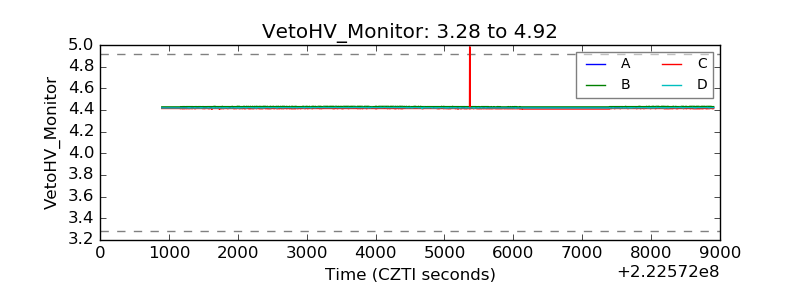 |
| Veto LLD | 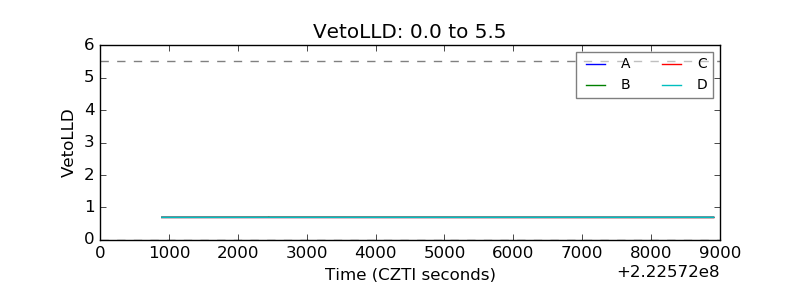 |
| Alpha Counter | 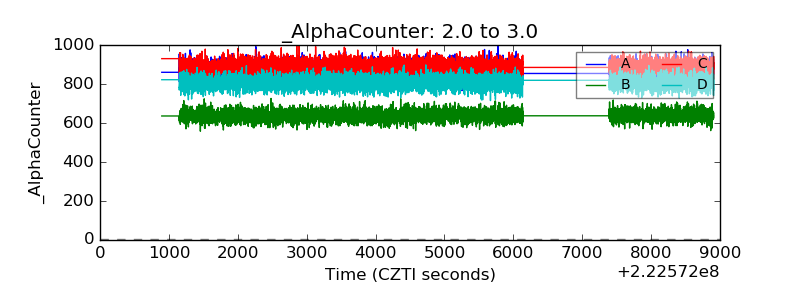 |
| _CPM_Rate | 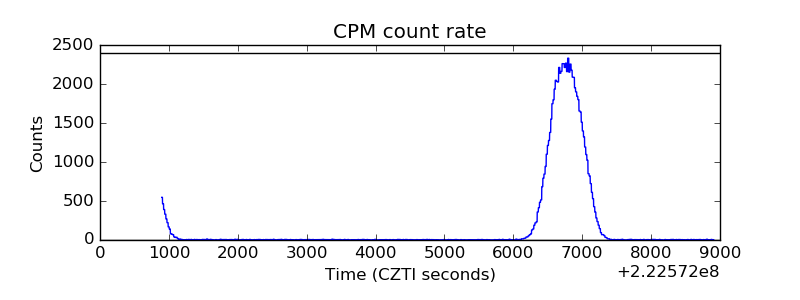 |
| CZT Counter | 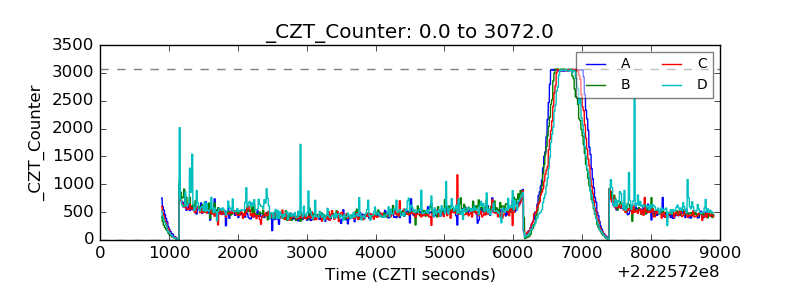 |
| +2.5 Volts monitor | 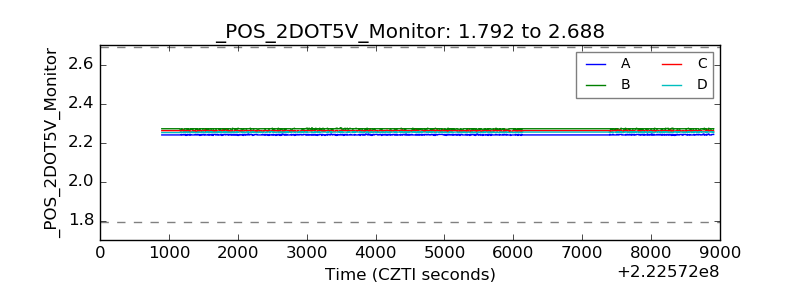 |
| +5 Volts monitor |  |
| _ROLL_ROT | 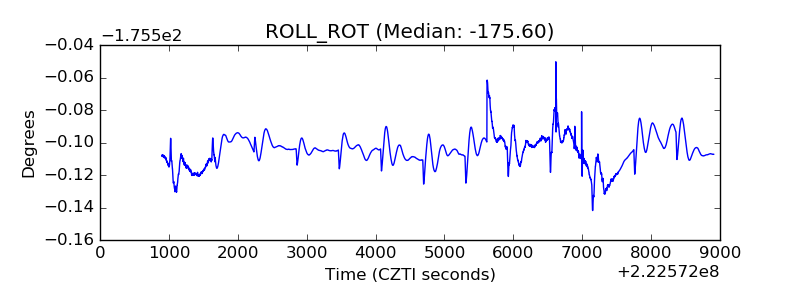 |
| _Roll_DEC | 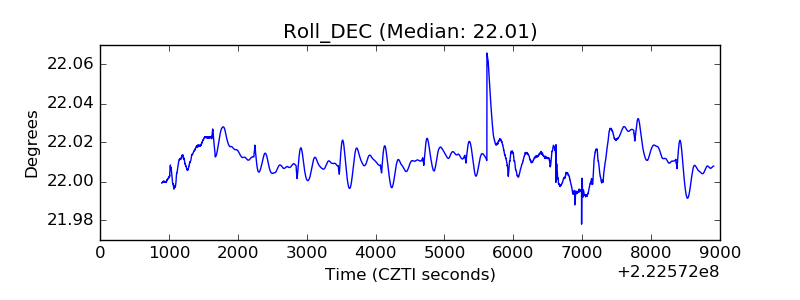 |
| _Roll_RA | 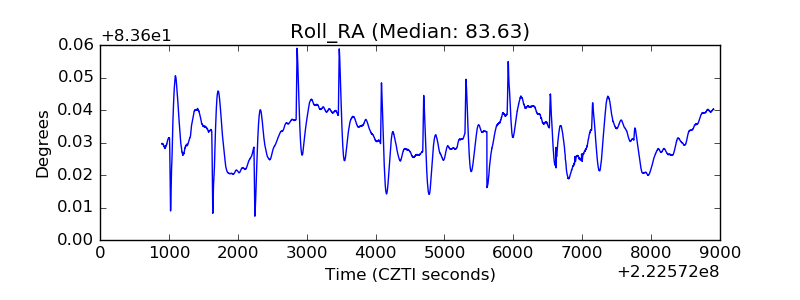 |
| Veto Counter | 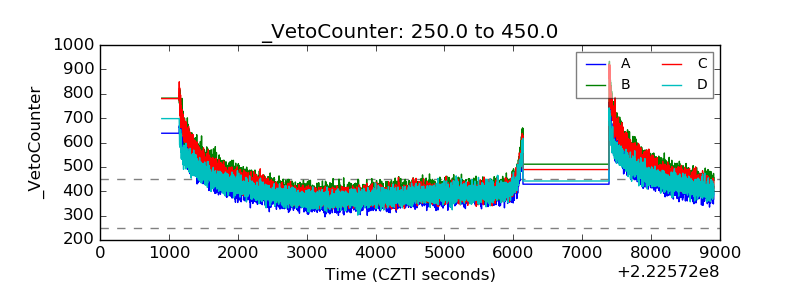 |