| Param | Original file | Final file |
|---|---|---|
| Filename | modeM0/AS1A02_090T01_9000000970_07107cztM0_level2.evt | modeM0/AS1A02_090T01_9000000970_07107cztM0_level2_quad_clean.evt |
| Size (bytes) | 450,763,200 | 68,952,960 |
| Size | 429.9 MB | 65.8 MB |
| Events in quadrant A | 3,205,393 | 415,905 |
| Events in quadrant B | 3,324,713 | 422,119 |
| Events in quadrant C | 3,184,592 | 412,535 |
| Events in quadrant D | 3,499,970 | 388,857 |
| Mode M0 | |||
|---|---|---|---|
| Quadrant | BADHDUFLAG | Total packets | Discarded packets |
| A | 0 | 13406 | 3 |
| B | 0 | 13677 | 2 |
| C | 0 | 13482 | 2 |
| D | 0 | 14490 | 2 |
| Mode M9 | |||
|---|---|---|---|
| Quadrant | BADHDUFLAG | Total packets | Discarded packets |
| A | 0 | 18 | 0 |
| B | 0 | 18 | 0 |
| C | 0 | 18 | 0 |
| D | 0 | 19 | 0 |
| Mode SS | |||
|---|---|---|---|
| Quadrant | BADHDUFLAG | Total packets | Discarded packets |
| A | 0 | 132 | 0 |
| B | 0 | 132 | 0 |
| C | 0 | 132 | 0 |
| D | 0 | 132 | 0 |
| Quadrant | Total seconds | Saturated seconds | Saturation percentage |
|---|---|---|---|
| A | 6422 | 87 | 1.354718% |
| B | 6422 | 106 | 1.650576% |
| C | 6422 | 67 | 1.043289% |
| D | 6422 | 105 | 1.635005% |
Noise dominated data is calculated using 1-second bins in cleaned event files. If a bin has >2000 counts, and if more than 50% of those come from <1% of pixels, then it is considered to be noise-dominated and hence unusable.
| Quadrant | # 1 sec bins | Bins with >0 counts | Bins with >2000 counts | High rate bins dominated by noise | Noise dominated (total time) | Noise dominated (detector-on time) | Marked lightcurve |
|---|---|---|---|---|---|---|---|
| A | 7667 | 6422 | 3 | 3 | 0.04% | 0.05% | 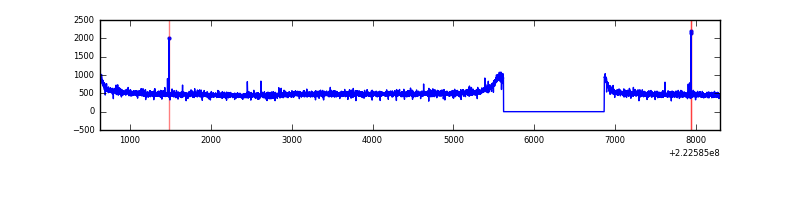 |
| B | 7667 | 6422 | 2 | 2 | 0.03% | 0.03% | 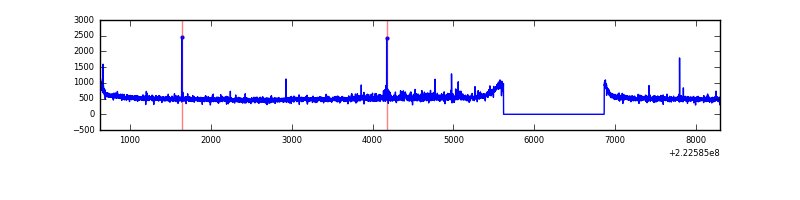 |
| C | 7667 | 6422 | 2 | 2 | 0.03% | 0.03% | 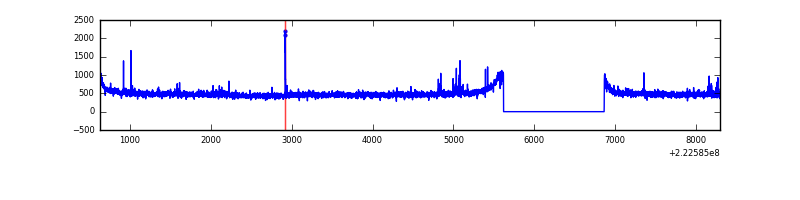 |
| D | 7667 | 6422 | 38 | 38 | 0.50% | 0.59% | 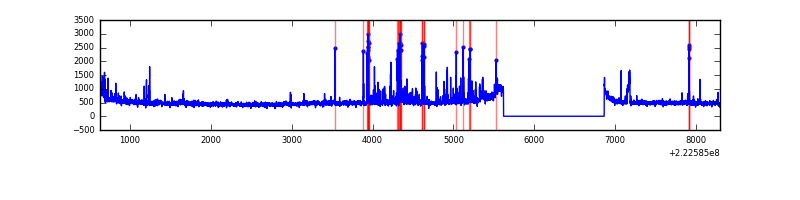 |
Top three noisy pixels from each quadrant. If the there are fewer than three noisy pixels in the level2.evt file, extra rows are filled as -1
| Pixel properties | Quadrant properties | ||||||
|---|---|---|---|---|---|---|---|
| Quadrant | DetID | PixID | Counts | Sigma | Mean | Median | Sigma |
| A | 14 | 111 | 20486 | 117.41 | 825 | 810 | 167.6 |
| A | 13 | 14 | 10137 | 55.65 | 825 | 810 | 167.6 |
| A | 0 | 226 | 7851 | 42.01 | 825 | 810 | 167.6 |
| B | 0 | 214 | 66569 | 415.67 | 836 | 820 | 158.2 |
| B | 12 | 111 | 15515 | 92.9 | 836 | 820 | 158.2 |
| B | 0 | 219 | 12592 | 74.42 | 836 | 820 | 158.2 |
| C | 4 | 254 | 46807 | 248.26 | 800 | 809 | 185.3 |
| C | 10 | 22 | 8635 | 42.24 | 800 | 809 | 185.3 |
| C | 13 | 61 | 6235 | 29.28 | 800 | 809 | 185.3 |
| D | 2 | 216 | 257465 | 1338.3 | 789 | 767 | 191.8 |
| D | 8 | 195 | 131967 | 684.02 | 789 | 767 | 191.8 |
| D | 1 | 20 | 60070 | 309.18 | 789 | 767 | 191.8 |
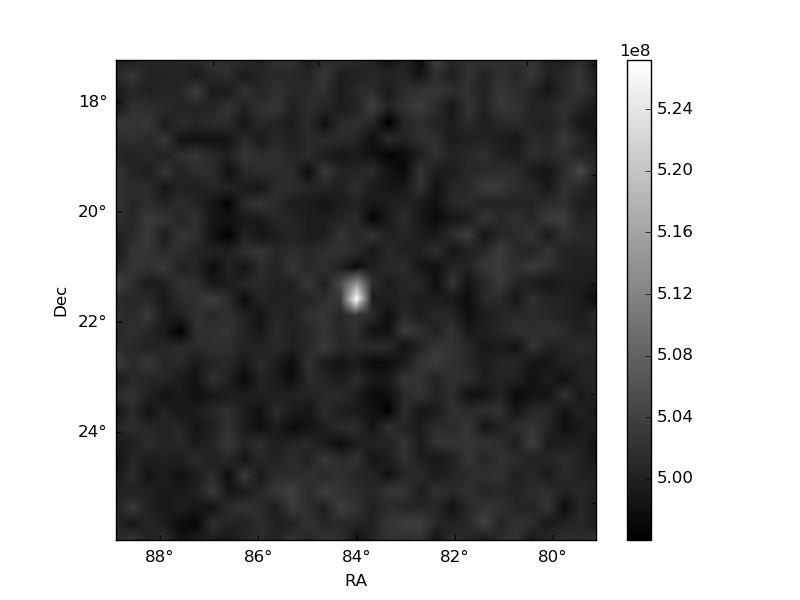
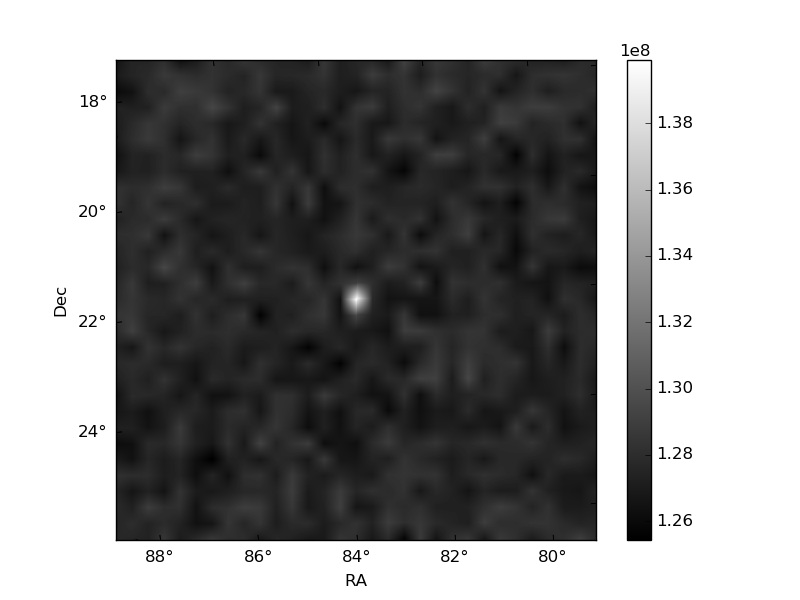
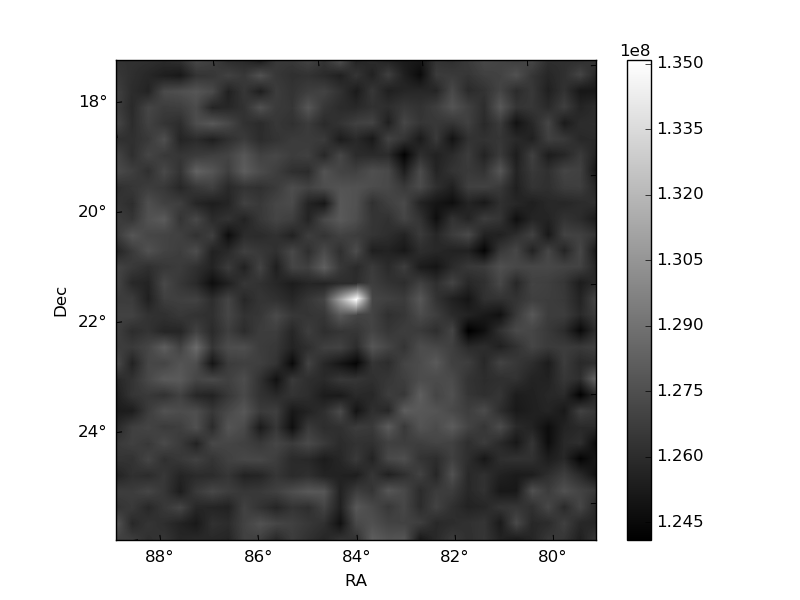
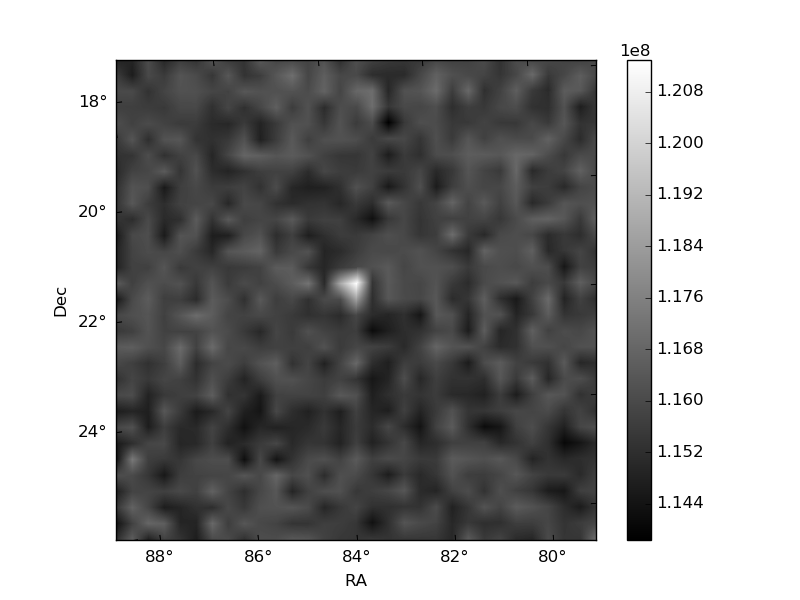
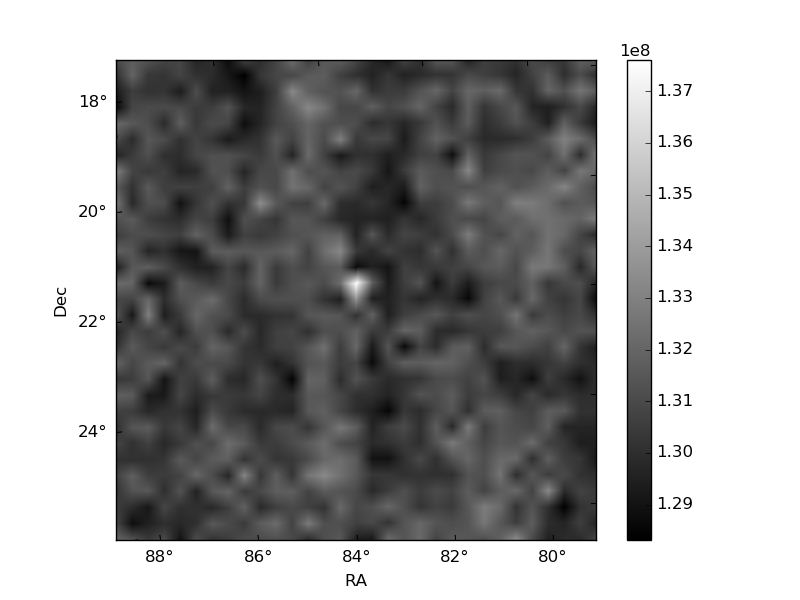
Histogram calculated using DETX and DETY for each event in the final _common_clean file
| Quadrant A | 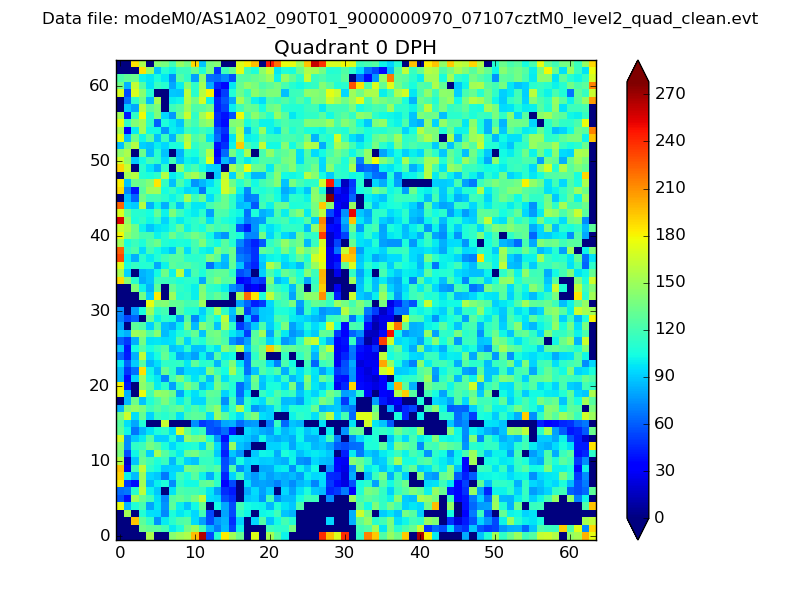 |
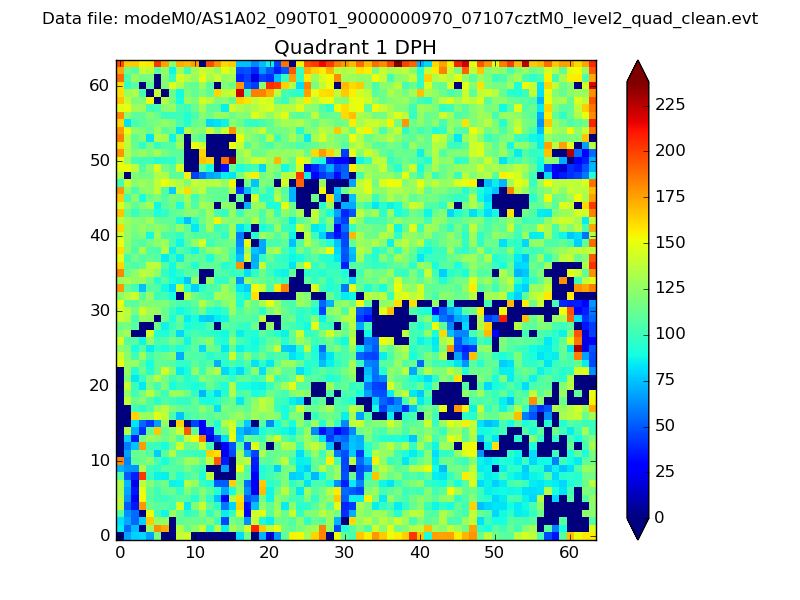 |
Quadrant B |
|---|---|---|---|
| Quadrant D | 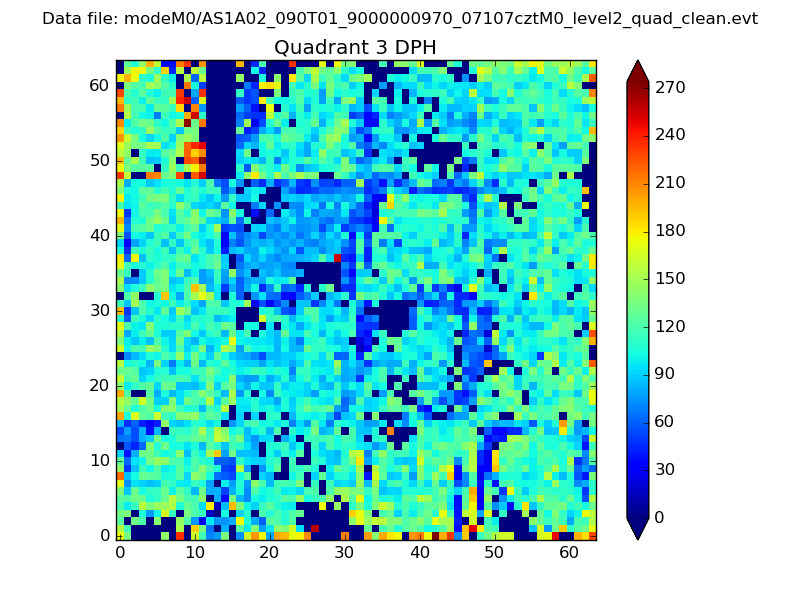 |
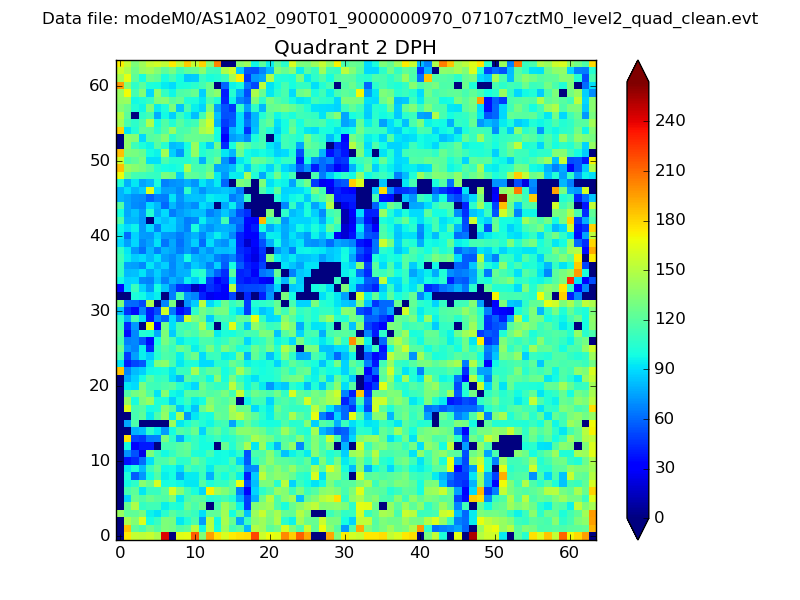 |
Quadrant C |
| Plot type | Count rate plots | Images |
|---|---|---|
| Comparison with Poisson distribution Blue bars denote a histogram of data divided into 1 sec bins. Red curve is a Poisson curve with rate = median count rate of data. |
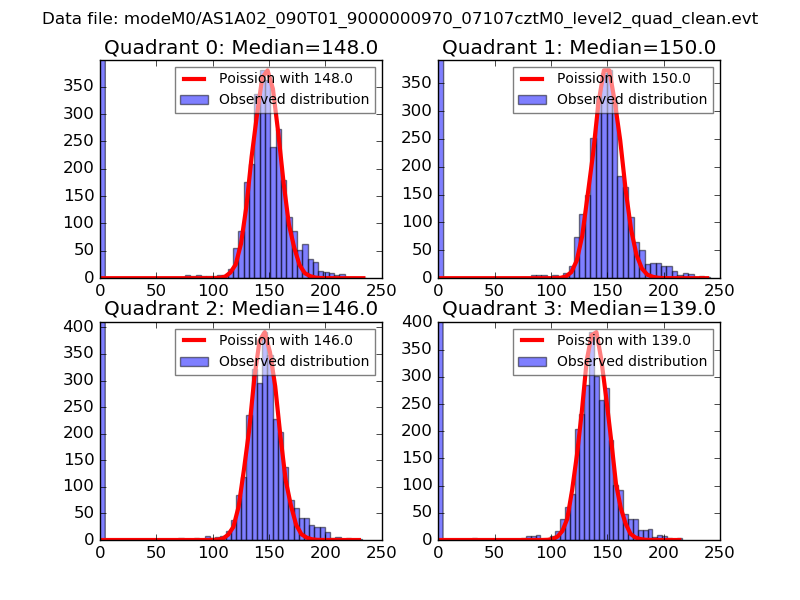 |
 |
| Quadrant-wise count rates Data is divided into 100 sec bins |
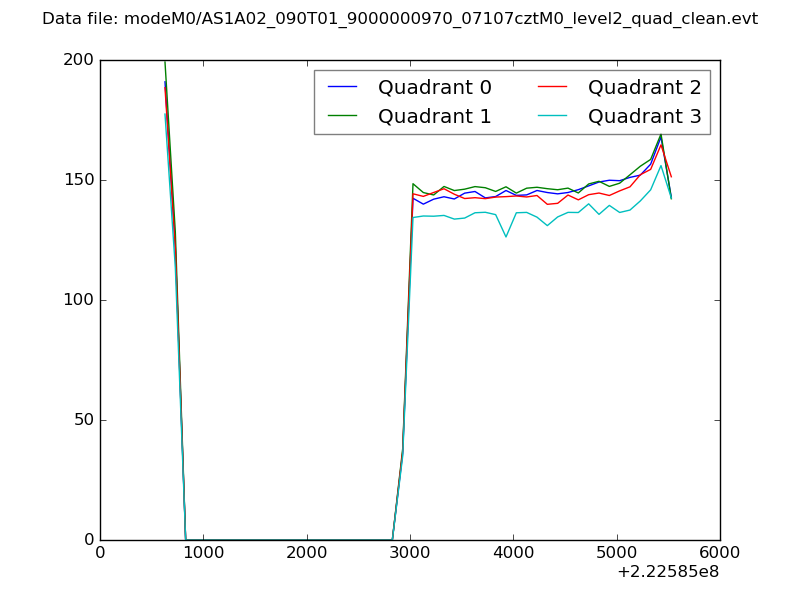 |
|
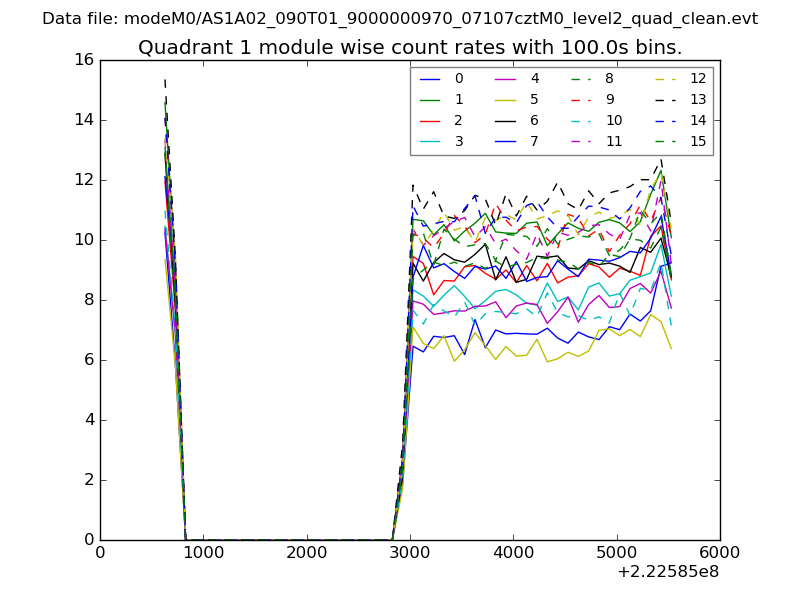
| Module-wise count rates for Quadrant A Data is divided into 100 sec bins |
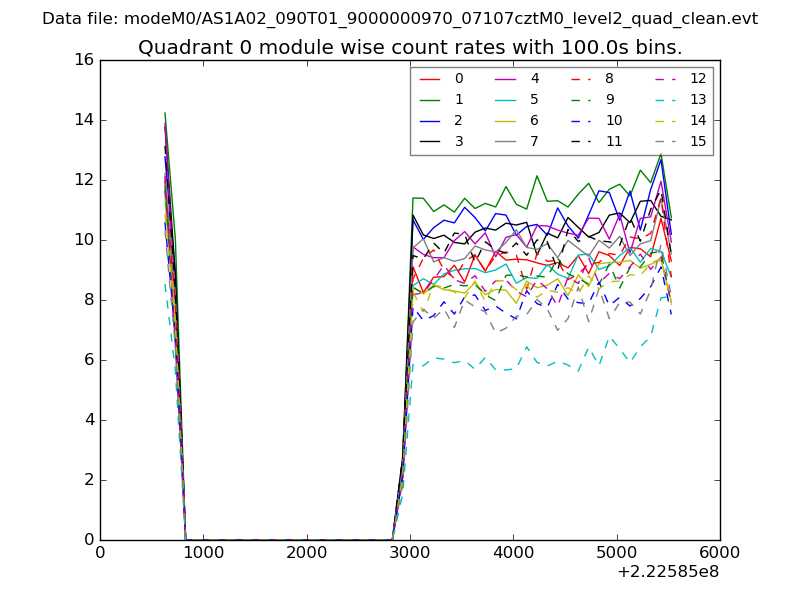 |
 |
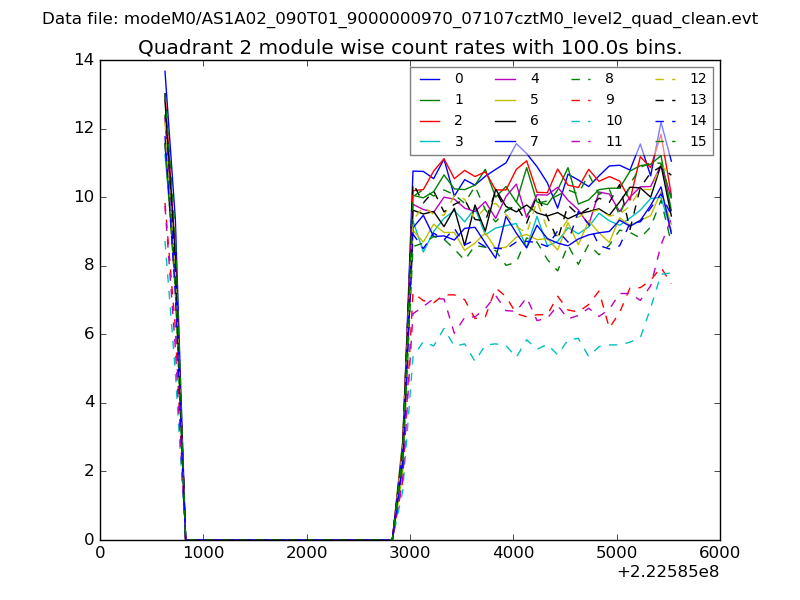
| Module-wise count rates for Quadrant B Data is divided into 100 sec bins |
 |
 |
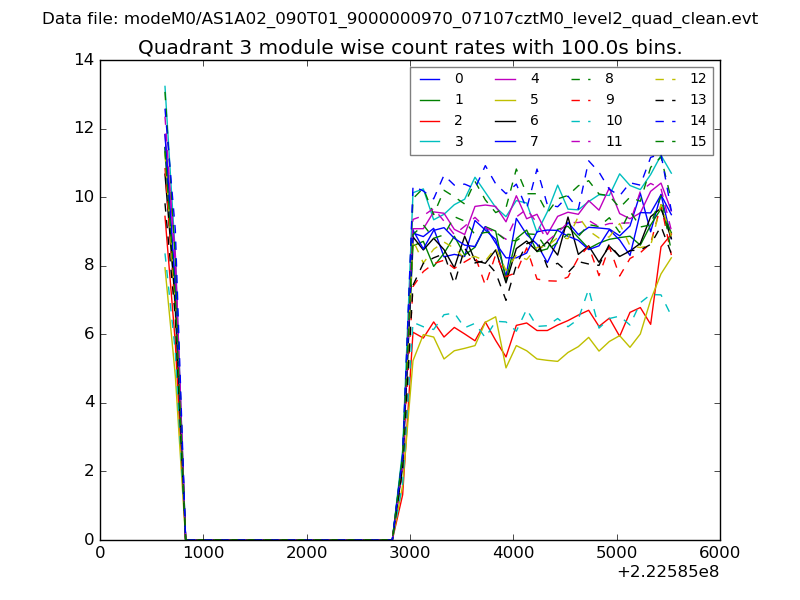
| Module-wise count rates for Quadrant C Data is divided into 100 sec bins |
 |
 |
| Module-wise count rates for Quadrant D Data is divided into 100 sec bins |
 |
 |
| Parameter | Plot |
|---|---|
| CZT HV Monitor | 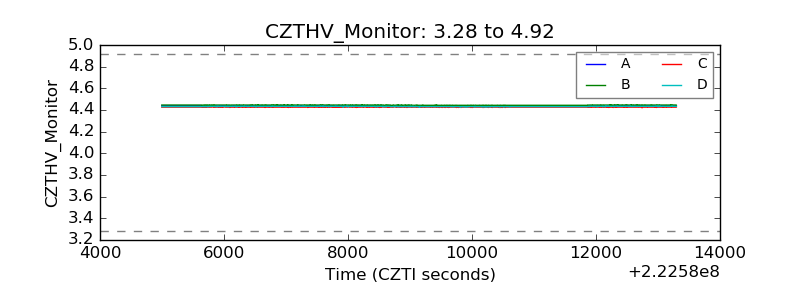 |
| D_VDD | 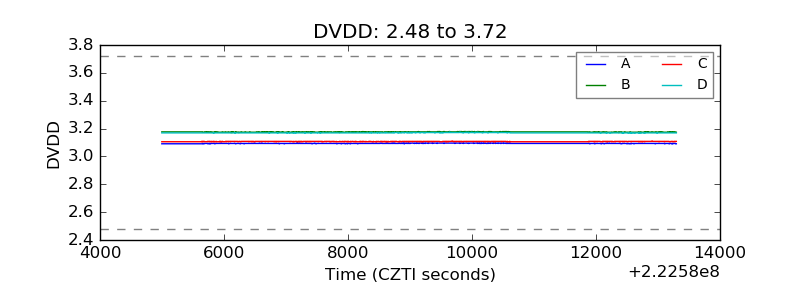 |
| Temperature 1 | 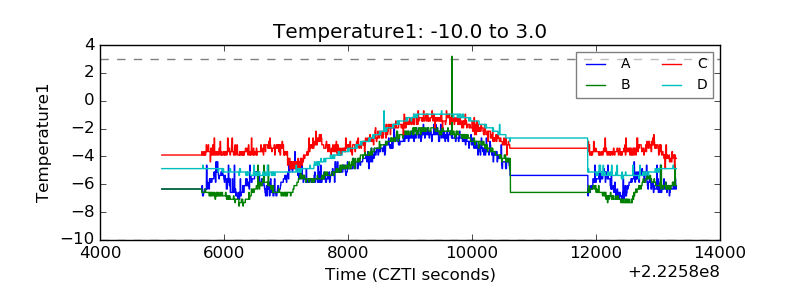 |
| Veto HV Monitor | 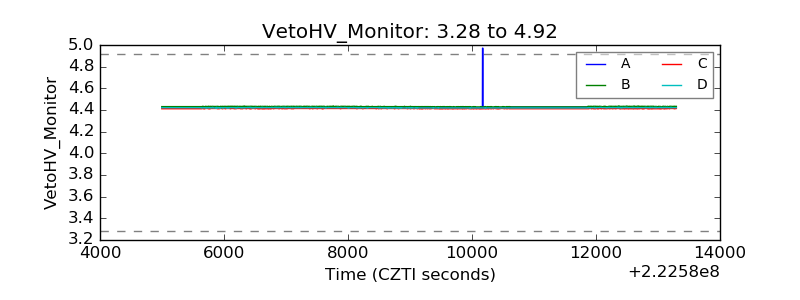 |
| Veto LLD | 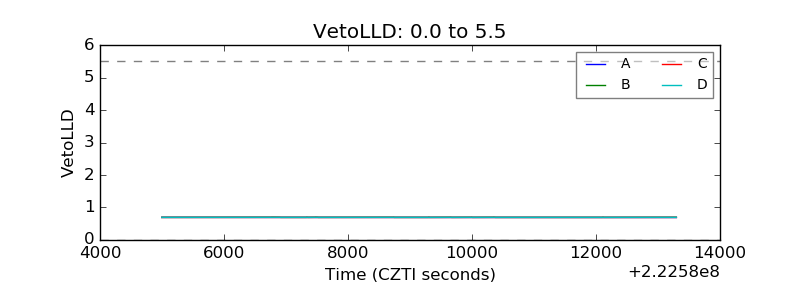 |
| Alpha Counter | 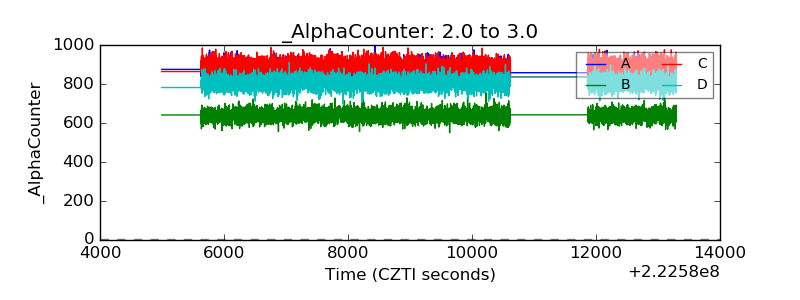 |
| _CPM_Rate | 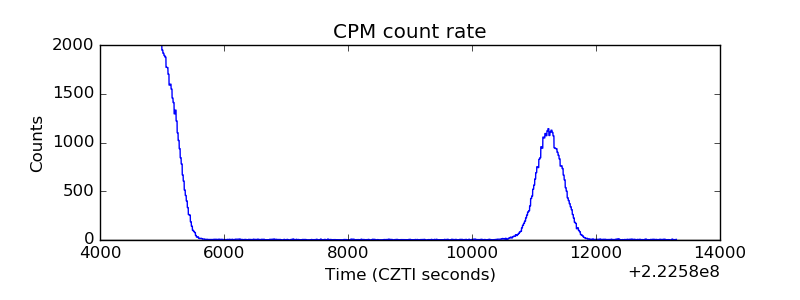 |
| CZT Counter | 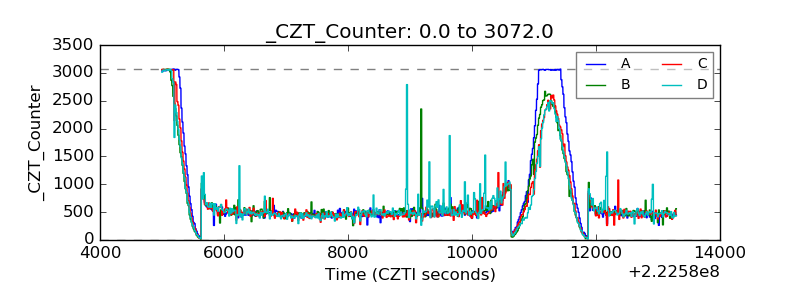 |
| +2.5 Volts monitor | 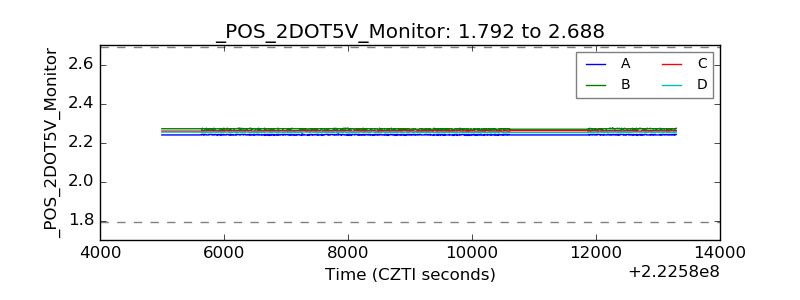 |
| +5 Volts monitor | 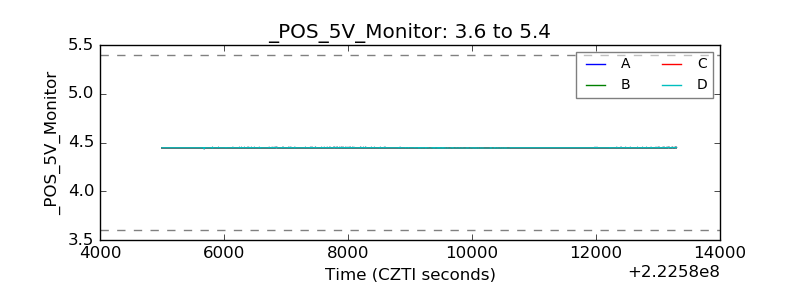 |
| _ROLL_ROT | 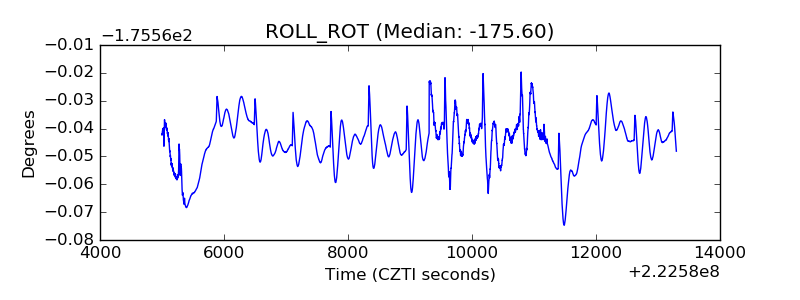 |
| _Roll_DEC | 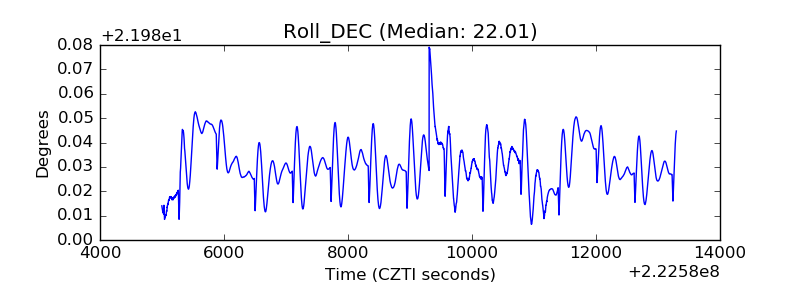 |
| _Roll_RA | 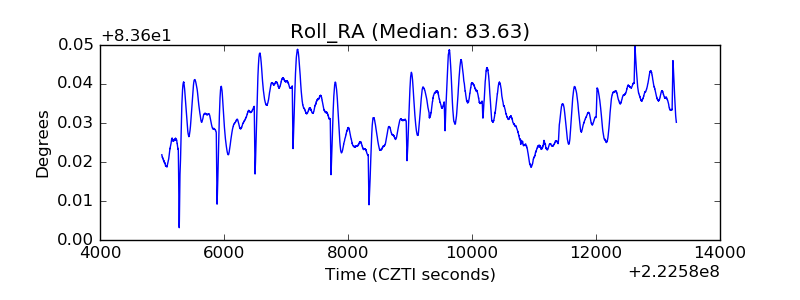 |
| Veto Counter | 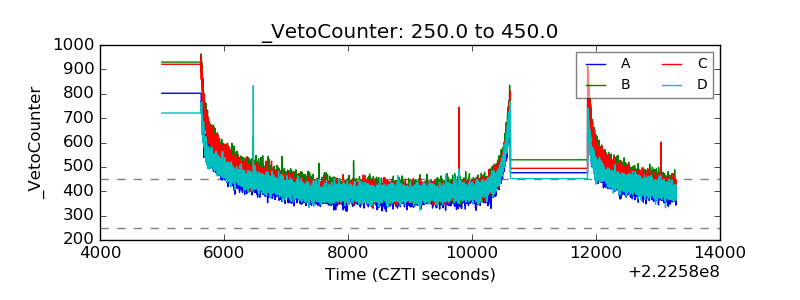 |