| Param | Original file | Final file |
|---|---|---|
| Filename | modeM0/AS1A02_090T01_9000000970_07108cztM0_level2.evt | modeM0/AS1A02_090T01_9000000970_07108cztM0_level2_quad_clean.evt |
| Size (bytes) | 193,878,720 | 29,557,440 |
| Size | 184.9 MB | 28.2 MB |
| Events in quadrant A | 1,352,795 | 179,615 |
| Events in quadrant B | 1,390,812 | 181,943 |
| Events in quadrant C | 1,342,187 | 178,549 |
| Events in quadrant D | 1,608,684 | 169,655 |
| Mode M0 | |||
|---|---|---|---|
| Quadrant | BADHDUFLAG | Total packets | Discarded packets |
| A | 0 | 5659 | 39 |
| B | 0 | 5724 | 57 |
| C | 0 | 5696 | 57 |
| D | 0 | 6537 | 44 |
| Mode M9 | |||
|---|---|---|---|
| Quadrant | BADHDUFLAG | Total packets | Discarded packets |
| A | 0 | 10 | 0 |
| B | 0 | 10 | 0 |
| C | 0 | 10 | 0 |
| D | 0 | 10 | 0 |
| Mode SS | |||
|---|---|---|---|
| Quadrant | BADHDUFLAG | Total packets | Discarded packets |
| A | 0 | 56 | 2 |
| B | 0 | 56 | 0 |
| C | 0 | 56 | 0 |
| D | 0 | 56 | 0 |
| Quadrant | Total seconds | Saturated seconds | Saturation percentage |
|---|---|---|---|
| A | 2574 | 125 | 4.856255% |
| B | 2565 | 131 | 5.107212% |
| C | 2565 | 86 | 3.352827% |
| D | 2572 | 101 | 3.926905% |
Noise dominated data is calculated using 1-second bins in cleaned event files. If a bin has >2000 counts, and if more than 50% of those come from <1% of pixels, then it is considered to be noise-dominated and hence unusable.
| Quadrant | # 1 sec bins | Bins with >0 counts | Bins with >2000 counts | High rate bins dominated by noise | Noise dominated (total time) | Noise dominated (detector-on time) | Marked lightcurve |
|---|---|---|---|---|---|---|---|
| A | 3683 | 2591 | 4 | 4 | 0.11% | 0.15% | 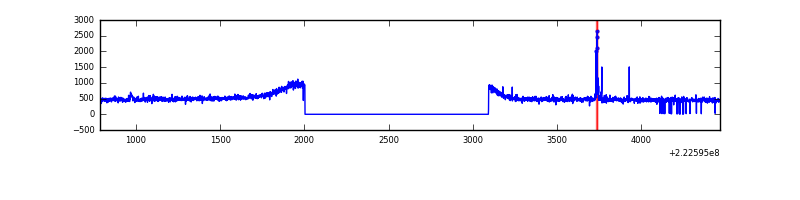 |
| B | 3682 | 2588 | 0 | 0 | 0.00% | 0.00% | 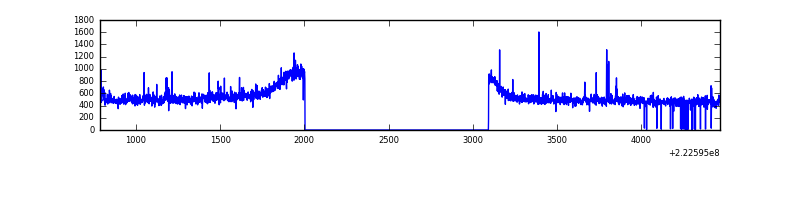 |
| C | 3683 | 2590 | 0 | 0 | 0.00% | 0.00% | 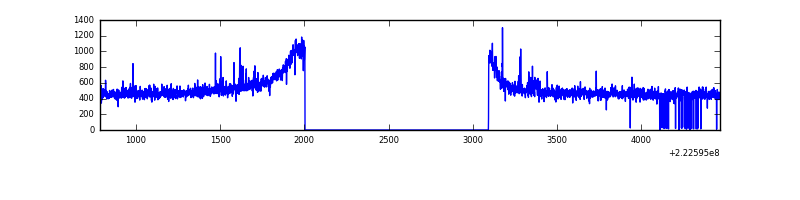 |
| D | 3683 | 2592 | 13 | 13 | 0.35% | 0.50% | 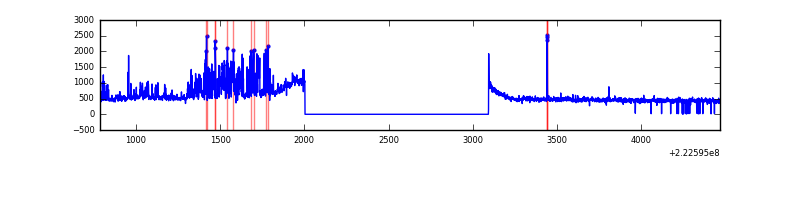 |
Top three noisy pixels from each quadrant. If the there are fewer than three noisy pixels in the level2.evt file, extra rows are filled as -1
| Pixel properties | Quadrant properties | ||||||
|---|---|---|---|---|---|---|---|
| Quadrant | DetID | PixID | Counts | Sigma | Mean | Median | Sigma |
| A | 13 | 248 | 17052 | 229.81 | 345 | 336 | 72.7 |
| A | 14 | 111 | 3612 | 45.04 | 345 | 336 | 72.7 |
| A | 8 | 15 | 3262 | 40.23 | 345 | 336 | 72.7 |
| B | 0 | 219 | 11140 | 155.27 | 350 | 342 | 69.5 |
| B | 4 | 173 | 8198 | 112.97 | 350 | 342 | 69.5 |
| B | 12 | 111 | 6936 | 94.82 | 350 | 342 | 69.5 |
| C | 7 | 247 | 18735 | 228.63 | 337 | 339 | 80.5 |
| C | 10 | 22 | 2875 | 31.52 | 337 | 339 | 80.5 |
| C | 13 | 61 | 2582 | 27.88 | 337 | 339 | 80.5 |
| D | 12 | 212 | 107141 | 1272.1 | 334 | 324 | 84.0 |
| D | 12 | 227 | 93004 | 1103.74 | 334 | 324 | 84.0 |
| D | 8 | 195 | 84330 | 1000.44 | 334 | 324 | 84.0 |
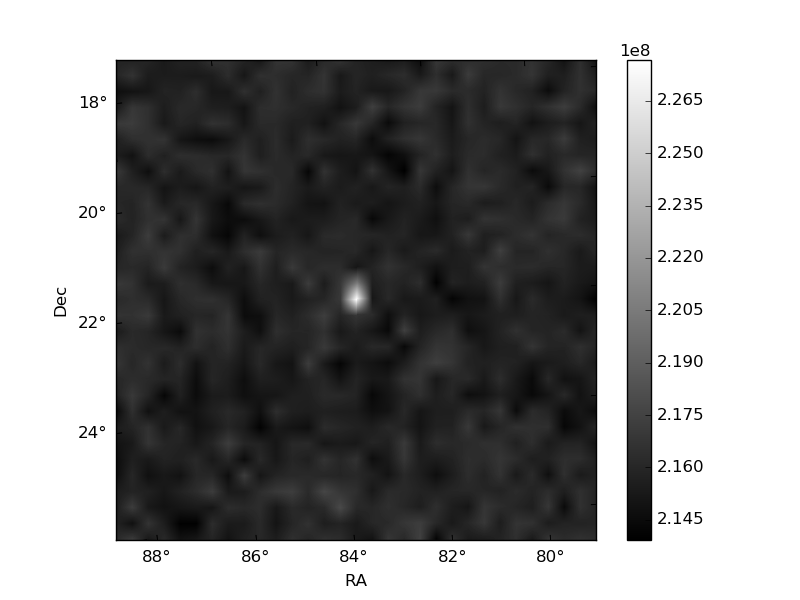
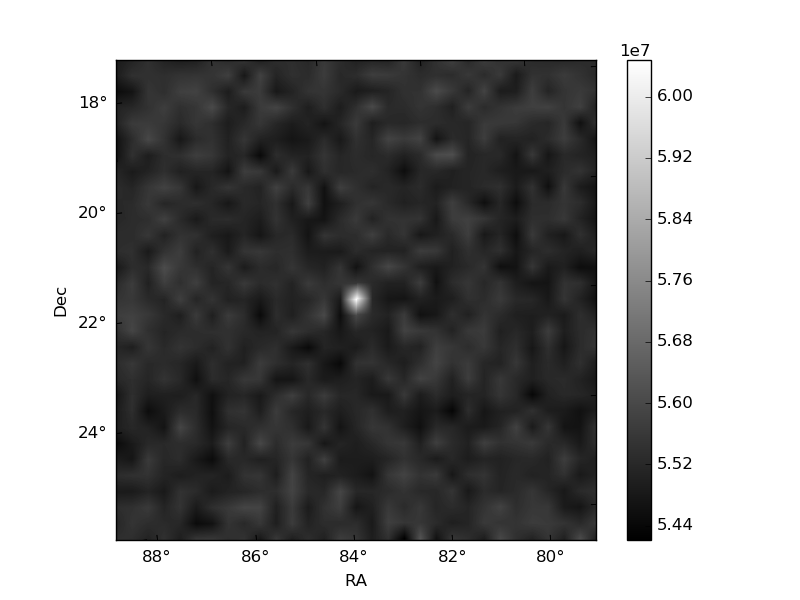
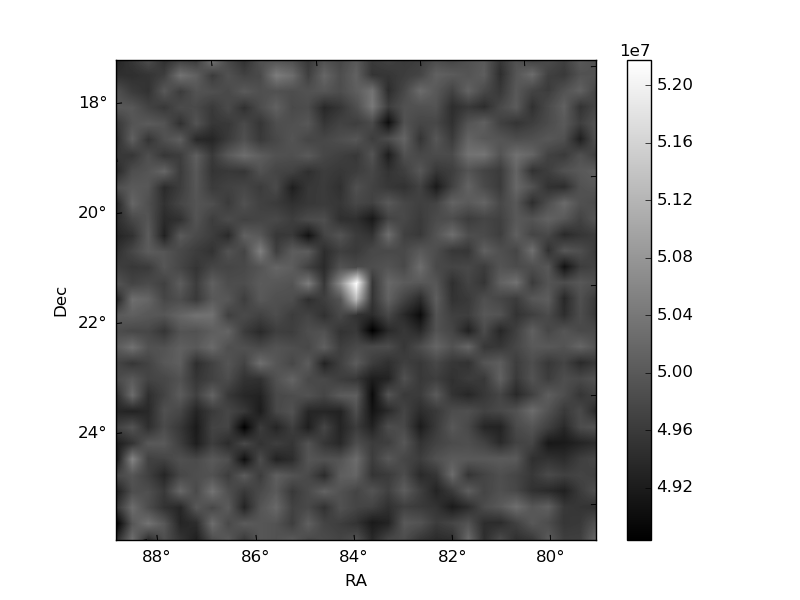
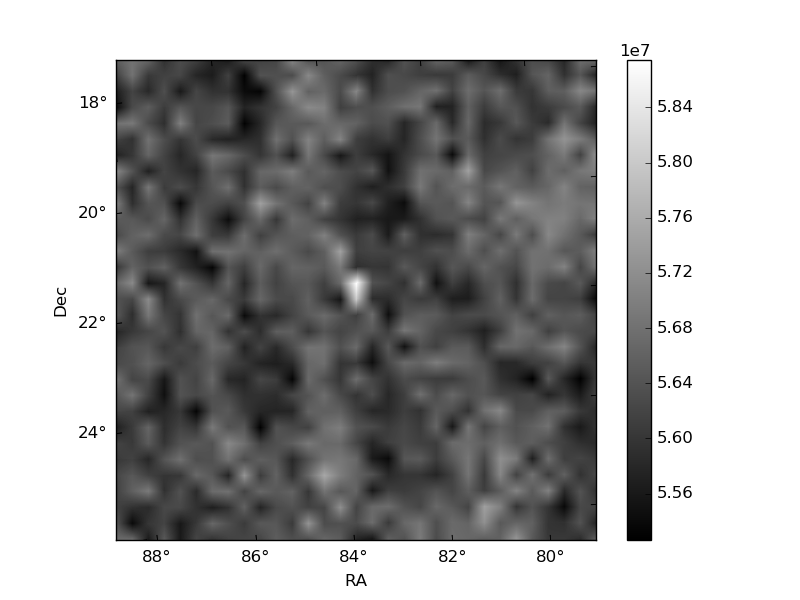
Histogram calculated using DETX and DETY for each event in the final _common_clean file
| Quadrant A | 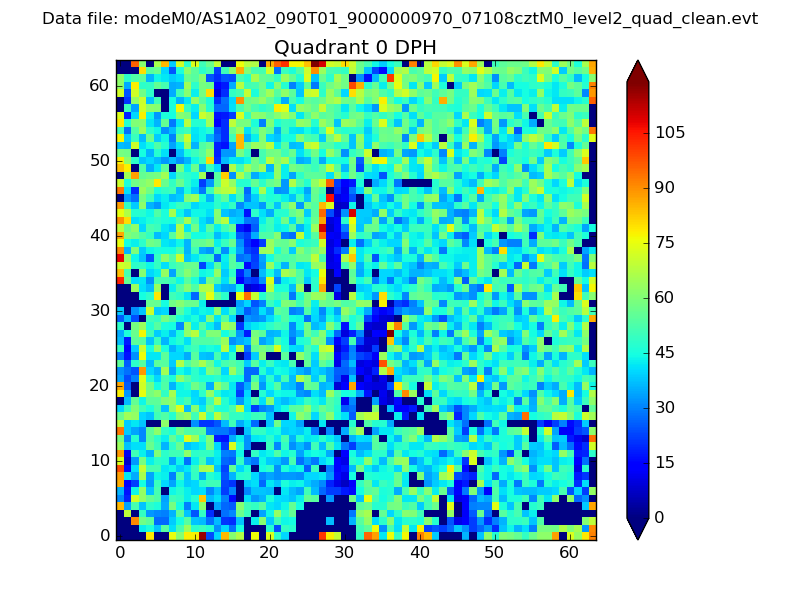 |
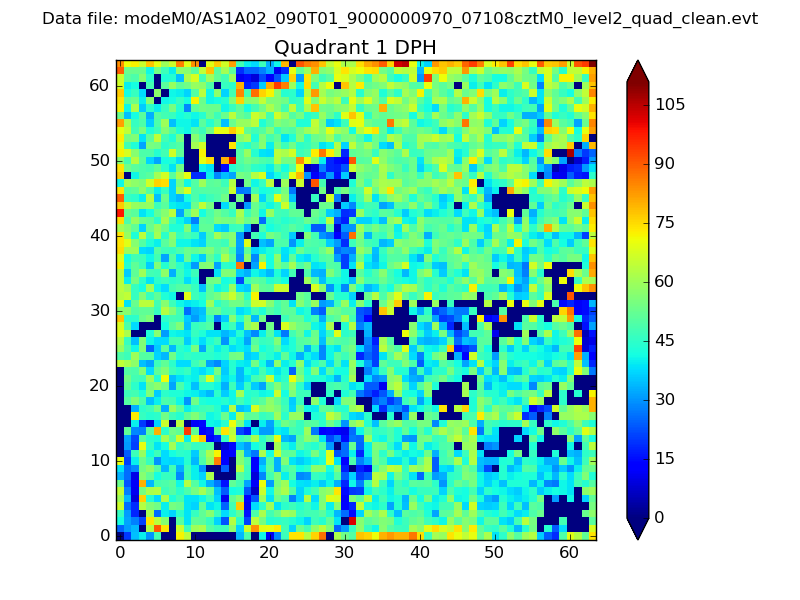 |
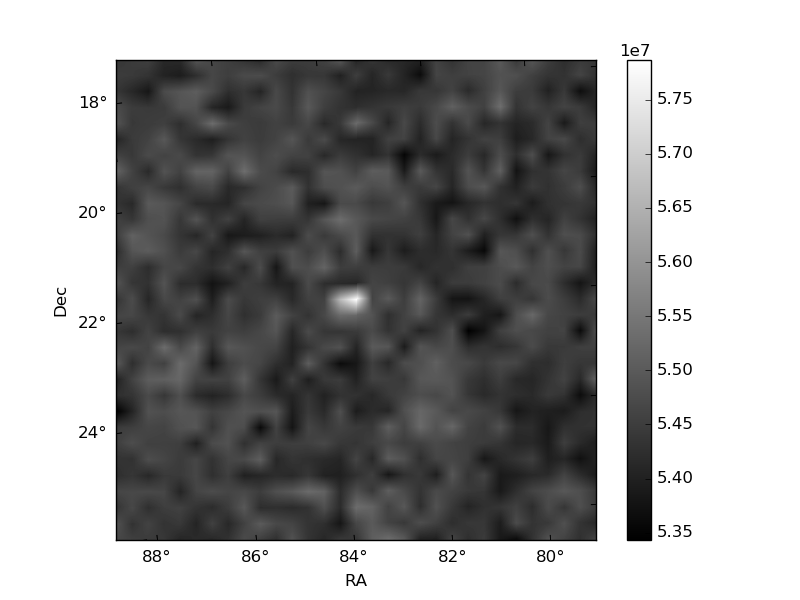
Quadrant B |
|---|---|---|---|
| Quadrant D | 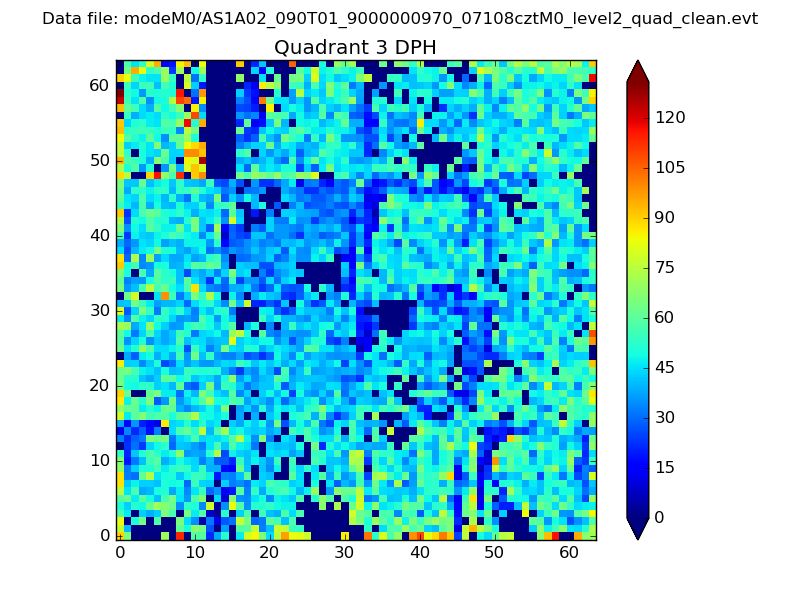 |
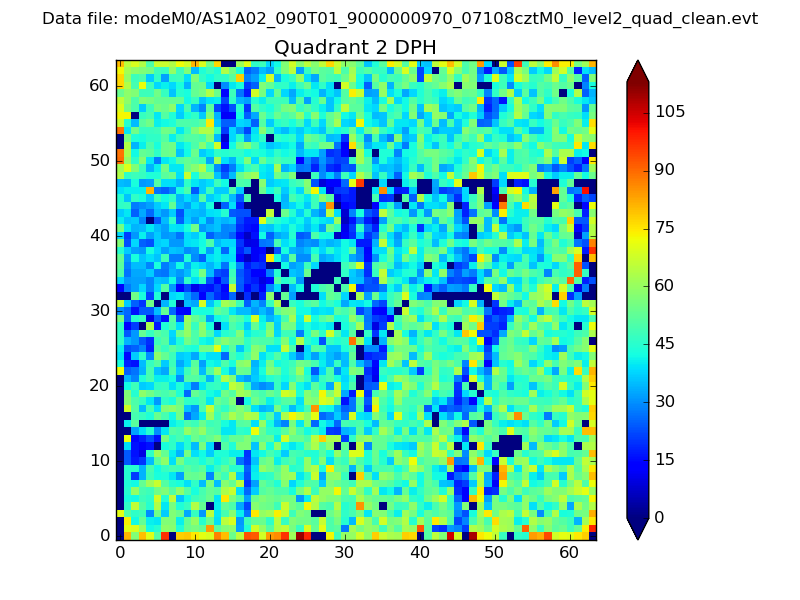 |
Quadrant C |
| Plot type | Count rate plots | Images |
|---|---|---|
| Comparison with Poisson distribution Blue bars denote a histogram of data divided into 1 sec bins. Red curve is a Poisson curve with rate = median count rate of data. |
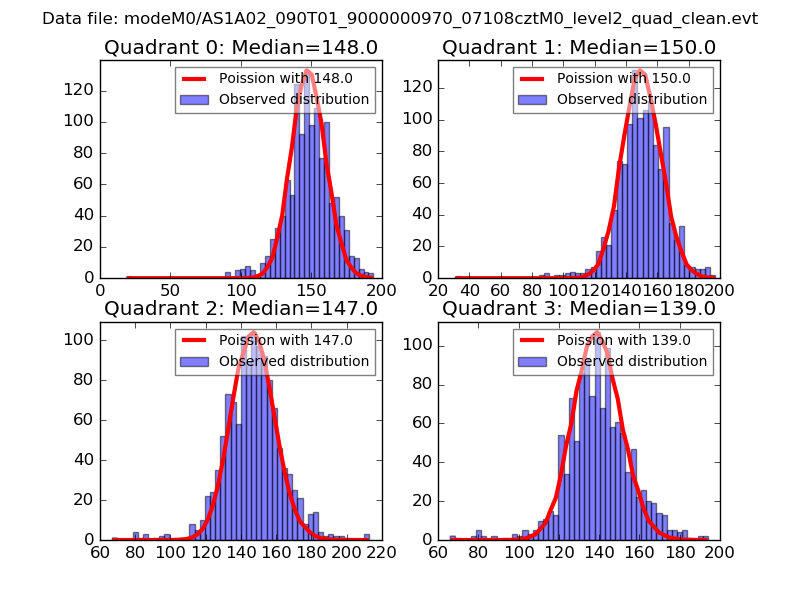 |
 |
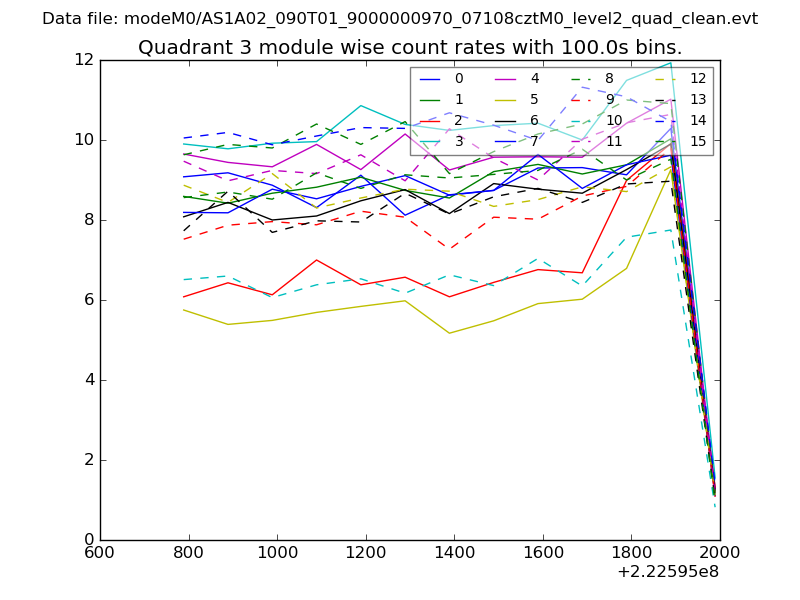
| Quadrant-wise count rates Data is divided into 100 sec bins |
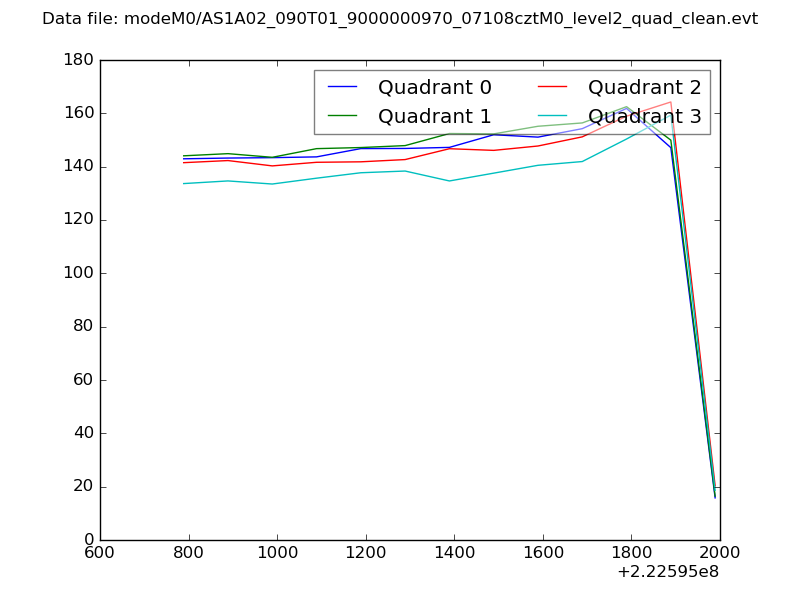 |
|
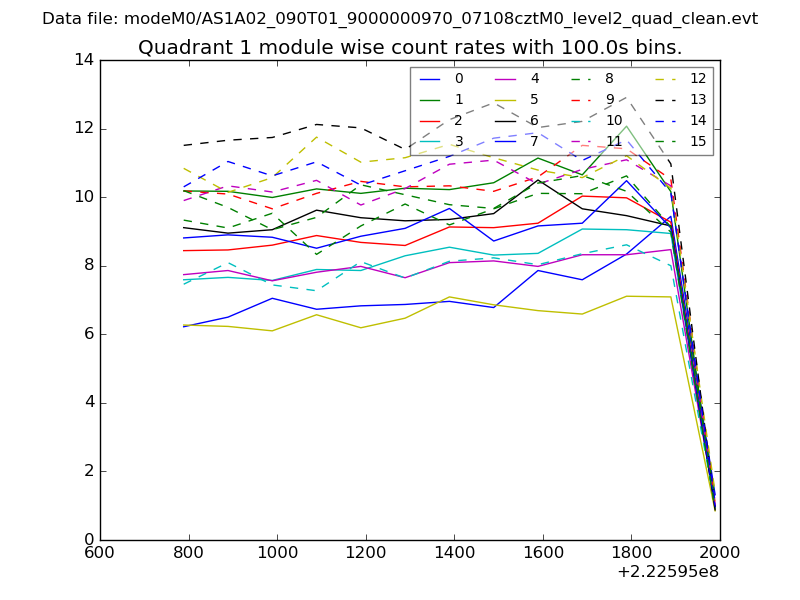
| Module-wise count rates for Quadrant A Data is divided into 100 sec bins |
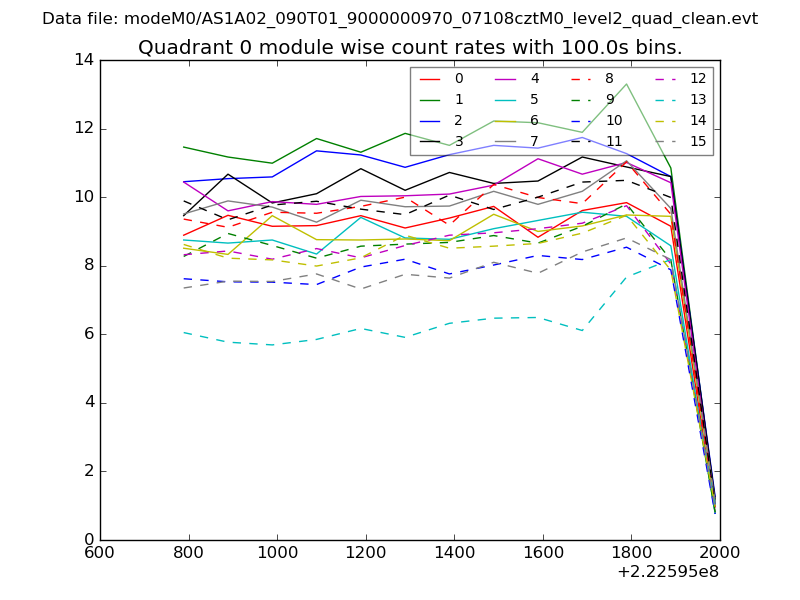 |
 |
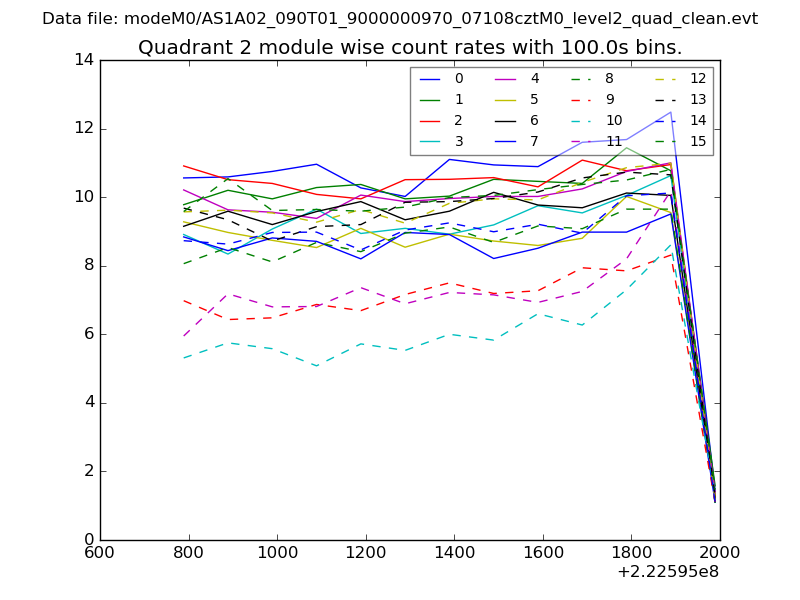
| Module-wise count rates for Quadrant B Data is divided into 100 sec bins |
 |
 |
| Module-wise count rates for Quadrant C Data is divided into 100 sec bins |
 |
 |
| Module-wise count rates for Quadrant D Data is divided into 100 sec bins |
 |
 |
| Parameter | Plot |
|---|---|
| CZT HV Monitor | 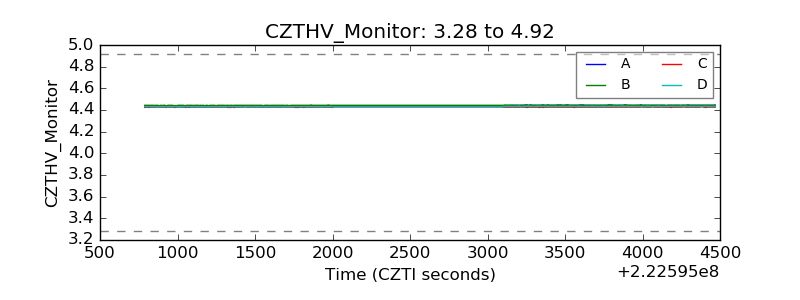 |
| D_VDD | 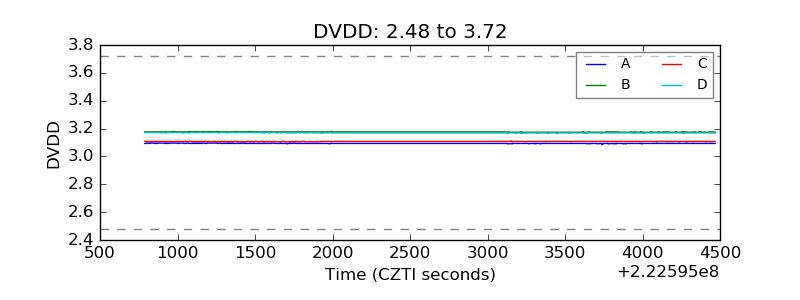 |
| Temperature 1 | 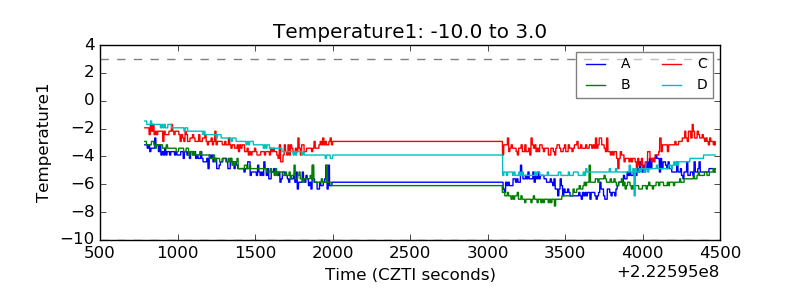 |
| Veto HV Monitor | 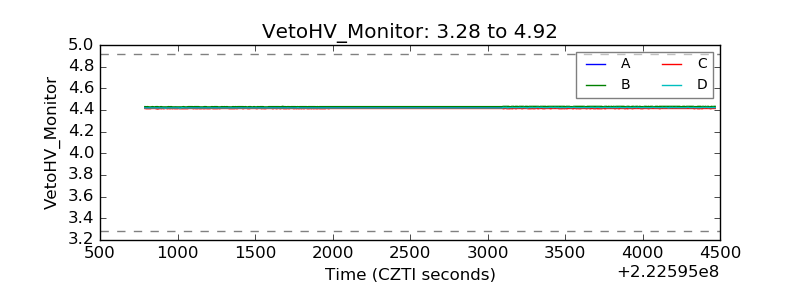 |
| Veto LLD | 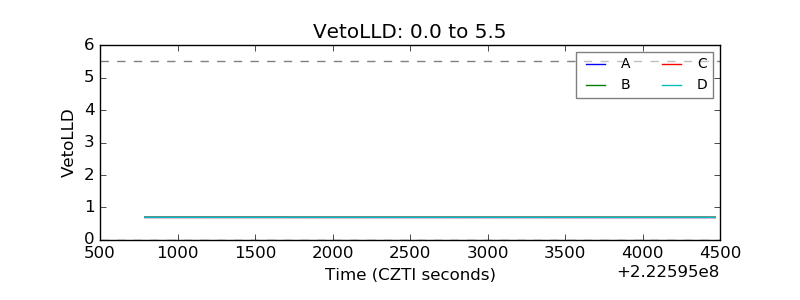 |
| Alpha Counter | 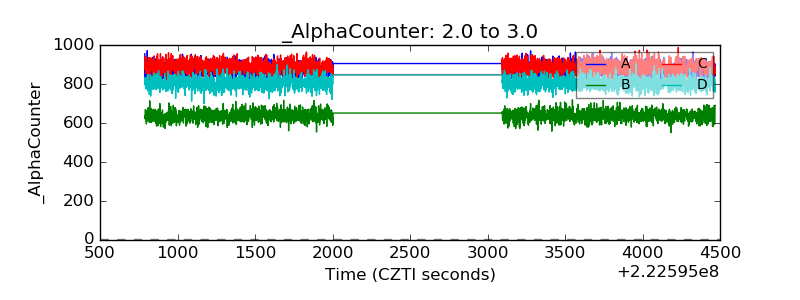 |
| _CPM_Rate | 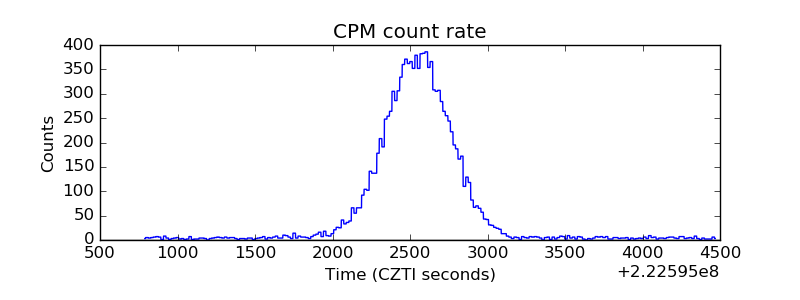 |
| CZT Counter | 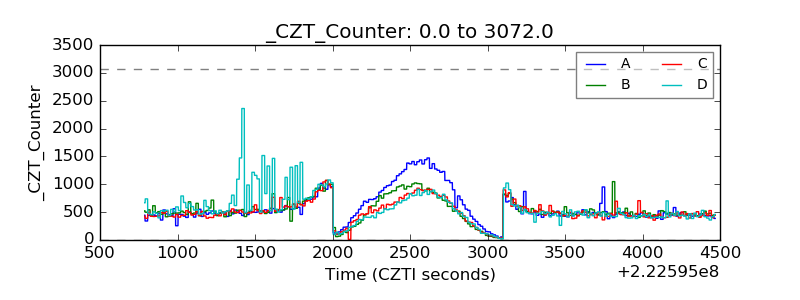 |
| +2.5 Volts monitor | 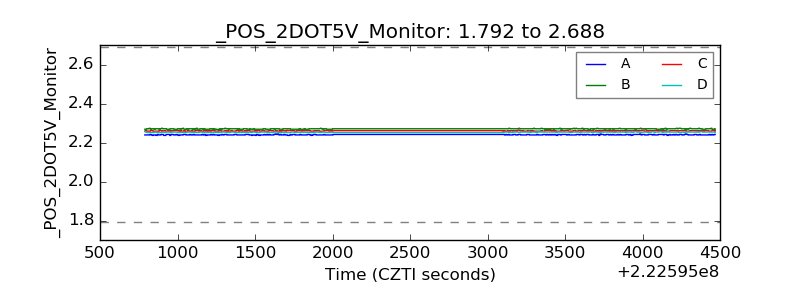 |
| +5 Volts monitor |  |
| _ROLL_ROT | 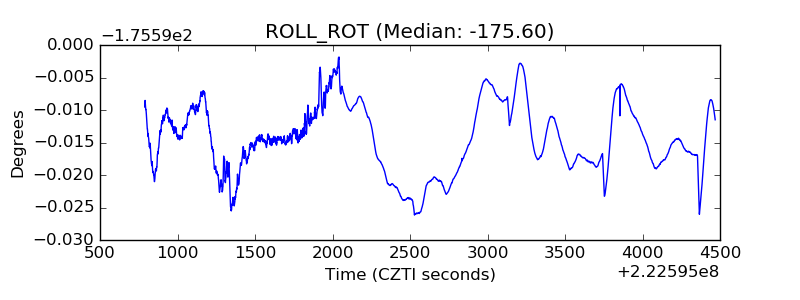 |
| _Roll_DEC | 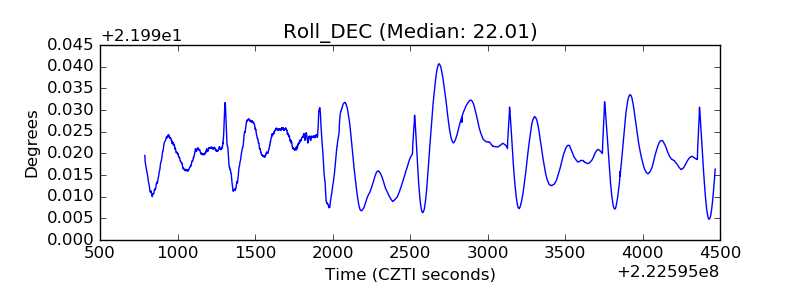 |
| _Roll_RA | 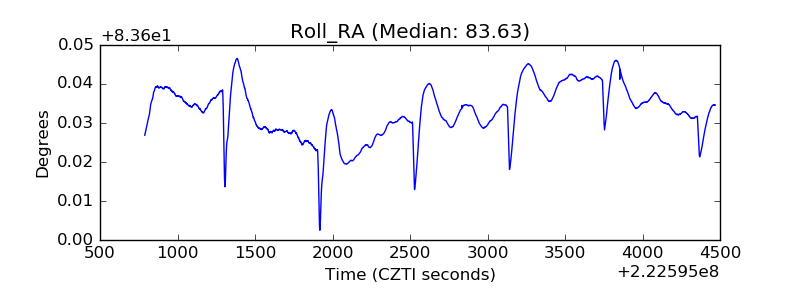 |
| Veto Counter | 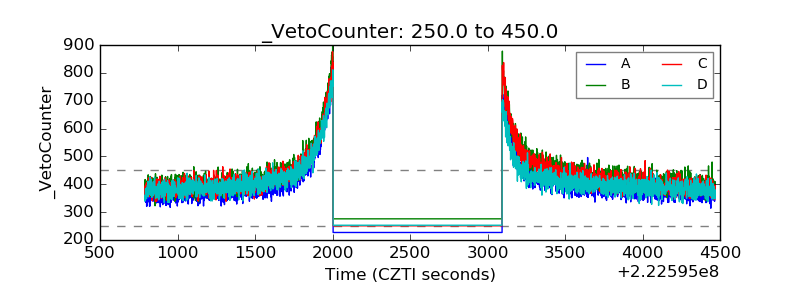 |