| Param | Original file | Final file |
|---|---|---|
| Filename | modeM0/AS1A02_090T01_9000000970_07109cztM0_level2.evt | modeM0/AS1A02_090T01_9000000970_07109cztM0_level2_quad_clean.evt |
| Size (bytes) | 798,004,800 | 157,587,840 |
| Size | 761.0 MB | 150.3 MB |
| Events in quadrant A | 5,612,314 | 1,004,965 |
| Events in quadrant B | 5,943,421 | 1,017,582 |
| Events in quadrant C | 5,538,754 | 1,000,007 |
| Events in quadrant D | 6,285,863 | 946,354 |
| Mode M0 | |||
|---|---|---|---|
| Quadrant | BADHDUFLAG | Total packets | Discarded packets |
| A | 0 | 24054 | 3 |
| B | 0 | 24671 | 2 |
| C | 0 | 24114 | 2 |
| D | 0 | 26131 | 2 |
| Mode M9 | |||
|---|---|---|---|
| Quadrant | BADHDUFLAG | Total packets | Discarded packets |
| A | 0 | 18 | 0 |
| B | 0 | 18 | 0 |
| C | 0 | 18 | 0 |
| D | 0 | 18 | 0 |
| Mode SS | |||
|---|---|---|---|
| Quadrant | BADHDUFLAG | Total packets | Discarded packets |
| A | 0 | 240 | 0 |
| B | 0 | 240 | 0 |
| C | 0 | 240 | 0 |
| D | 0 | 240 | 0 |
| Quadrant | Total seconds | Saturated seconds | Saturation percentage |
|---|---|---|---|
| A | 11611 | 241 | 2.075618% |
| B | 11611 | 248 | 2.135906% |
| C | 11611 | 168 | 1.446904% |
| D | 11611 | 213 | 1.834467% |
Noise dominated data is calculated using 1-second bins in cleaned event files. If a bin has >2000 counts, and if more than 50% of those come from <1% of pixels, then it is considered to be noise-dominated and hence unusable.
| Quadrant | # 1 sec bins | Bins with >0 counts | Bins with >2000 counts | High rate bins dominated by noise | Noise dominated (total time) | Noise dominated (detector-on time) | Marked lightcurve |
|---|---|---|---|---|---|---|---|
| A | 13516 | 11611 | 6 | 6 | 0.04% | 0.05% | 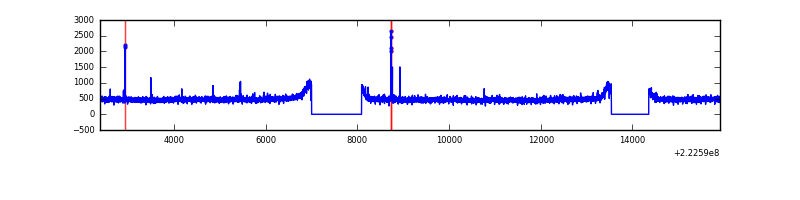 |
| B | 13516 | 11611 | 4 | 4 | 0.03% | 0.03% | 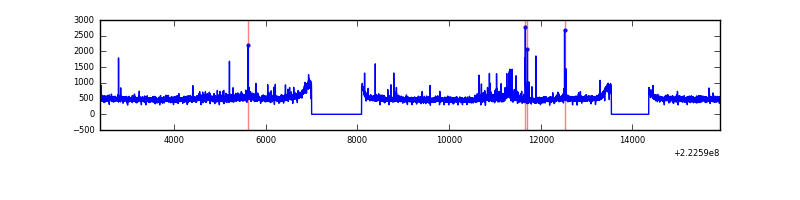 |
| C | 13516 | 11611 | 1 | 1 | 0.01% | 0.01% | 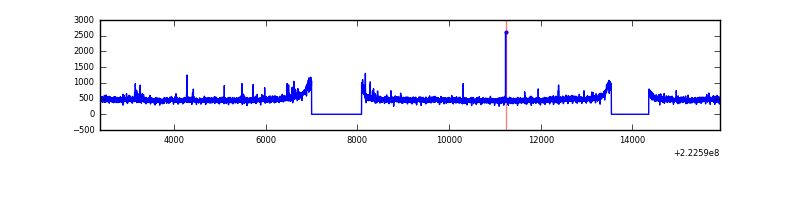 |
| D | 13516 | 11611 | 48 | 48 | 0.36% | 0.41% | 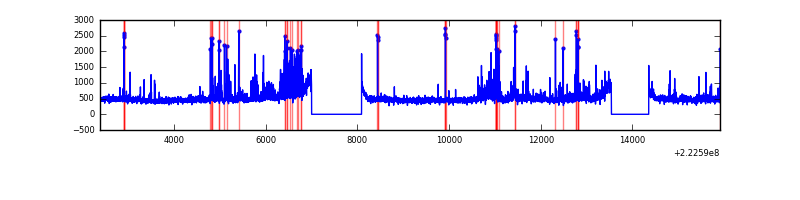 |
Top three noisy pixels from each quadrant. If the there are fewer than three noisy pixels in the level2.evt file, extra rows are filled as -1
| Pixel properties | Quadrant properties | ||||||
|---|---|---|---|---|---|---|---|
| Quadrant | DetID | PixID | Counts | Sigma | Mean | Median | Sigma |
| A | 14 | 111 | 23974 | 76.42 | 1444 | 1412 | 295.2 |
| A | 13 | 248 | 18454 | 57.72 | 1444 | 1412 | 295.2 |
| A | 8 | 15 | 17571 | 54.73 | 1444 | 1412 | 295.2 |
| B | 0 | 214 | 119236 | 426.09 | 1457 | 1427 | 276.5 |
| B | 0 | 219 | 107116 | 382.26 | 1457 | 1427 | 276.5 |
| B | 12 | 111 | 27705 | 95.04 | 1457 | 1427 | 276.5 |
| C | 4 | 254 | 30761 | 90.6 | 1400 | 1414 | 323.9 |
| C | 7 | 247 | 23383 | 67.82 | 1400 | 1414 | 323.9 |
| C | 9 | 68 | 22140 | 63.98 | 1400 | 1414 | 323.9 |
| D | 8 | 195 | 315461 | 923.35 | 1396 | 1358 | 340.2 |
| D | 2 | 216 | 272458 | 796.93 | 1396 | 1358 | 340.2 |
| D | 12 | 212 | 127255 | 370.09 | 1396 | 1358 | 340.2 |
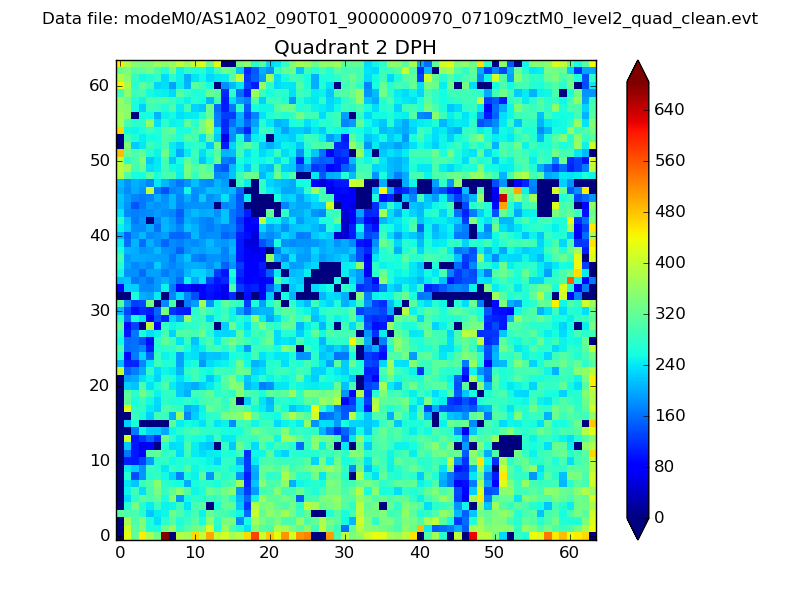
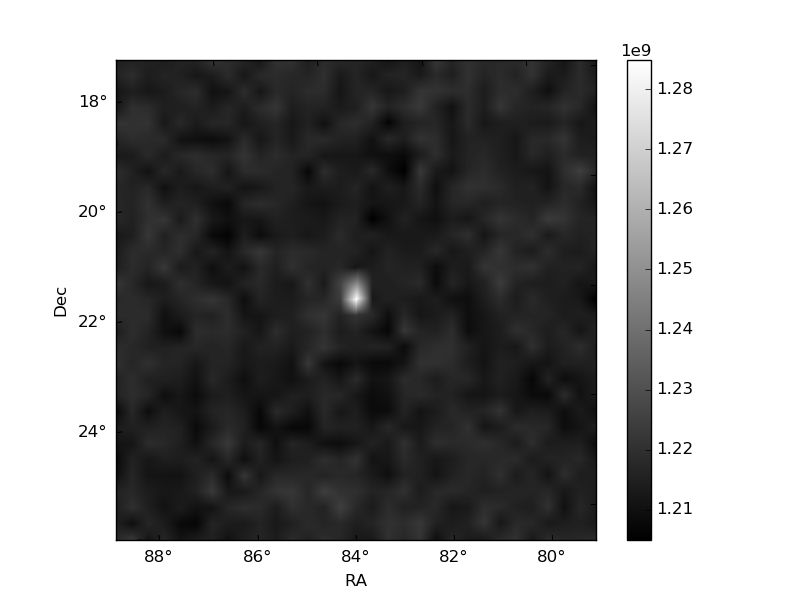
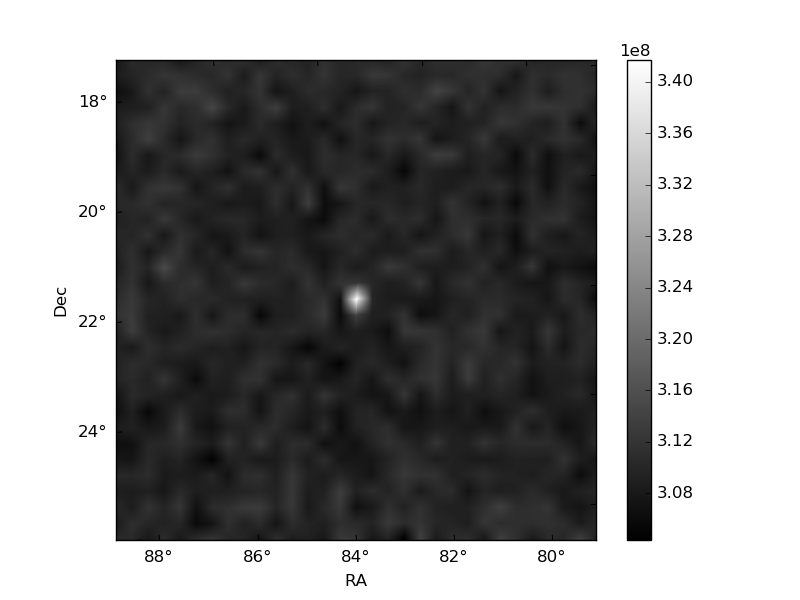
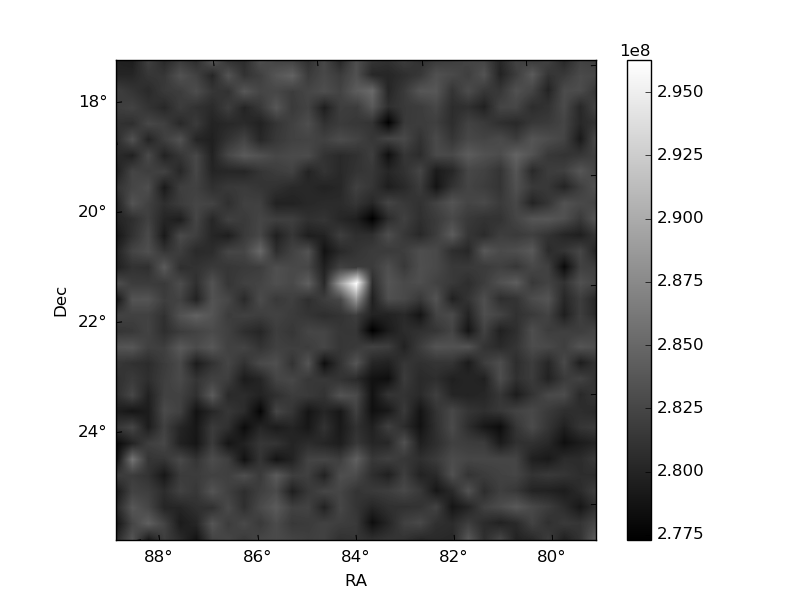
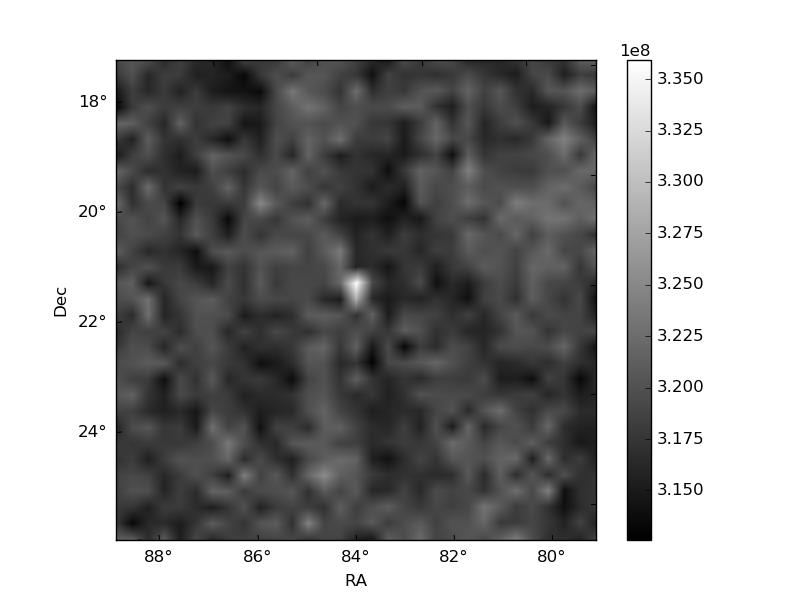
Histogram calculated using DETX and DETY for each event in the final _common_clean file
| Quadrant A | 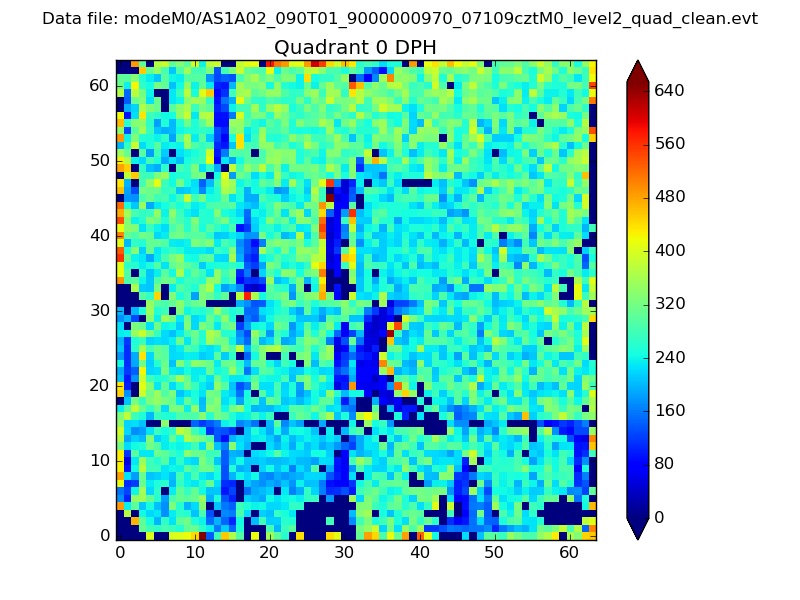 |
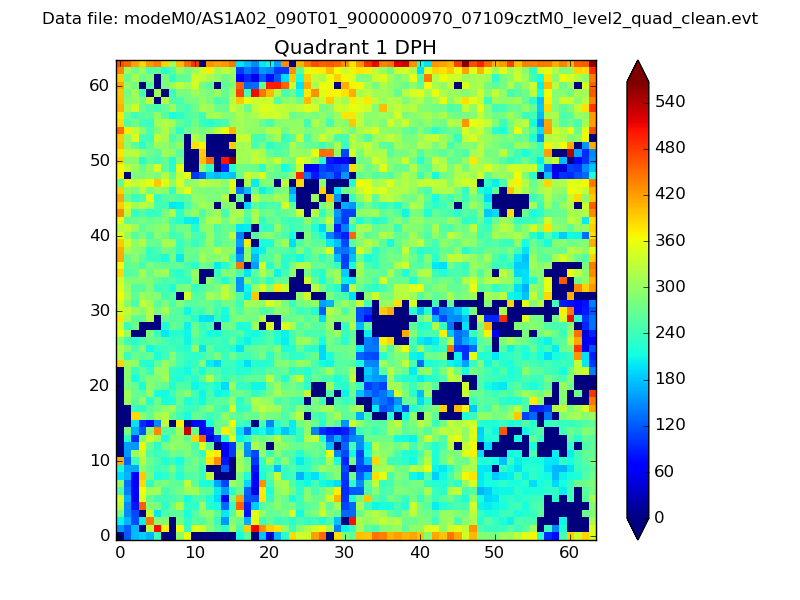 |
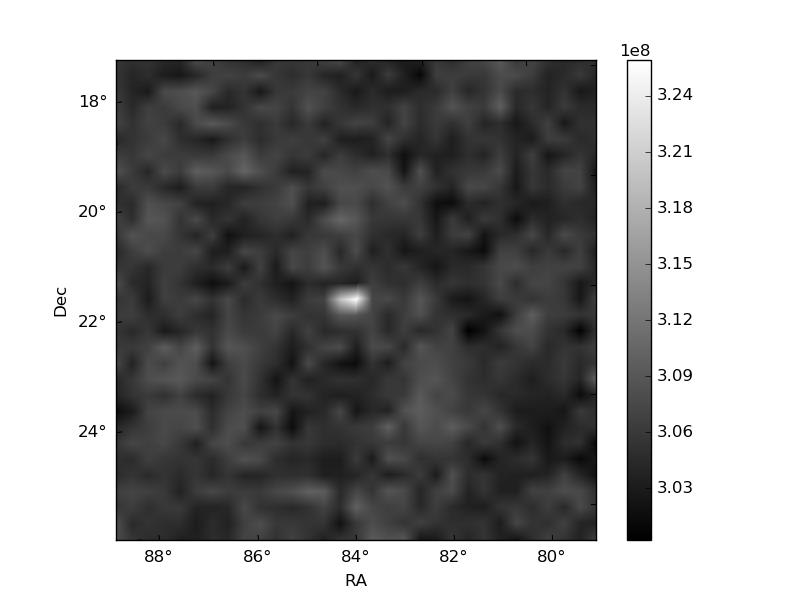
Quadrant B |
|---|---|---|---|
| Quadrant D | 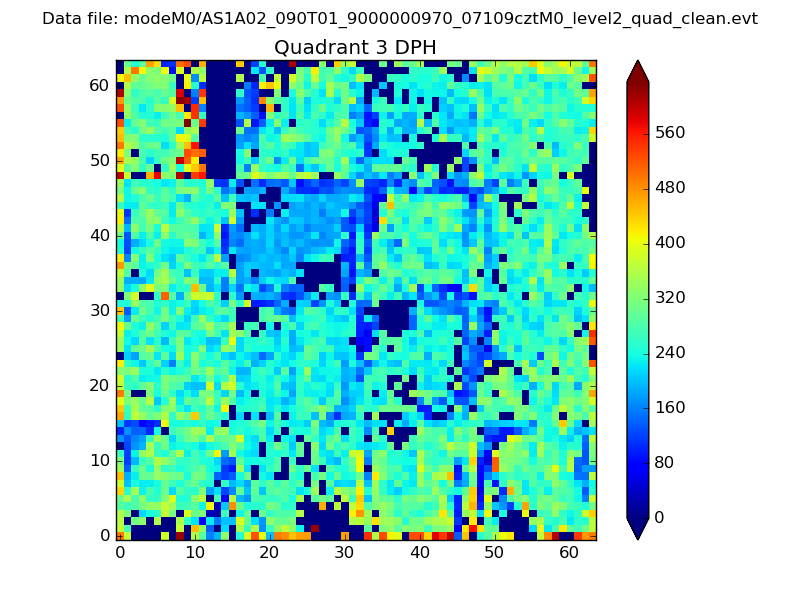 |
 |
Quadrant C |
| Plot type | Count rate plots | Images |
|---|---|---|
| Comparison with Poisson distribution Blue bars denote a histogram of data divided into 1 sec bins. Red curve is a Poisson curve with rate = median count rate of data. |
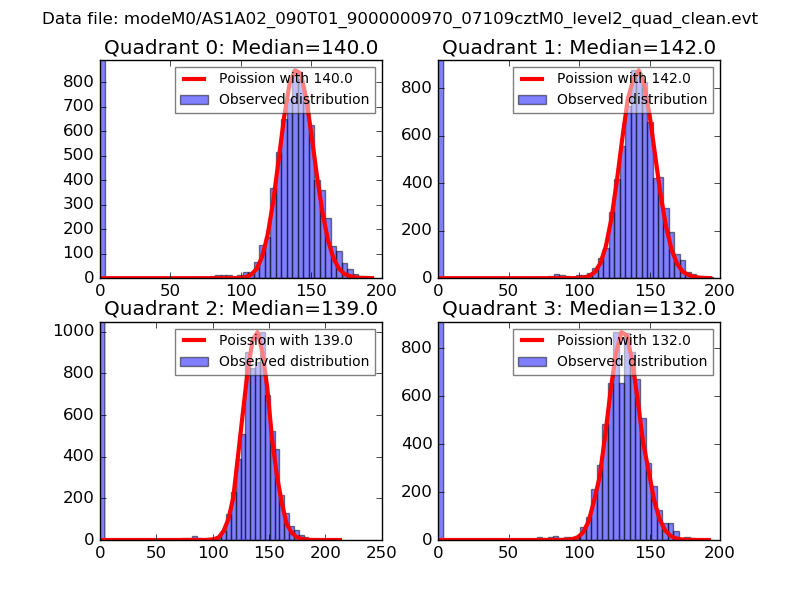 |
 |
| Quadrant-wise count rates Data is divided into 100 sec bins |
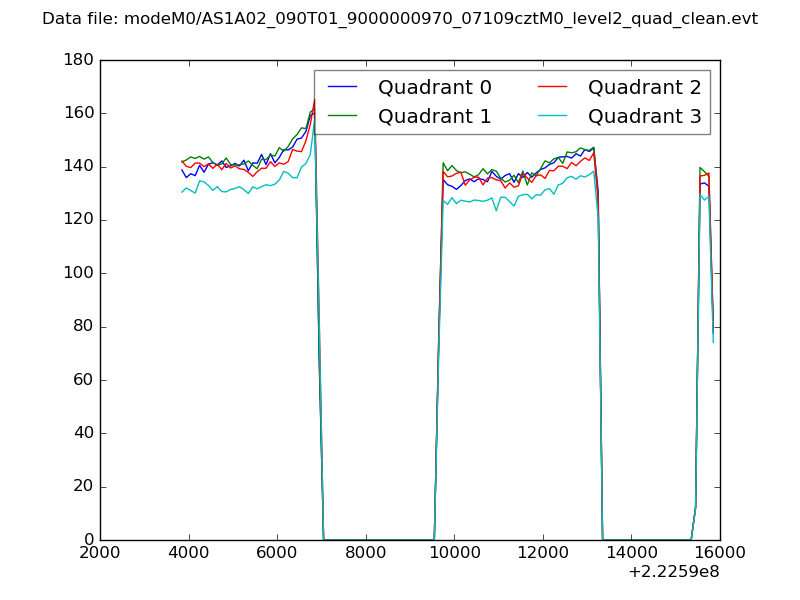 |
|
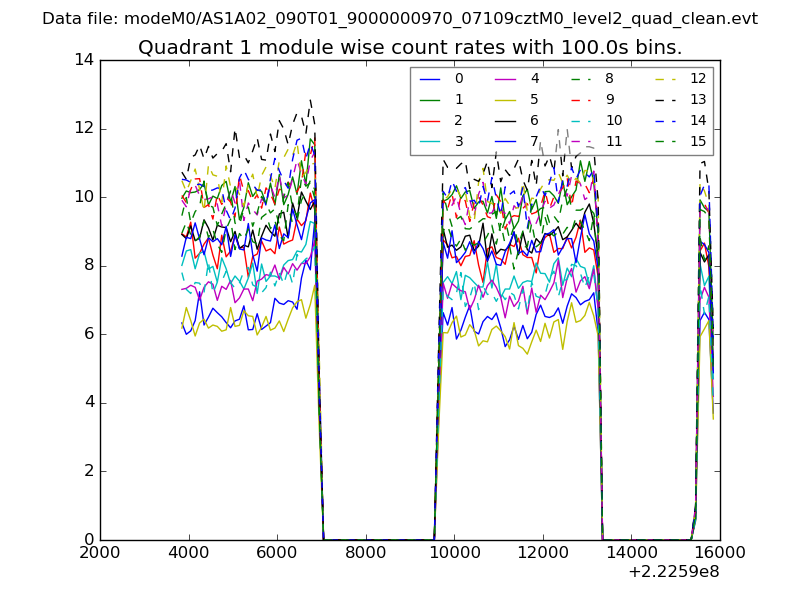
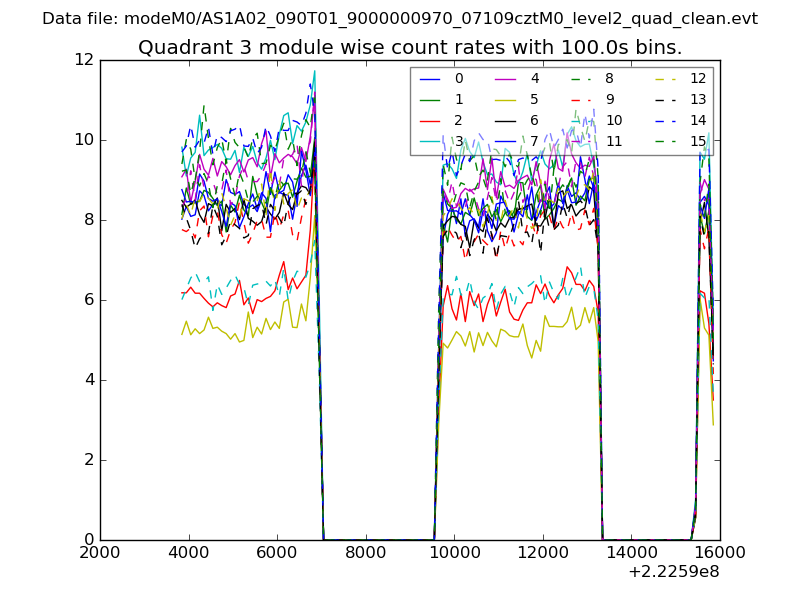
| Module-wise count rates for Quadrant A Data is divided into 100 sec bins |
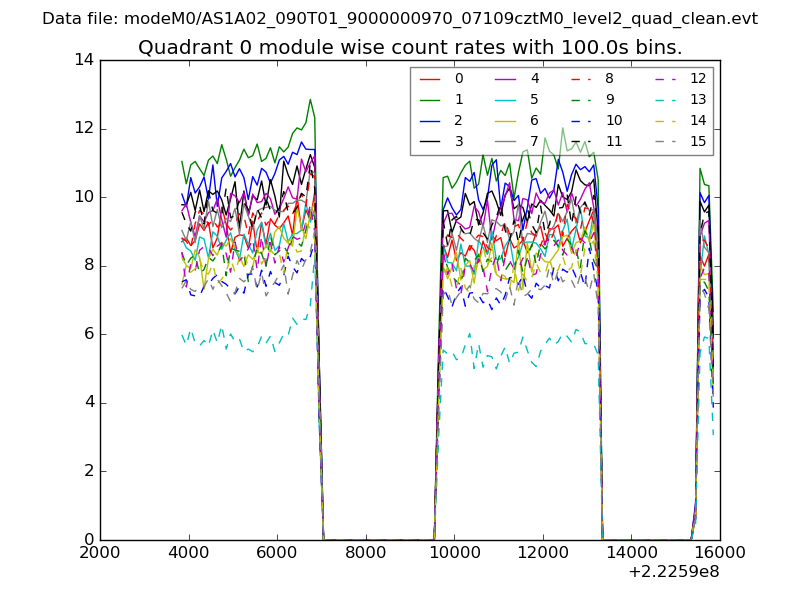 |
 |
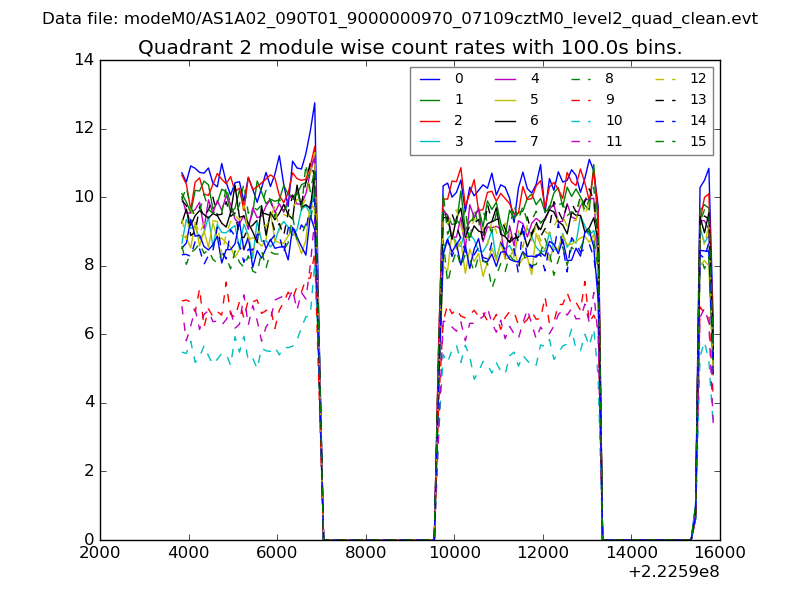
| Module-wise count rates for Quadrant B Data is divided into 100 sec bins |
 |
 |
| Module-wise count rates for Quadrant C Data is divided into 100 sec bins |
 |
 |
| Module-wise count rates for Quadrant D Data is divided into 100 sec bins |
 |
 |
| Parameter | Plot |
|---|---|
| CZT HV Monitor | 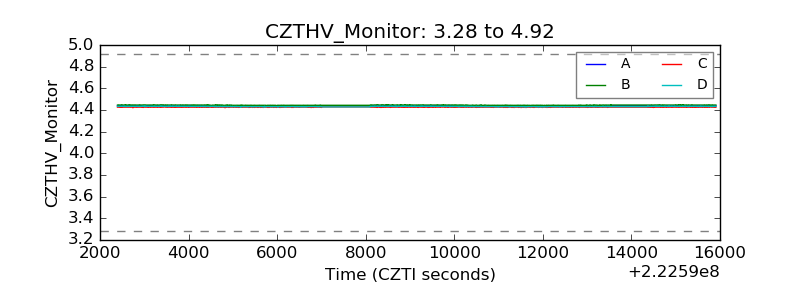 |
| D_VDD | 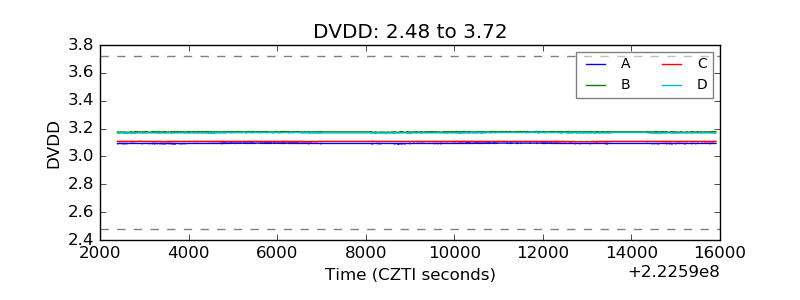 |
| Temperature 1 | 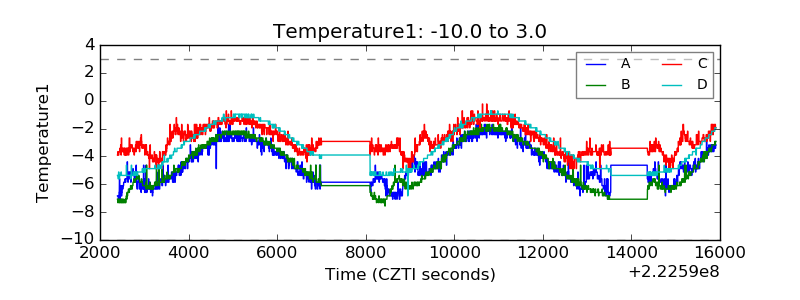 |
| Veto HV Monitor | 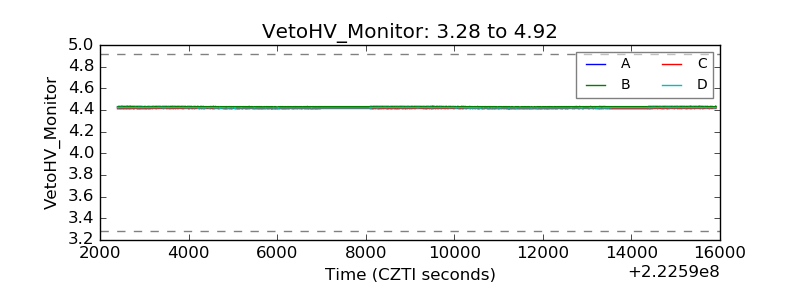 |
| Veto LLD | 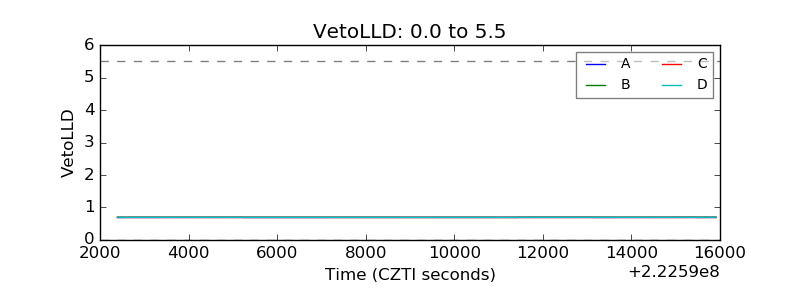 |
| Alpha Counter | 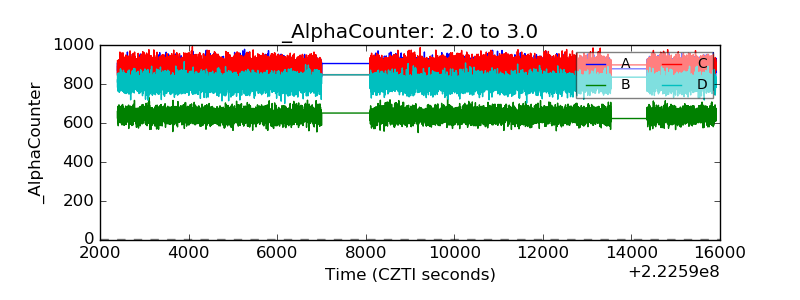 |
| _CPM_Rate | 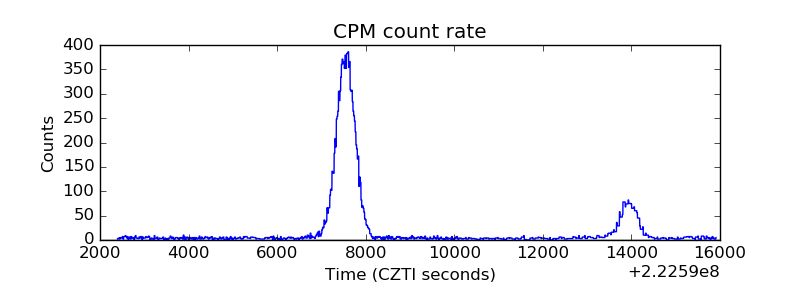 |
| CZT Counter | 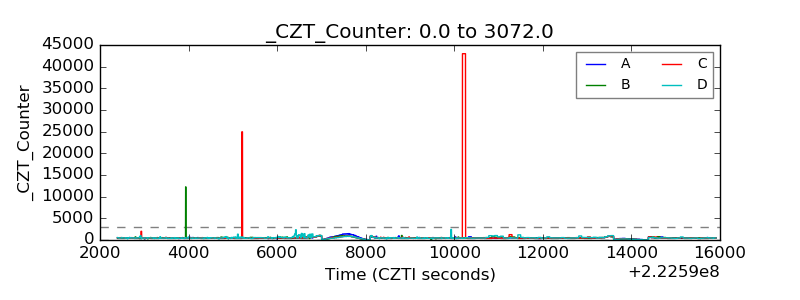 |
| +2.5 Volts monitor | 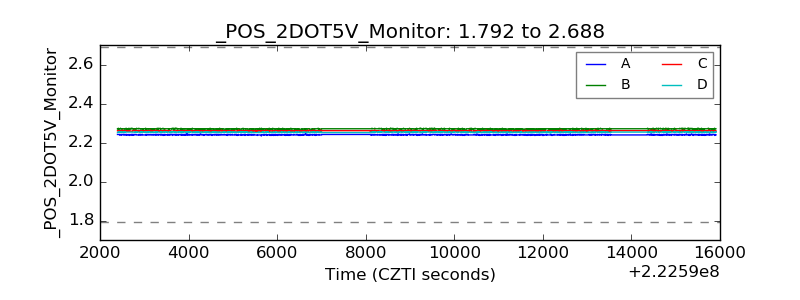 |
| +5 Volts monitor | 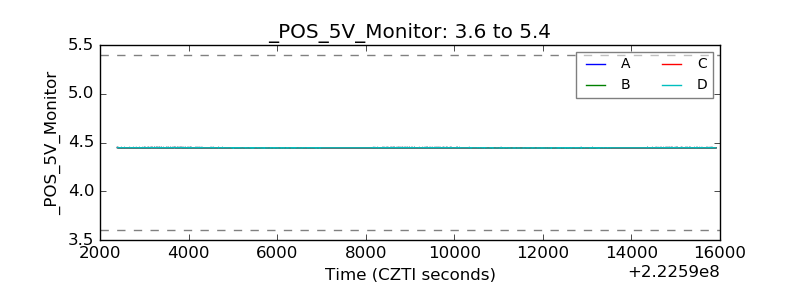 |
| _ROLL_ROT | 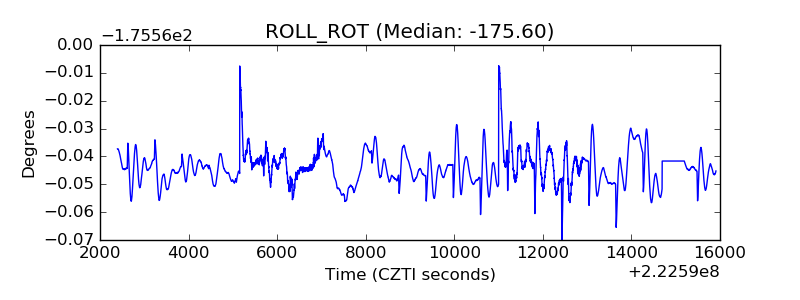 |
| _Roll_DEC | 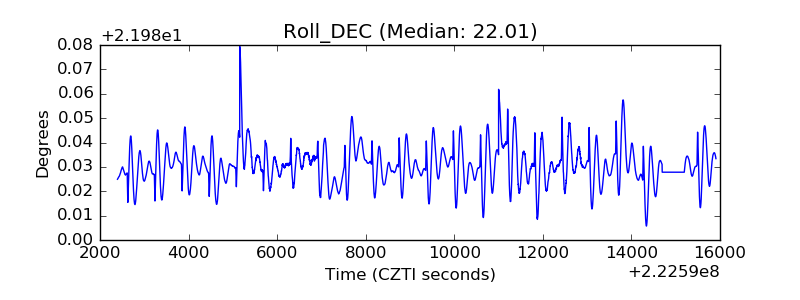 |
| _Roll_RA | 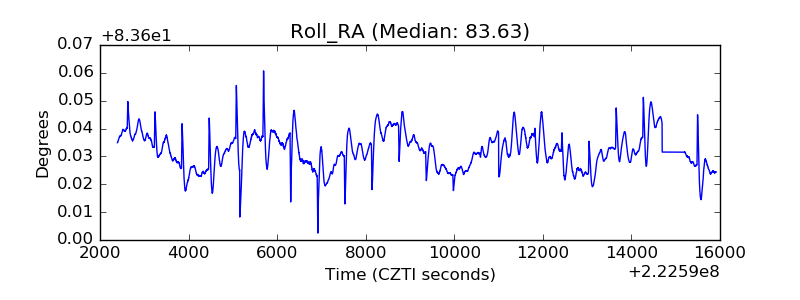 |
| Veto Counter | 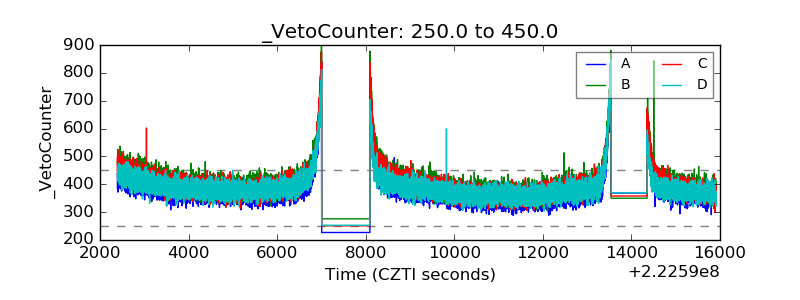 |