| Param | Original file | Final file |
|---|---|---|
| Filename | modeM0/AS1A02_090T01_9000000970_07110cztM0_level2.evt | modeM0/AS1A02_090T01_9000000970_07110cztM0_level2_quad_clean.evt |
| Size (bytes) | 513,679,680 | 93,885,120 |
| Size | 489.9 MB | 89.5 MB |
| Events in quadrant A | 3,537,716 | 588,113 |
| Events in quadrant B | 3,693,001 | 595,801 |
| Events in quadrant C | 3,628,278 | 586,705 |
| Events in quadrant D | 4,191,962 | 554,527 |
| Mode M0 | |||
|---|---|---|---|
| Quadrant | BADHDUFLAG | Total packets | Discarded packets |
| A | 0 | 15357 | 3 |
| B | 0 | 15581 | 2 |
| C | 0 | 15732 | 2 |
| D | 0 | 17149 | 2 |
| Mode M9 | |||
|---|---|---|---|
| Quadrant | BADHDUFLAG | Total packets | Discarded packets |
| A | 0 | 10 | 0 |
| B | 0 | 10 | 0 |
| C | 0 | 10 | 0 |
| D | 0 | 10 | 0 |
| Mode SS | |||
|---|---|---|---|
| Quadrant | BADHDUFLAG | Total packets | Discarded packets |
| A | 0 | 152 | 0 |
| B | 0 | 152 | 0 |
| C | 0 | 152 | 0 |
| D | 0 | 152 | 0 |
| Quadrant | Total seconds | Saturated seconds | Saturation percentage |
|---|---|---|---|
| A | 7441 | 198 | 2.660933% |
| B | 7441 | 213 | 2.862518% |
| C | 7441 | 155 | 2.083053% |
| D | 7441 | 203 | 2.728128% |
Noise dominated data is calculated using 1-second bins in cleaned event files. If a bin has >2000 counts, and if more than 50% of those come from <1% of pixels, then it is considered to be noise-dominated and hence unusable.
| Quadrant | # 1 sec bins | Bins with >0 counts | Bins with >2000 counts | High rate bins dominated by noise | Noise dominated (total time) | Noise dominated (detector-on time) | Marked lightcurve |
|---|---|---|---|---|---|---|---|
| A | 7771 | 7441 | 0 | 0 | 0.00% | 0.00% | 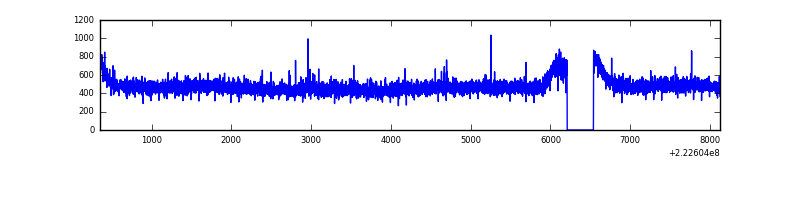 |
| B | 7771 | 7441 | 3 | 3 | 0.04% | 0.04% | 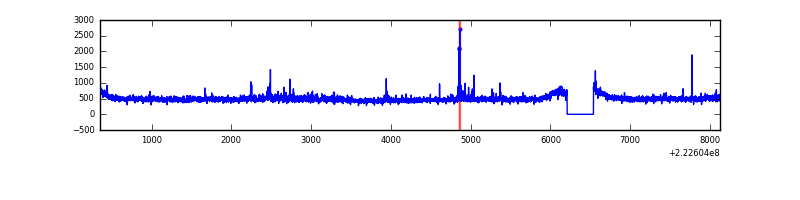 |
| C | 7771 | 7441 | 11 | 11 | 0.14% | 0.15% | 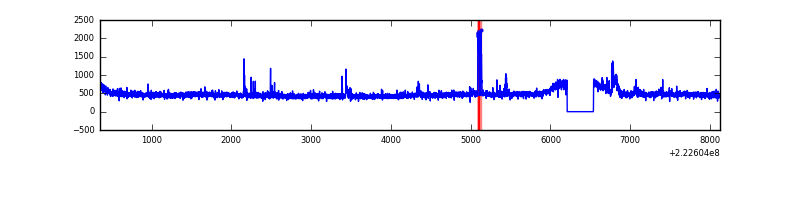 |
| D | 7771 | 7441 | 43 | 43 | 0.55% | 0.58% | 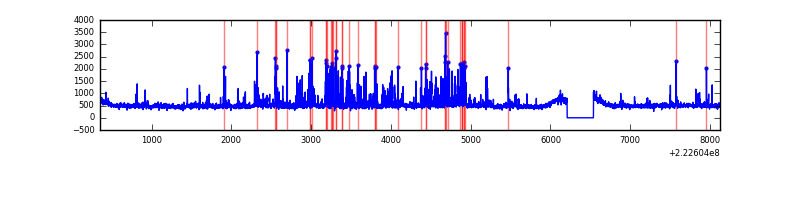 |
Top three noisy pixels from each quadrant. If the there are fewer than three noisy pixels in the level2.evt file, extra rows are filled as -1
| Pixel properties | Quadrant properties | ||||||
|---|---|---|---|---|---|---|---|
| Quadrant | DetID | PixID | Counts | Sigma | Mean | Median | Sigma |
| A | 8 | 15 | 21548 | 109.41 | 907 | 884 | 188.9 |
| A | 14 | 111 | 10612 | 51.51 | 907 | 884 | 188.9 |
| A | 13 | 14 | 9135 | 43.69 | 907 | 884 | 188.9 |
| B | 0 | 214 | 78628 | 441.86 | 915 | 893 | 175.9 |
| B | 10 | 246 | 37838 | 210.0 | 915 | 893 | 175.9 |
| B | 12 | 111 | 17699 | 95.53 | 915 | 893 | 175.9 |
| C | 10 | 22 | 113831 | 551.07 | 884 | 889 | 204.9 |
| C | 4 | 254 | 34260 | 162.83 | 884 | 889 | 204.9 |
| C | 9 | 68 | 22319 | 104.56 | 884 | 889 | 204.9 |
| D | 2 | 216 | 580727 | 2653.96 | 883 | 854 | 218.5 |
| D | 8 | 195 | 222309 | 1013.55 | 883 | 854 | 218.5 |
| D | 2 | 14 | 33060 | 147.4 | 883 | 854 | 218.5 |
Histogram calculated using DETX and DETY for each event in the final _common_clean file
| Quadrant A | 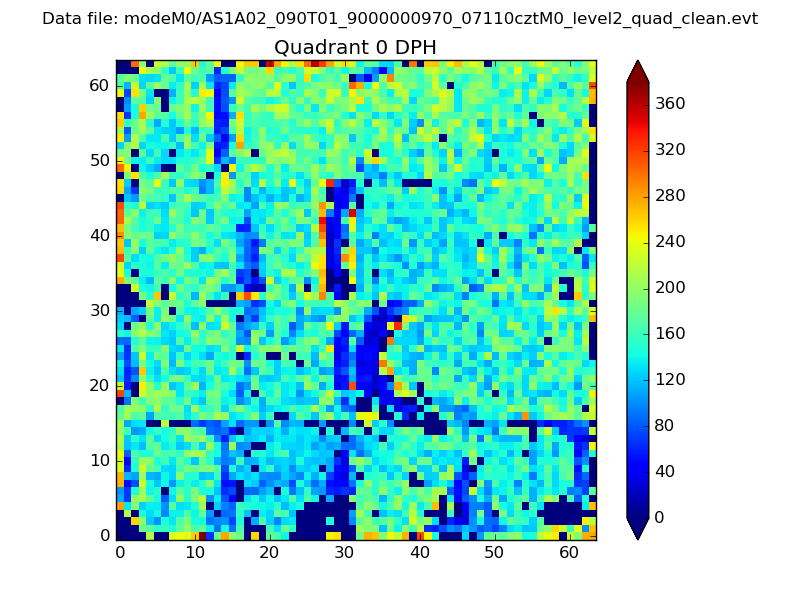 |
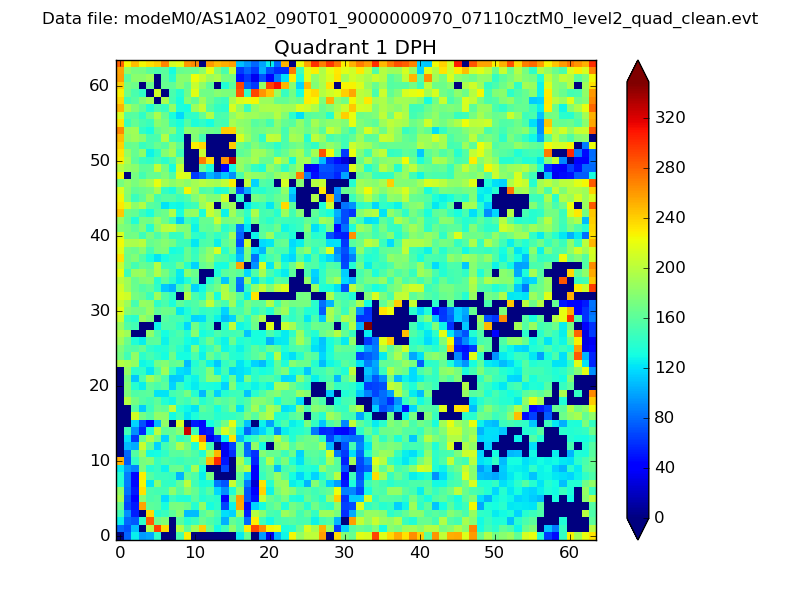 |
Quadrant B |
|---|---|---|---|
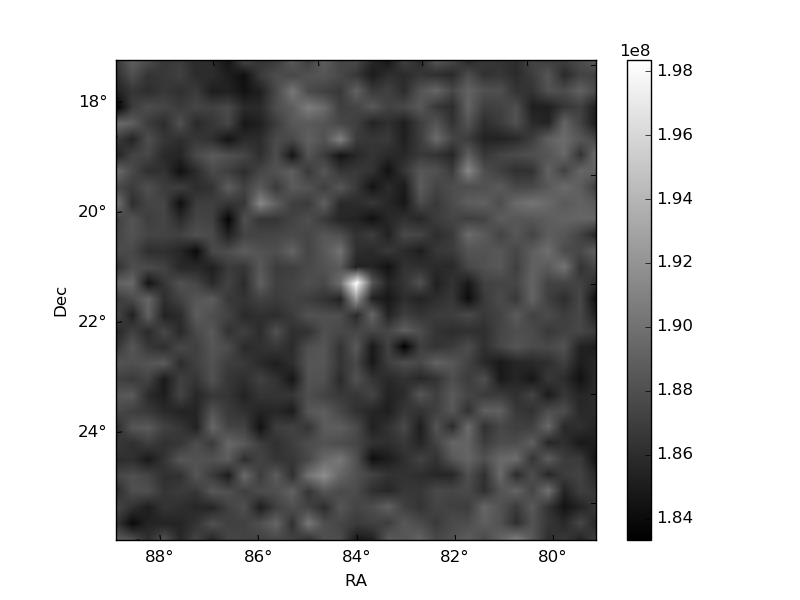
| Quadrant D | 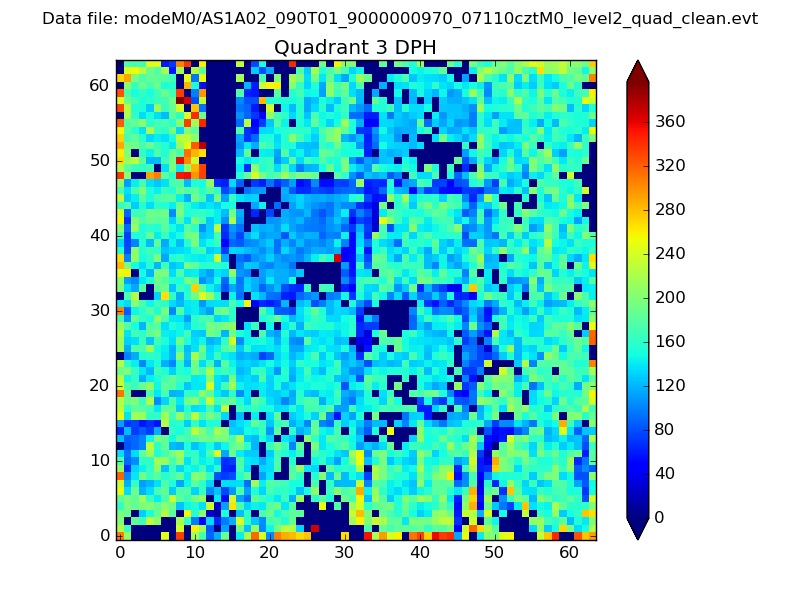 |
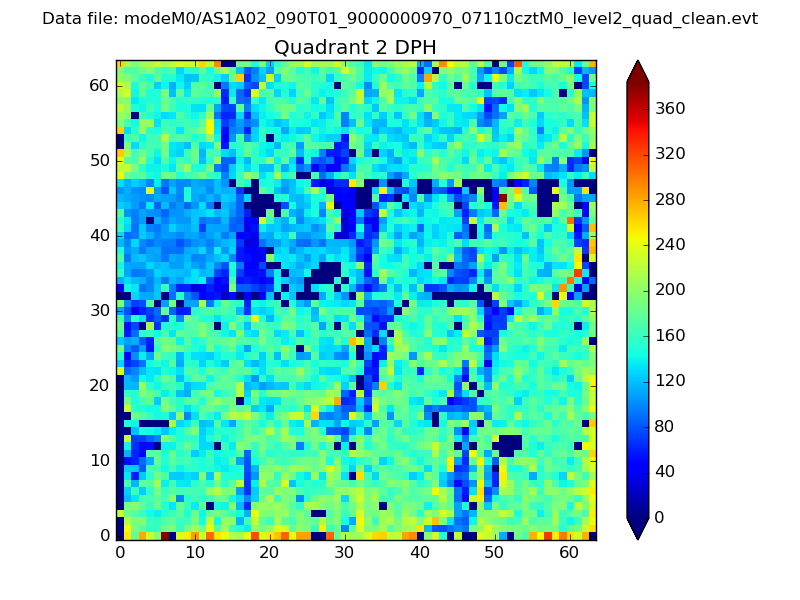 |
Quadrant C |
| Plot type | Count rate plots | Images |
|---|---|---|
| Comparison with Poisson distribution Blue bars denote a histogram of data divided into 1 sec bins. Red curve is a Poisson curve with rate = median count rate of data. |
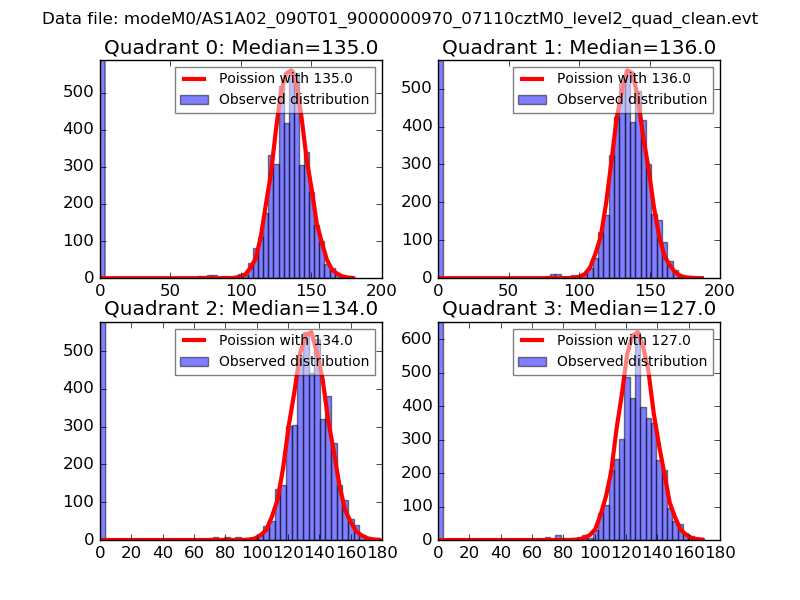 |
 |
| Quadrant-wise count rates Data is divided into 100 sec bins |
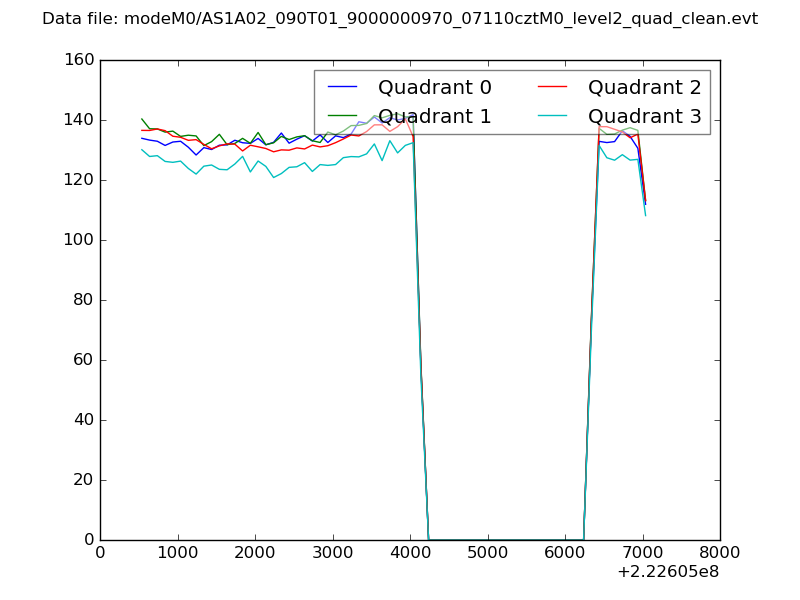 |
|
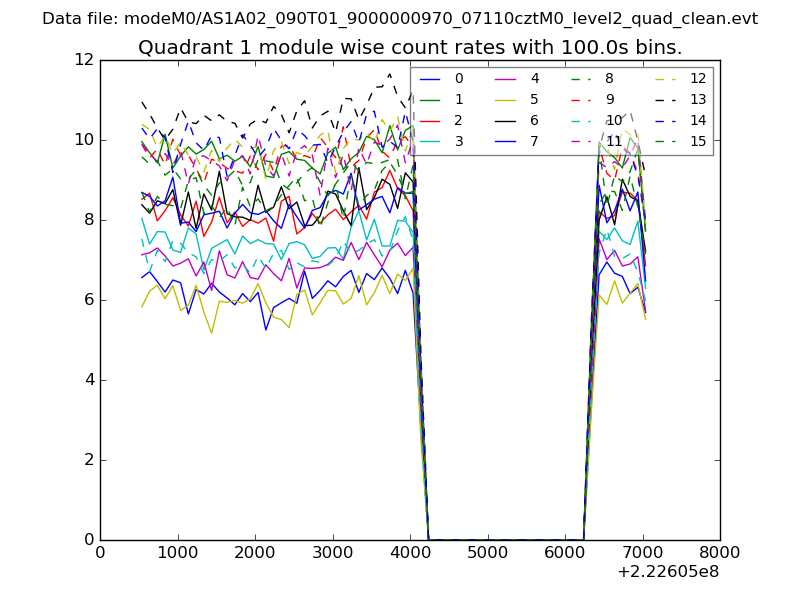
| Module-wise count rates for Quadrant A Data is divided into 100 sec bins |
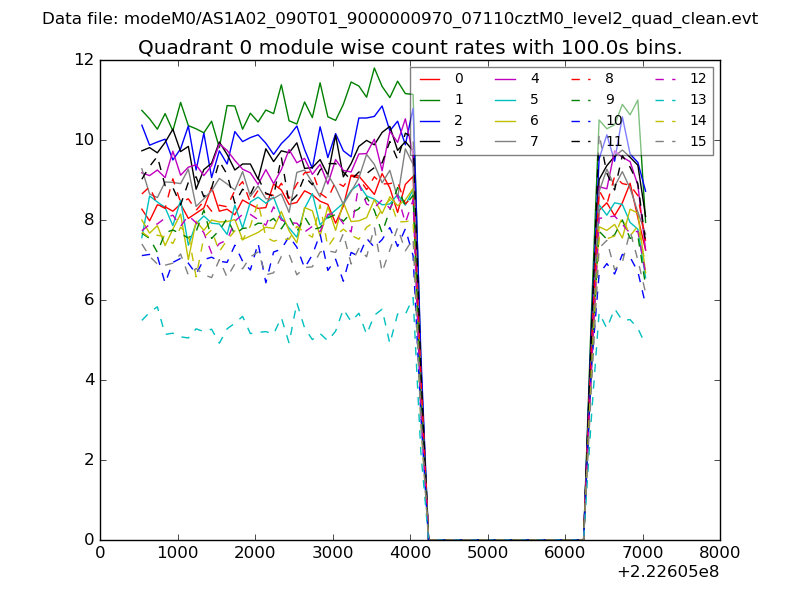 |
 |
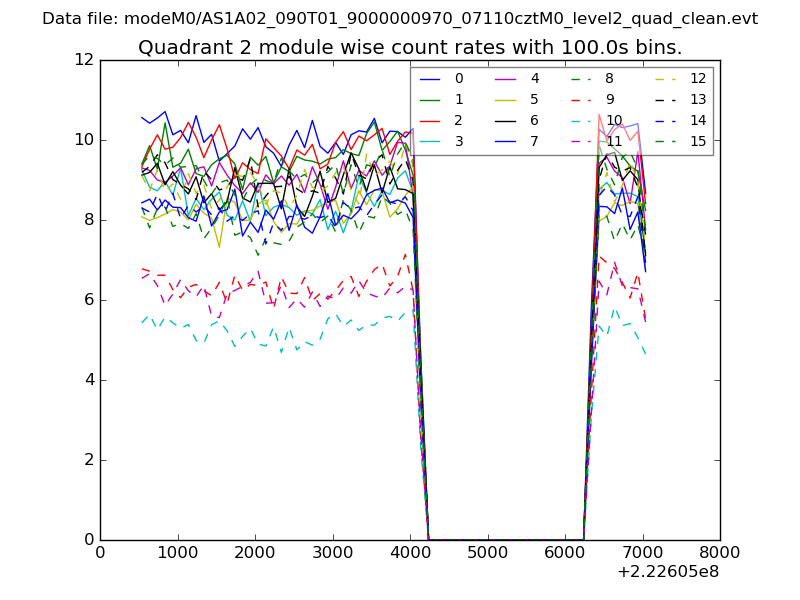
| Module-wise count rates for Quadrant B Data is divided into 100 sec bins |
 |
 |
| Module-wise count rates for Quadrant C Data is divided into 100 sec bins |
 |
 |
| Module-wise count rates for Quadrant D Data is divided into 100 sec bins |
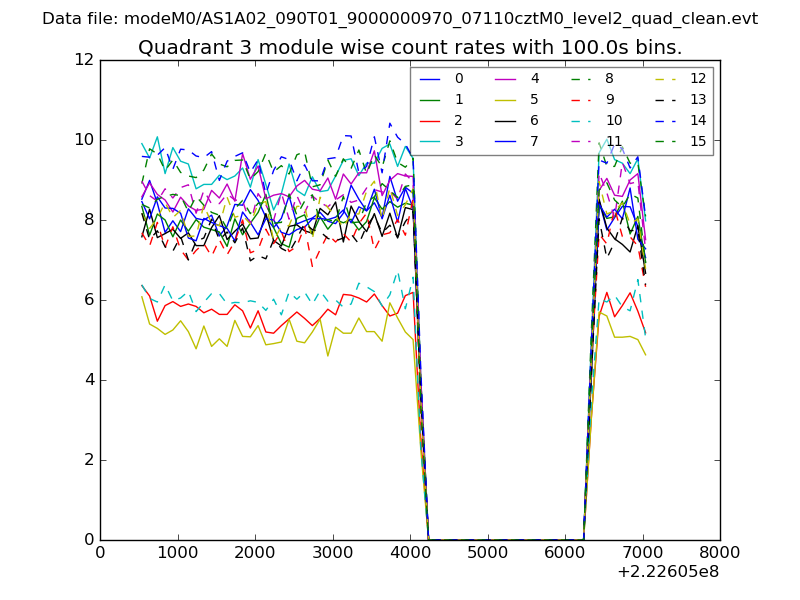 |
 |
| Parameter | Plot |
|---|---|
| CZT HV Monitor | 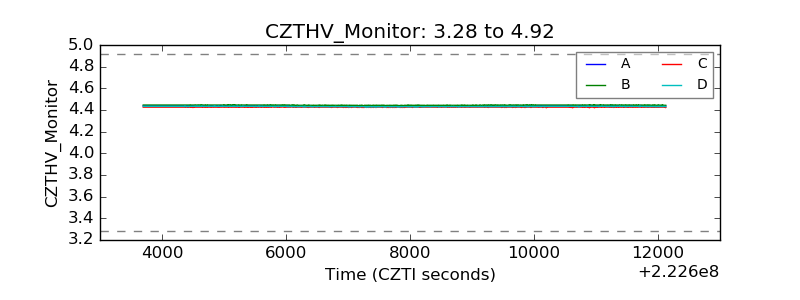 |
| D_VDD | 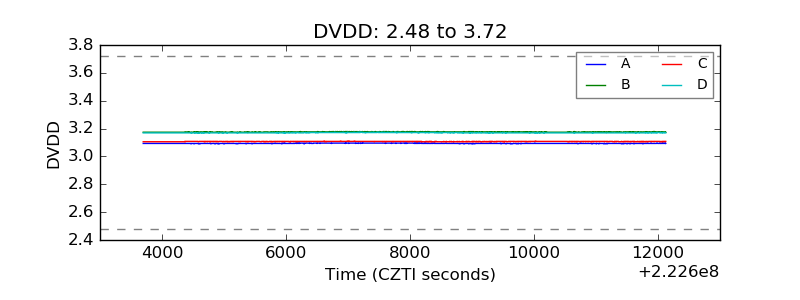 |
| Temperature 1 | 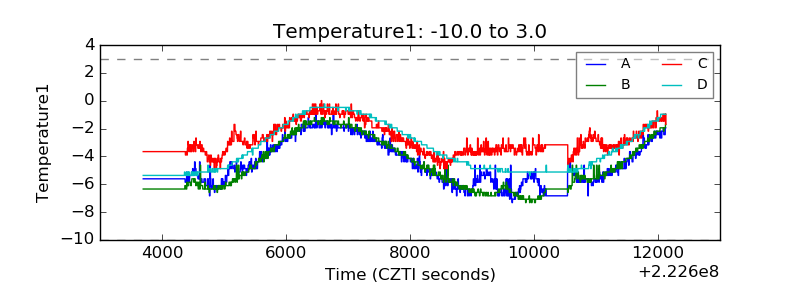 |
| Veto HV Monitor | 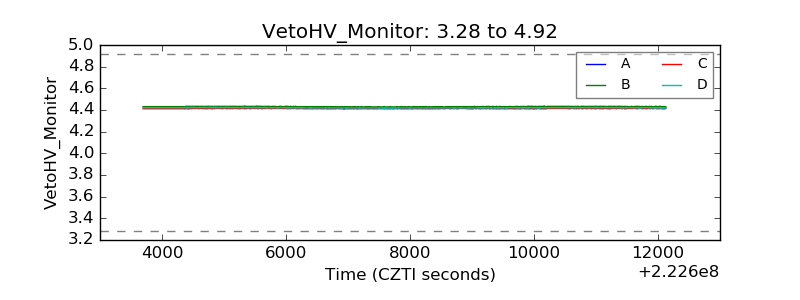 |
| Veto LLD | 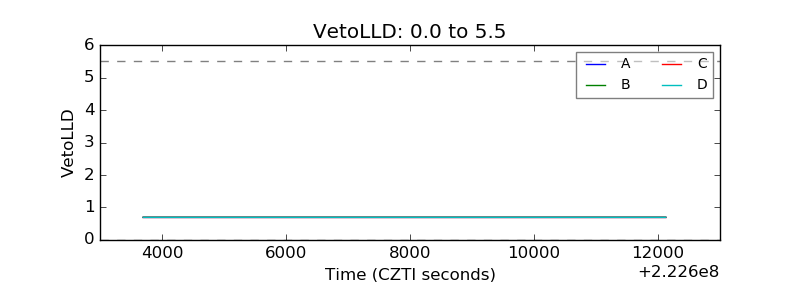 |
| Alpha Counter |  |
| _CPM_Rate | 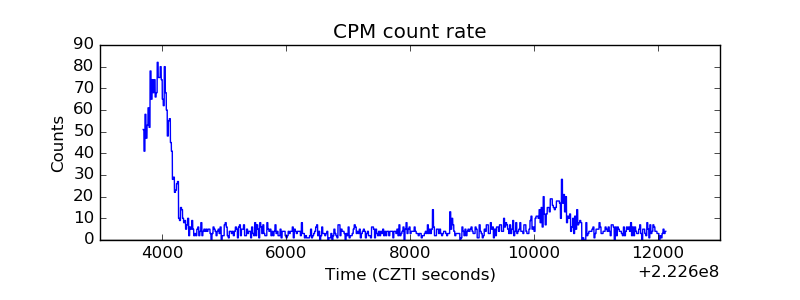 |
| CZT Counter | 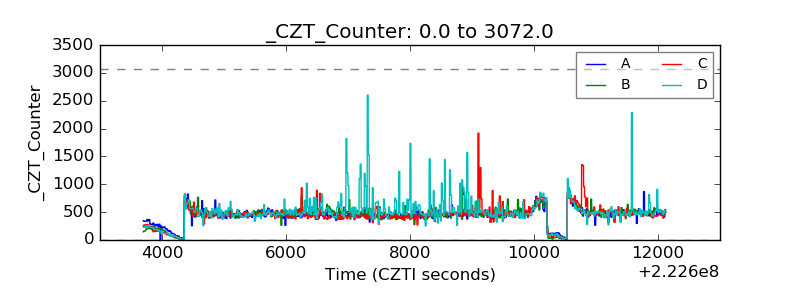 |
| +2.5 Volts monitor |  |
| +5 Volts monitor |  |
| _ROLL_ROT | 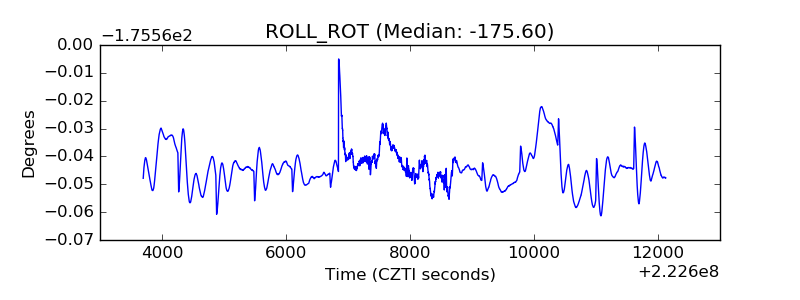 |
| _Roll_DEC | 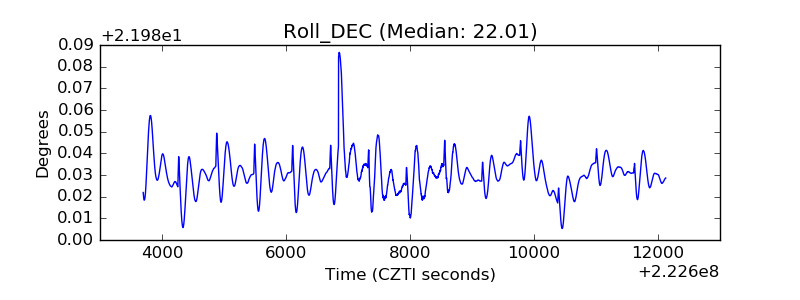 |
| _Roll_RA | 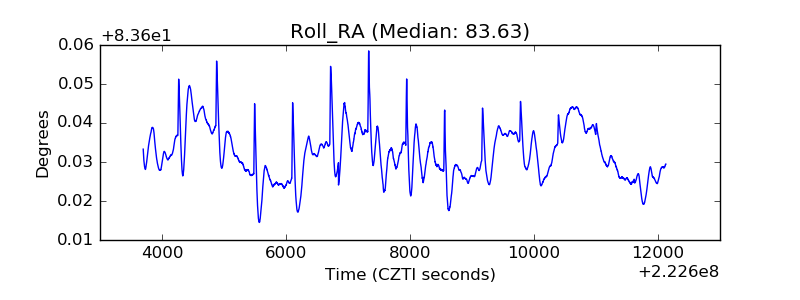 |
| Veto Counter | 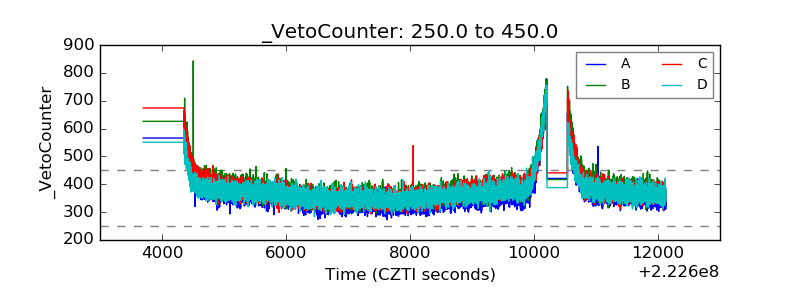 |