| Param | Original file | Final file |
|---|---|---|
| Filename | modeM0/AS1A02_090T01_9000000970_07111cztM0_level2.evt | modeM0/AS1A02_090T01_9000000970_07111cztM0_level2_quad_clean.evt |
| Size (bytes) | 486,970,560 | 97,372,800 |
| Size | 464.4 MB | 92.9 MB |
| Events in quadrant A | 3,312,289 | 625,391 |
| Events in quadrant B | 3,509,985 | 631,136 |
| Events in quadrant C | 3,388,545 | 622,309 |
| Events in quadrant D | 4,067,997 | 589,479 |
| Mode M0 | |||
|---|---|---|---|
| Quadrant | BADHDUFLAG | Total packets | Discarded packets |
| A | 0 | 14367 | 2 |
| B | 0 | 14684 | 1 |
| C | 0 | 14667 | 1 |
| D | 0 | 16256 | 1 |
| Mode SS | |||
|---|---|---|---|
| Quadrant | BADHDUFLAG | Total packets | Discarded packets |
| A | 0 | 138 | 0 |
| B | 0 | 138 | 0 |
| C | 0 | 138 | 0 |
| D | 0 | 138 | 0 |
| Quadrant | Total seconds | Saturated seconds | Saturation percentage |
|---|---|---|---|
| A | 6899 | 306 | 4.435425% |
| B | 6899 | 309 | 4.478910% |
| C | 6899 | 181 | 2.623569% |
| D | 6899 | 321 | 4.652848% |
Noise dominated data is calculated using 1-second bins in cleaned event files. If a bin has >2000 counts, and if more than 50% of those come from <1% of pixels, then it is considered to be noise-dominated and hence unusable.
| Quadrant | # 1 sec bins | Bins with >0 counts | Bins with >2000 counts | High rate bins dominated by noise | Noise dominated (total time) | Noise dominated (detector-on time) | Marked lightcurve |
|---|---|---|---|---|---|---|---|
| A | 6919 | 6899 | 0 | 0 | 0.00% | 0.00% | 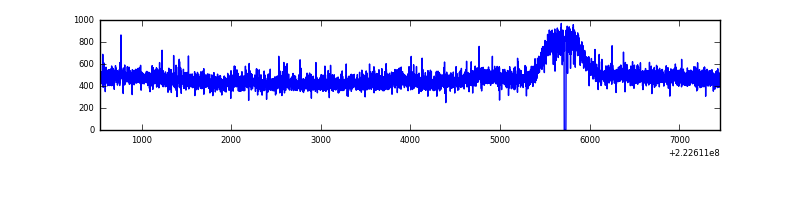 |
| B | 6919 | 6899 | 4 | 4 | 0.06% | 0.06% | 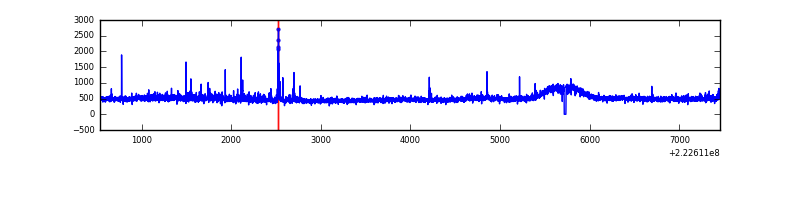 |
| C | 6919 | 6899 | 16 | 16 | 0.23% | 0.23% | 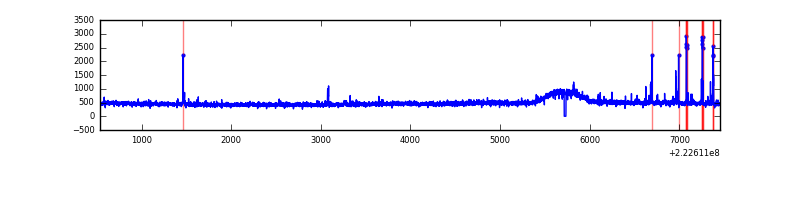 |
| D | 6919 | 6900 | 61 | 61 | 0.88% | 0.88% | 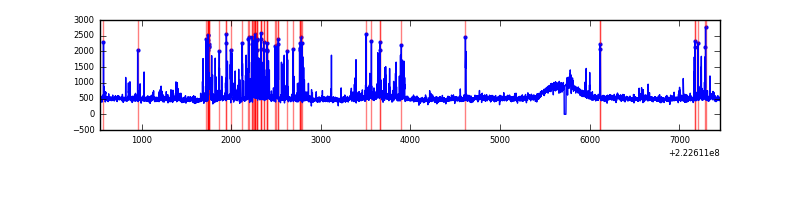 |
Top three noisy pixels from each quadrant. If the there are fewer than three noisy pixels in the level2.evt file, extra rows are filled as -1
| Pixel properties | Quadrant properties | ||||||
|---|---|---|---|---|---|---|---|
| Quadrant | DetID | PixID | Counts | Sigma | Mean | Median | Sigma |
| A | 8 | 15 | 10988 | 57.38 | 852 | 835 | 176.9 |
| A | 14 | 111 | 8397 | 42.74 | 852 | 835 | 176.9 |
| A | 13 | 14 | 8099 | 41.06 | 852 | 835 | 176.9 |
| B | 0 | 214 | 102717 | 616.93 | 856 | 836 | 165.1 |
| B | 0 | 219 | 37377 | 221.27 | 856 | 836 | 165.1 |
| B | 10 | 246 | 27635 | 162.28 | 856 | 836 | 165.1 |
| C | 4 | 254 | 101415 | 515.79 | 830 | 836 | 195.0 |
| C | 10 | 22 | 23724 | 117.37 | 830 | 836 | 195.0 |
| C | 9 | 68 | 20368 | 100.16 | 830 | 836 | 195.0 |
| D | 2 | 216 | 501450 | 2390.46 | 832 | 803 | 209.4 |
| D | 8 | 195 | 324479 | 1545.47 | 832 | 803 | 209.4 |
| D | 5 | 81 | 37281 | 174.17 | 832 | 803 | 209.4 |
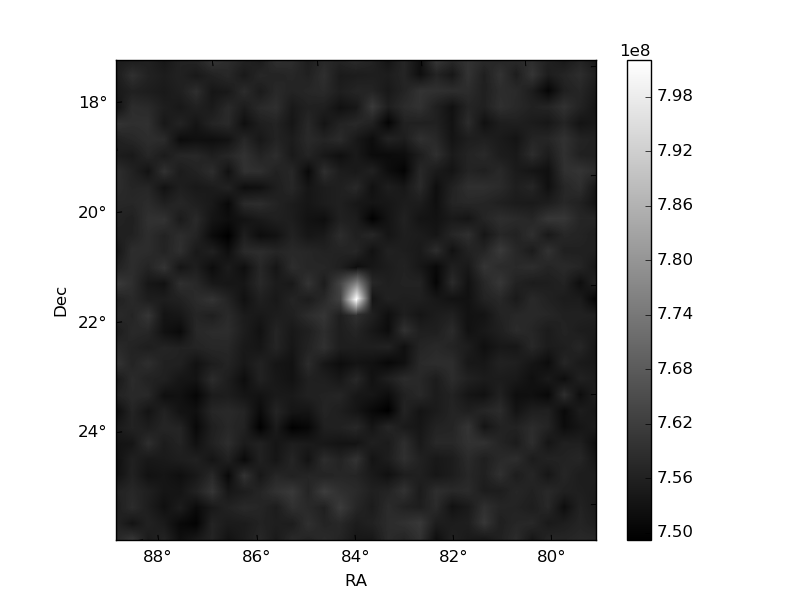
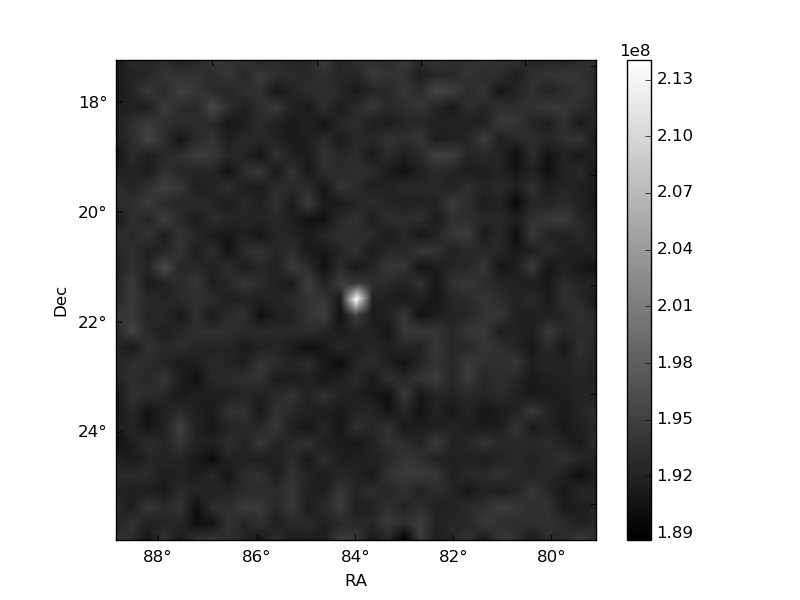
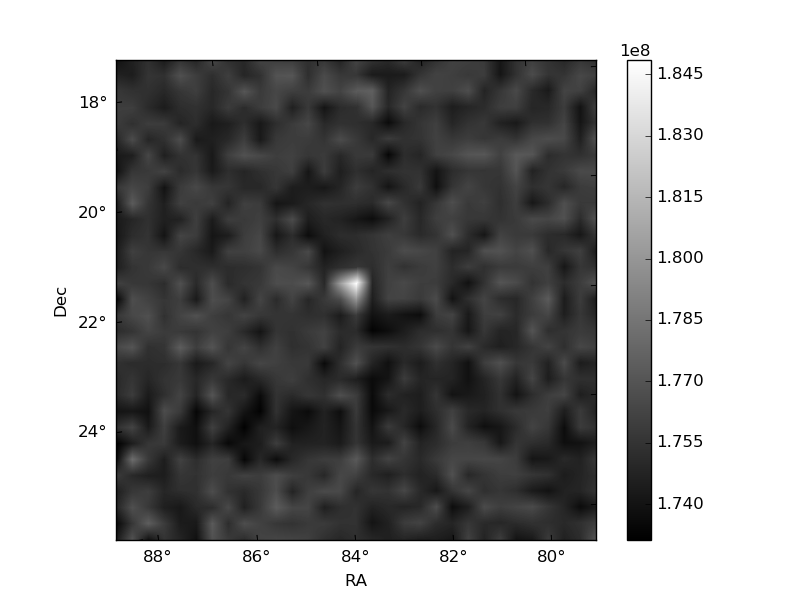
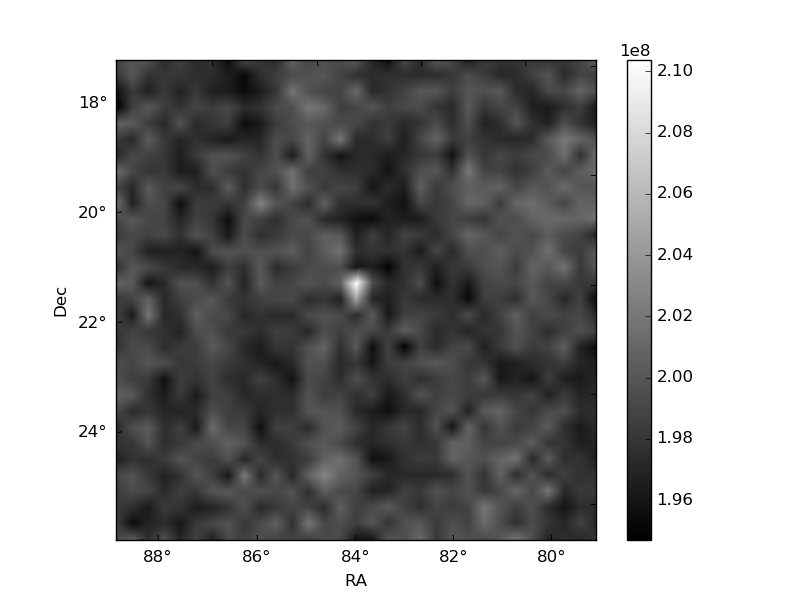
Histogram calculated using DETX and DETY for each event in the final _common_clean file
| Quadrant A | 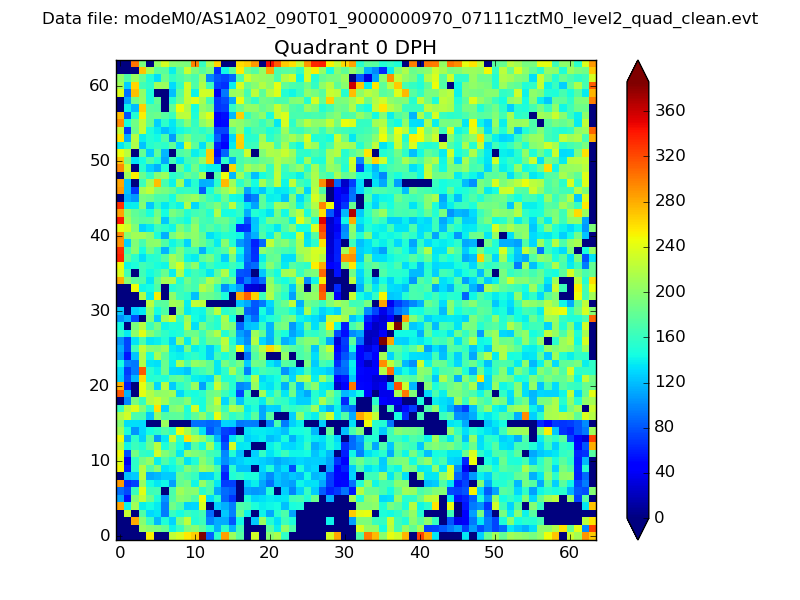 |
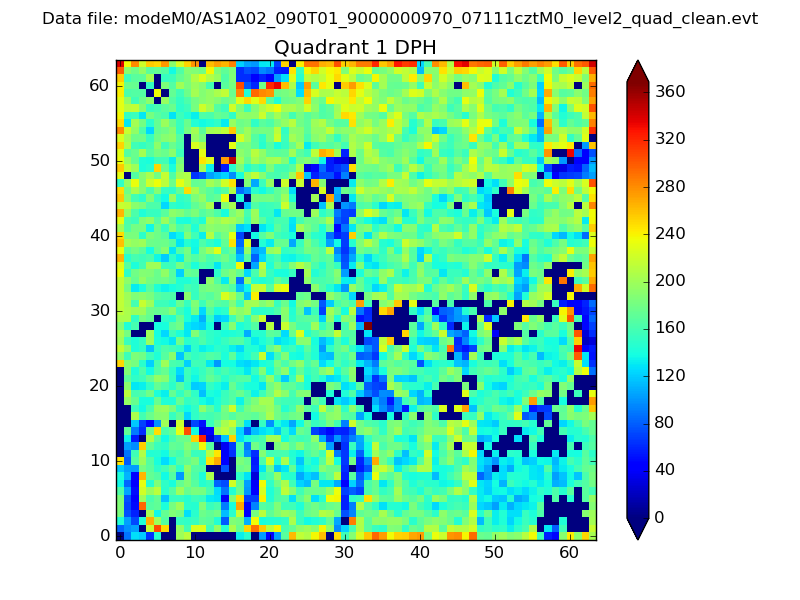 |
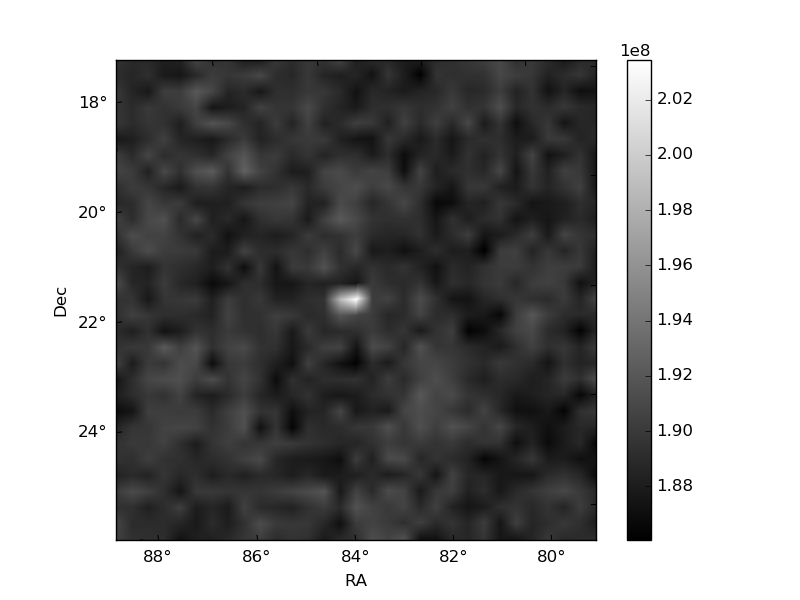
Quadrant B |
|---|---|---|---|
| Quadrant D | 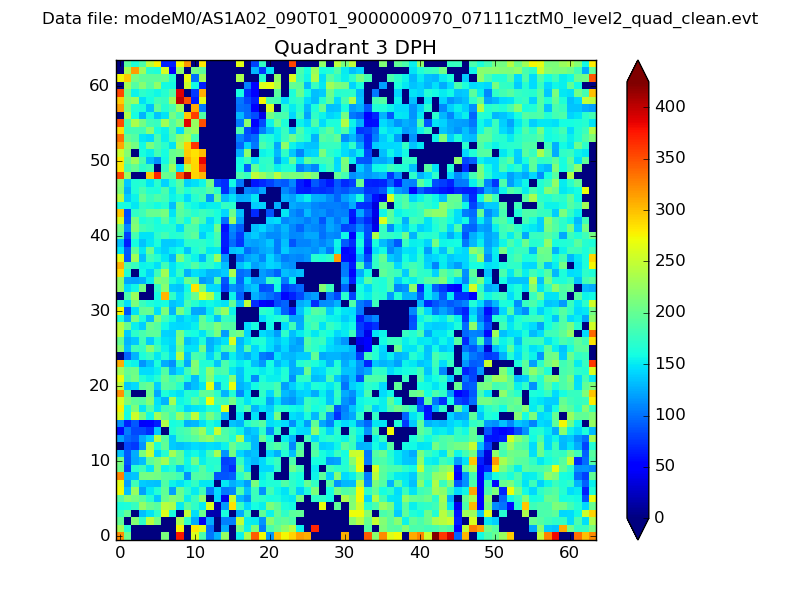 |
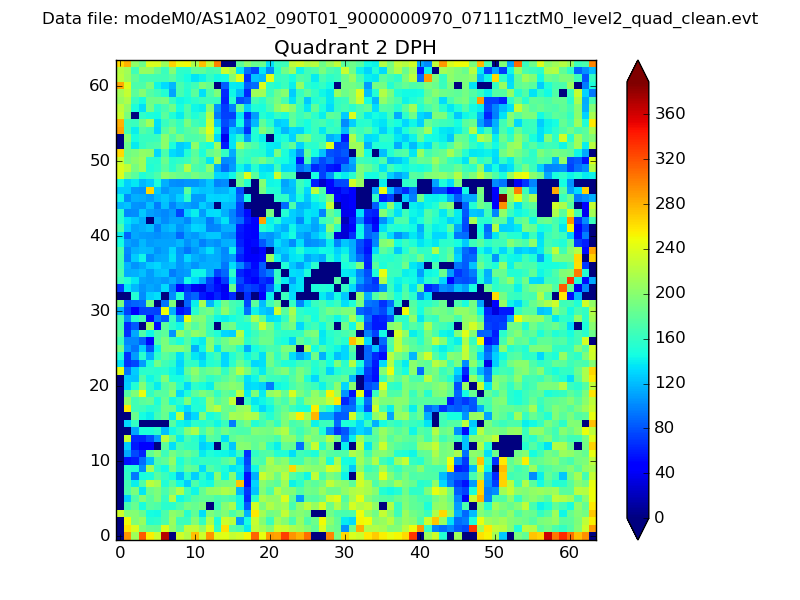 |
Quadrant C |
| Plot type | Count rate plots | Images |
|---|---|---|
| Comparison with Poisson distribution Blue bars denote a histogram of data divided into 1 sec bins. Red curve is a Poisson curve with rate = median count rate of data. |
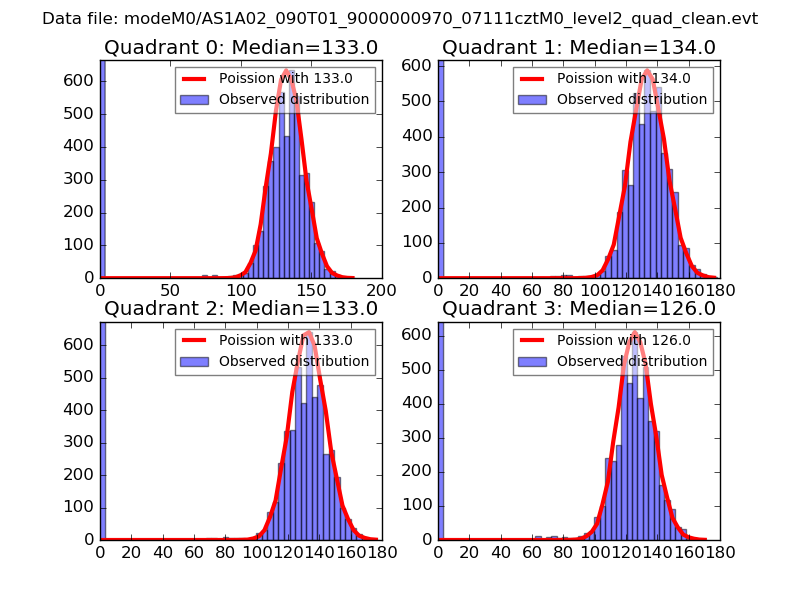 |
 |
| Quadrant-wise count rates Data is divided into 100 sec bins |
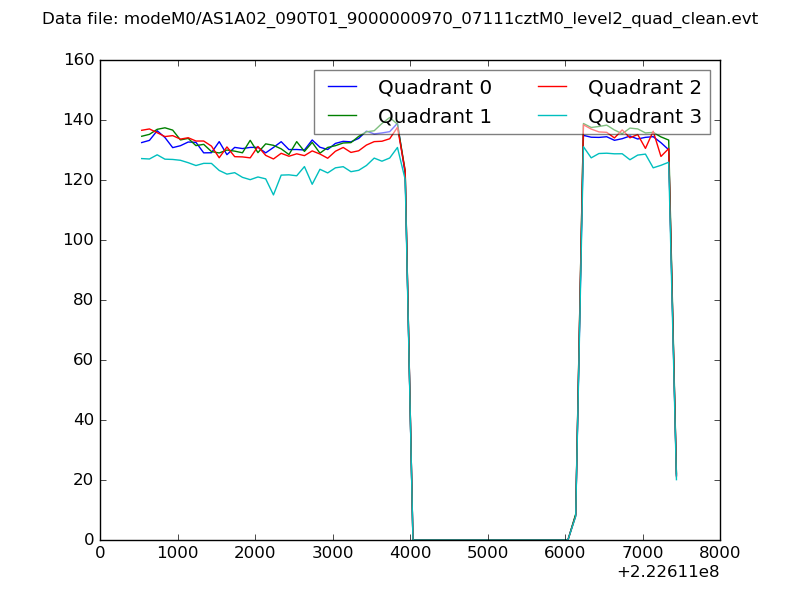 |
|
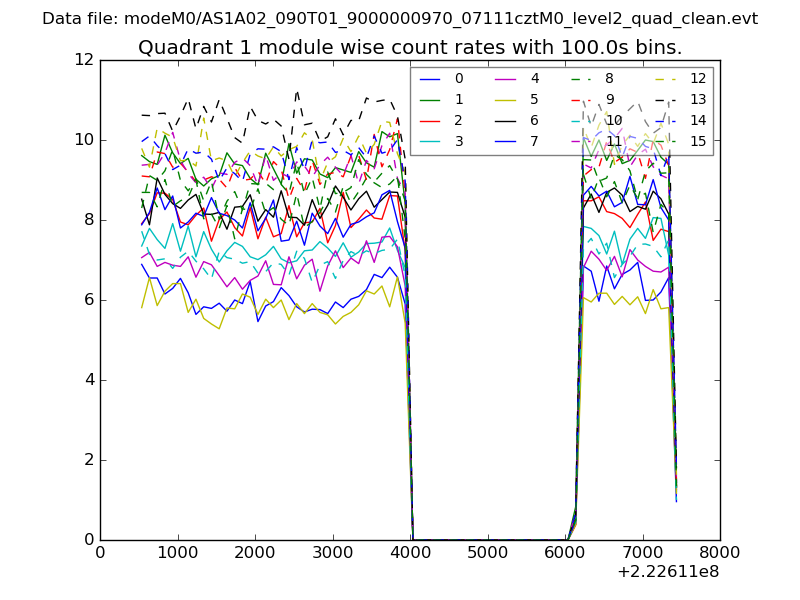
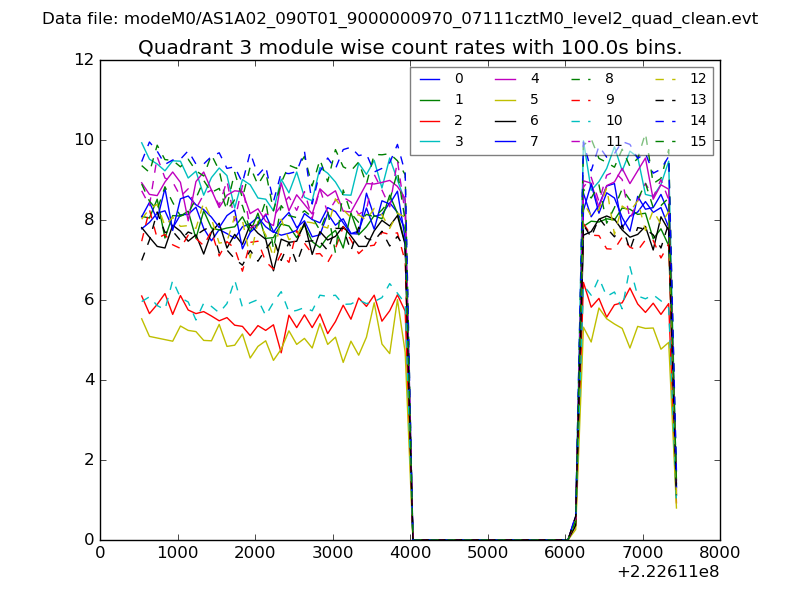
| Module-wise count rates for Quadrant A Data is divided into 100 sec bins |
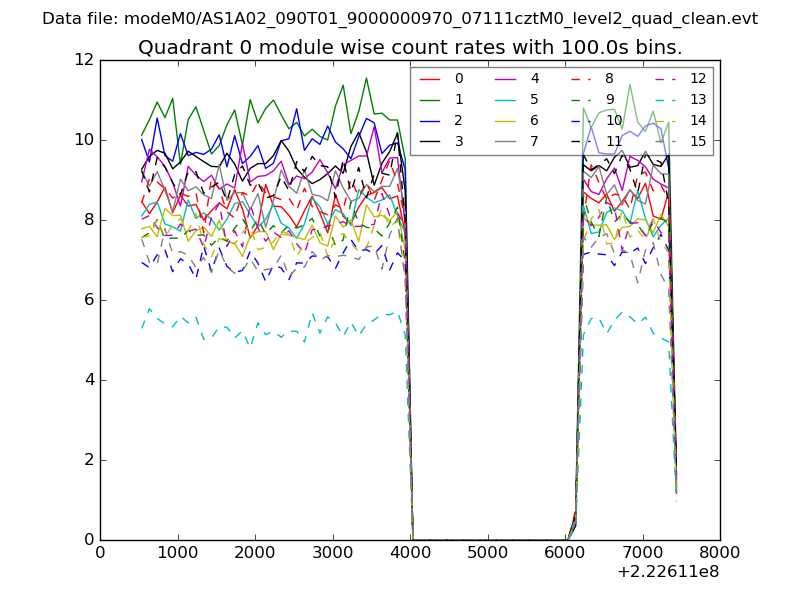 |
 |
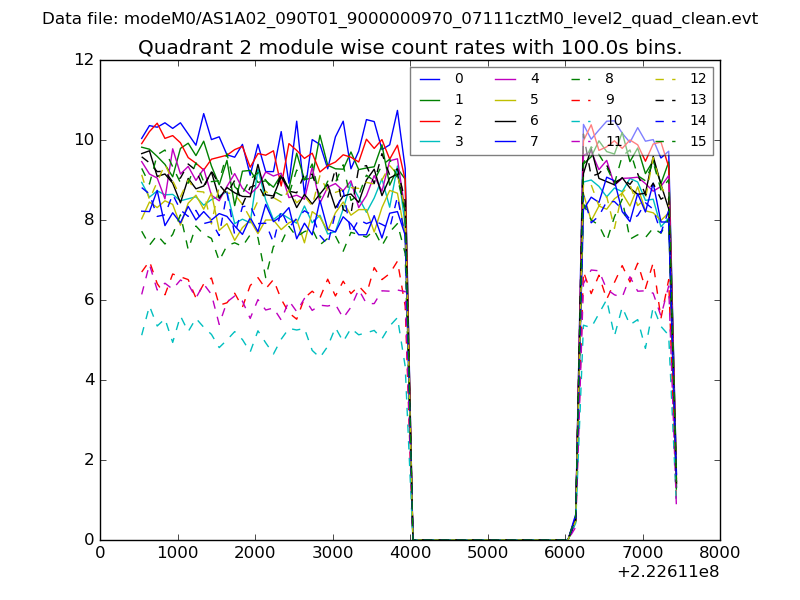
| Module-wise count rates for Quadrant B Data is divided into 100 sec bins |
 |
 |
| Module-wise count rates for Quadrant C Data is divided into 100 sec bins |
 |
 |
| Module-wise count rates for Quadrant D Data is divided into 100 sec bins |
 |
 |
| Parameter | Plot |
|---|---|
| CZT HV Monitor | 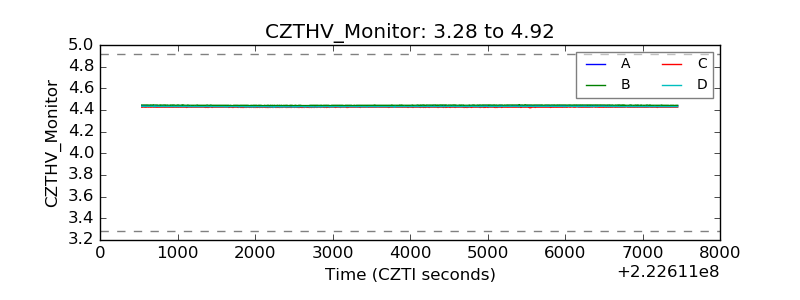 |
| D_VDD | 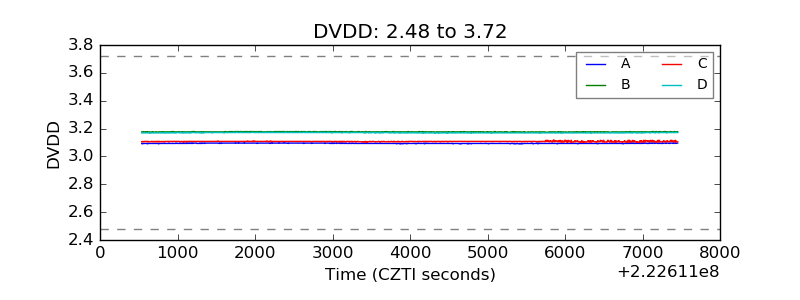 |
| Temperature 1 | 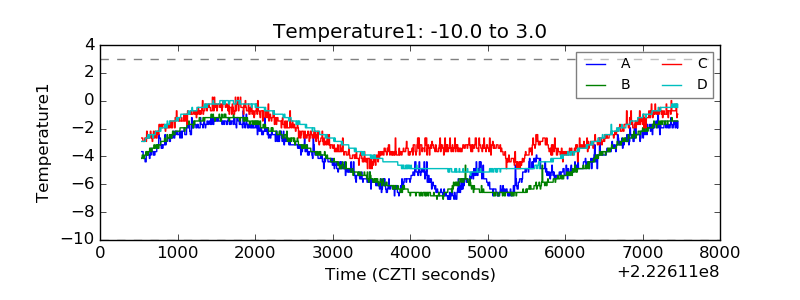 |
| Veto HV Monitor | 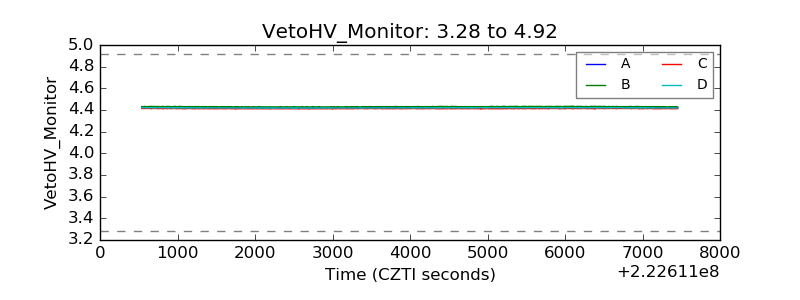 |
| Veto LLD | 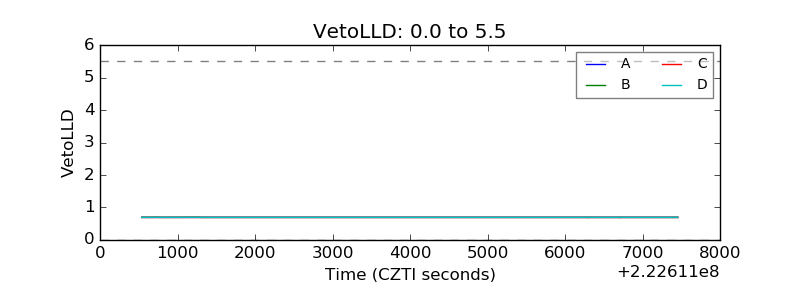 |
| Alpha Counter | 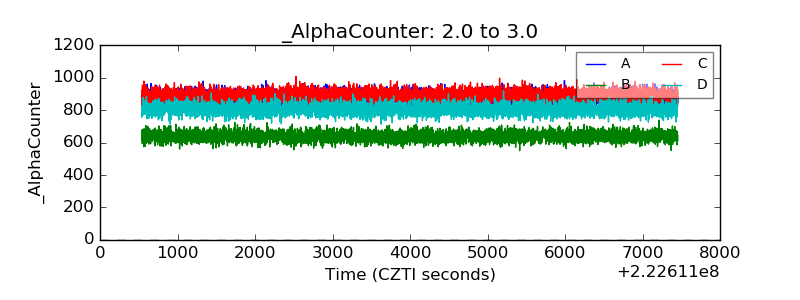 |
| _CPM_Rate | 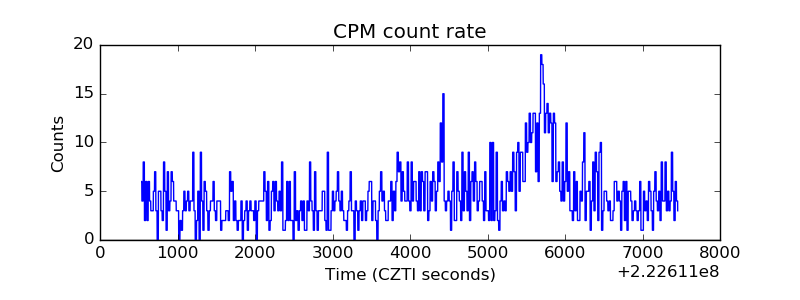 |
| CZT Counter | 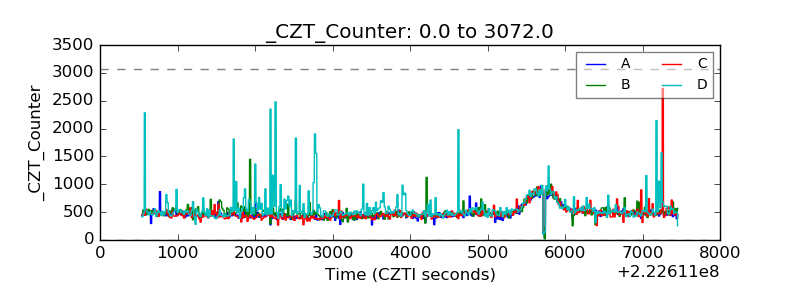 |
| +2.5 Volts monitor |  |
| +5 Volts monitor |  |
| _ROLL_ROT | 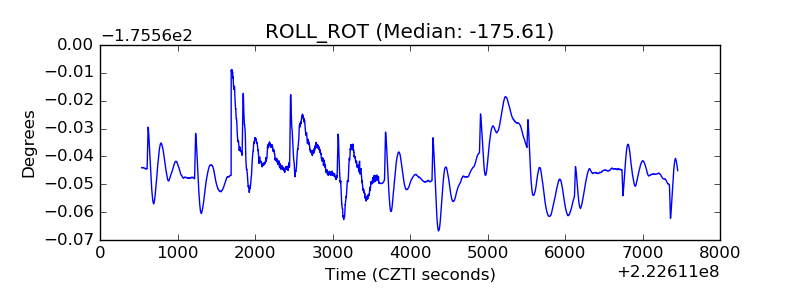 |
| _Roll_DEC | 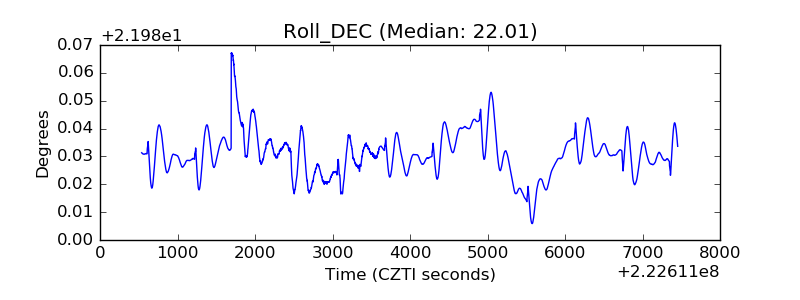 |
| _Roll_RA | 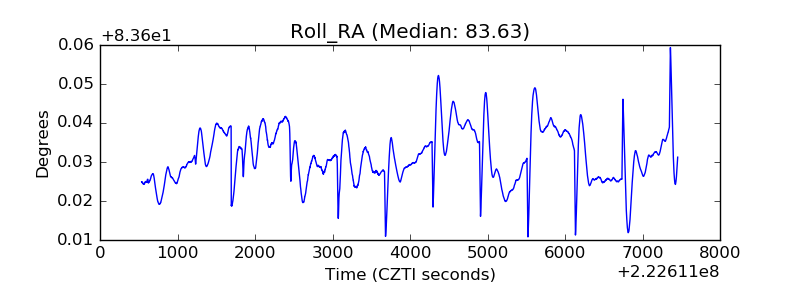 |
| Veto Counter | 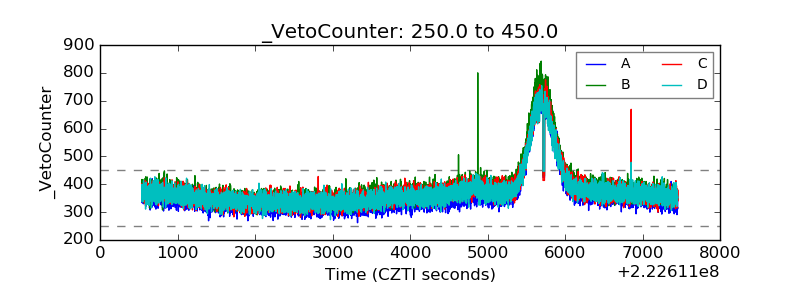 |