| Param | Original file | Final file |
|---|---|---|
| Filename | modeM0/AS1A02_090T01_9000000970_07115cztM0_level2.evt | modeM0/AS1A02_090T01_9000000970_07115cztM0_level2_quad_clean.evt |
| Size (bytes) | 1,215,048,960 | 236,093,760 |
| Size | 1.1 GB | 225.2 MB |
| Events in quadrant A | 8,210,552 | 1,504,702 |
| Events in quadrant B | 8,785,656 | 1,511,907 |
| Events in quadrant C | 8,357,469 | 1,496,435 |
| Events in quadrant D | 10,238,190 | 1,408,323 |
| Mode M0 | |||
|---|---|---|---|
| Quadrant | BADHDUFLAG | Total packets | Discarded packets |
| A | 0 | 36665 | 3 |
| B | 0 | 37868 | 2 |
| C | 0 | 37175 | 2 |
| D | 0 | 41764 | 2 |
| Mode M9 | |||
|---|---|---|---|
| Quadrant | BADHDUFLAG | Total packets | Discarded packets |
| A | 0 | 22 | 0 |
| B | 0 | 22 | 0 |
| C | 0 | 22 | 0 |
| D | 0 | 22 | 0 |
| Mode SS | |||
|---|---|---|---|
| Quadrant | BADHDUFLAG | Total packets | Discarded packets |
| A | 0 | 360 | 0 |
| B | 0 | 360 | 0 |
| C | 0 | 360 | 0 |
| D | 0 | 360 | 0 |
| Quadrant | Total seconds | Saturated seconds | Saturation percentage |
|---|---|---|---|
| A | 17845 | 128 | 0.717288% |
| B | 17845 | 165 | 0.924629% |
| C | 17845 | 98 | 0.549173% |
| D | 17845 | 341 | 1.910899% |
Noise dominated data is calculated using 1-second bins in cleaned event files. If a bin has >2000 counts, and if more than 50% of those come from <1% of pixels, then it is considered to be noise-dominated and hence unusable.
| Quadrant | # 1 sec bins | Bins with >0 counts | Bins with >2000 counts | High rate bins dominated by noise | Noise dominated (total time) | Noise dominated (detector-on time) | Marked lightcurve |
|---|---|---|---|---|---|---|---|
| A | 19880 | 17845 | 0 | 0 | 0.00% | 0.00% | 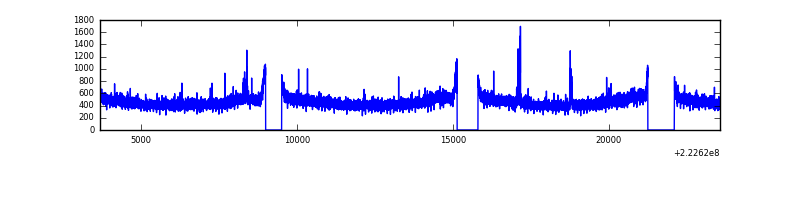 |
| B | 19880 | 17845 | 22 | 22 | 0.11% | 0.12% | 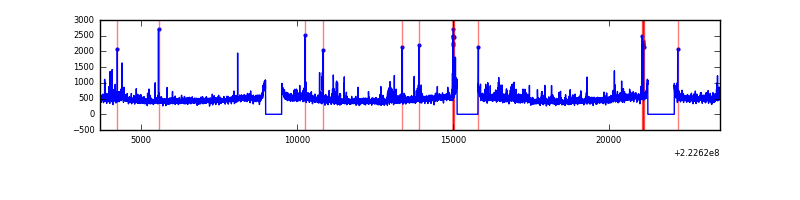 |
| C | 19880 | 17847 | 46 | 46 | 0.23% | 0.26% | 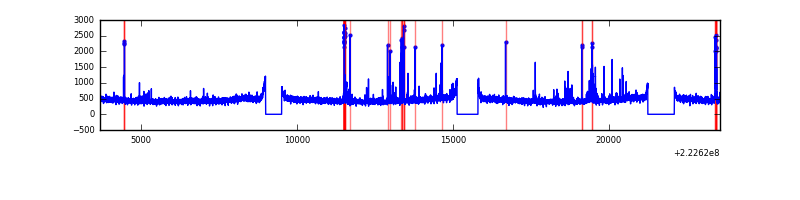 |
| D | 19880 | 17845 | 264 | 264 | 1.33% | 1.48% | 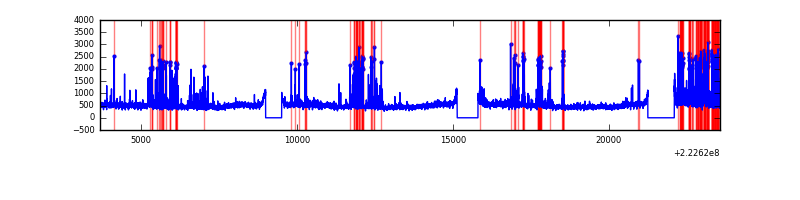 |
Top three noisy pixels from each quadrant. If the there are fewer than three noisy pixels in the level2.evt file, extra rows are filled as -1
| Pixel properties | Quadrant properties | ||||||
|---|---|---|---|---|---|---|---|
| Quadrant | DetID | PixID | Counts | Sigma | Mean | Median | Sigma |
| A | 14 | 111 | 61013 | 137.36 | 2105 | 2061 | 429.2 |
| A | 0 | 226 | 19945 | 41.67 | 2105 | 2061 | 429.2 |
| A | 13 | 14 | 19903 | 41.57 | 2105 | 2061 | 429.2 |
| B | 0 | 214 | 146066 | 358.75 | 2116 | 2071 | 401.4 |
| B | 4 | 81 | 113997 | 278.85 | 2116 | 2071 | 401.4 |
| B | 0 | 219 | 107324 | 262.23 | 2116 | 2071 | 401.4 |
| C | 4 | 254 | 289036 | 606.15 | 2050 | 2069 | 473.4 |
| C | 10 | 22 | 66227 | 135.52 | 2050 | 2069 | 473.4 |
| C | 13 | 61 | 16026 | 29.48 | 2050 | 2069 | 473.4 |
| D | 2 | 216 | 1355808 | 2705.8 | 2034 | 1974 | 500.3 |
| D | 8 | 195 | 923964 | 1842.71 | 2034 | 1974 | 500.3 |
| D | 7 | 55 | 144574 | 285.0 | 2034 | 1974 | 500.3 |
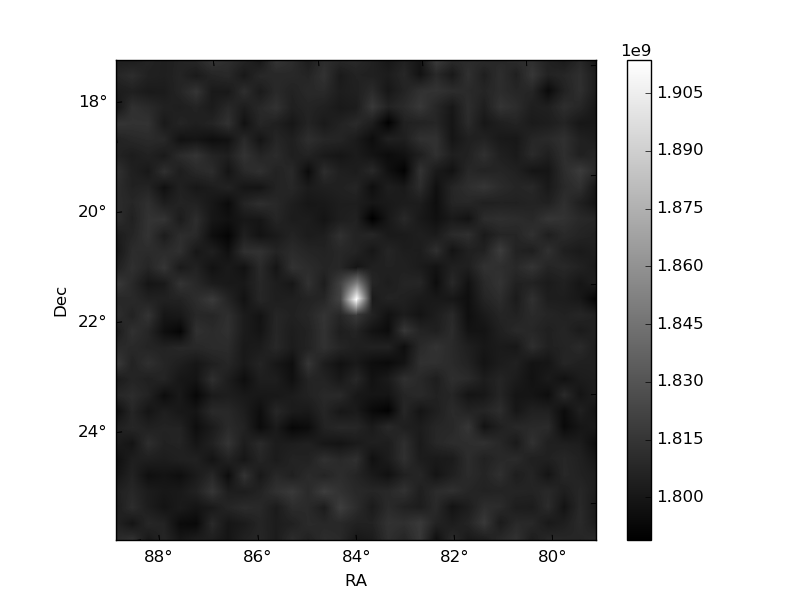
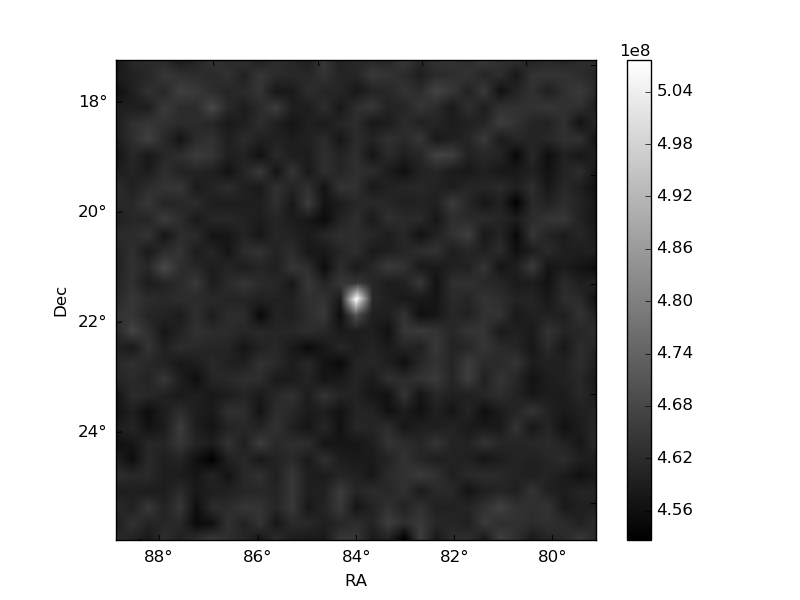
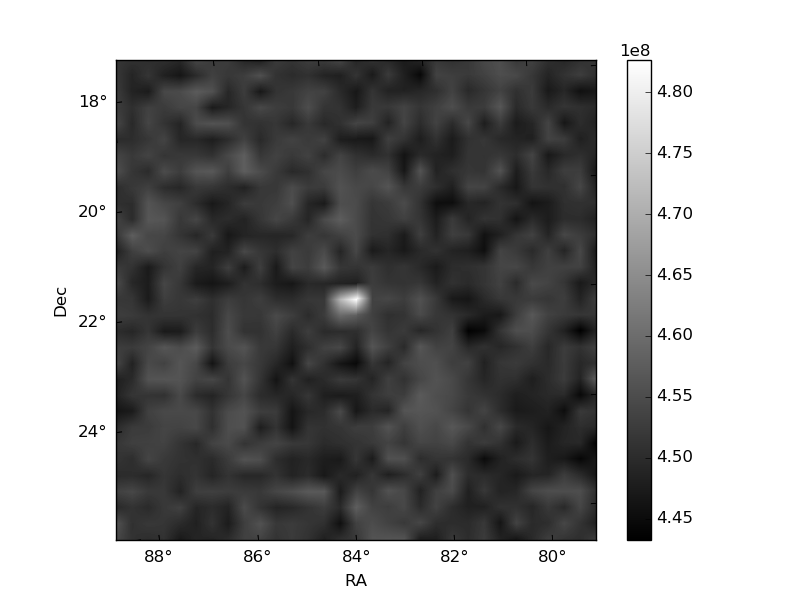
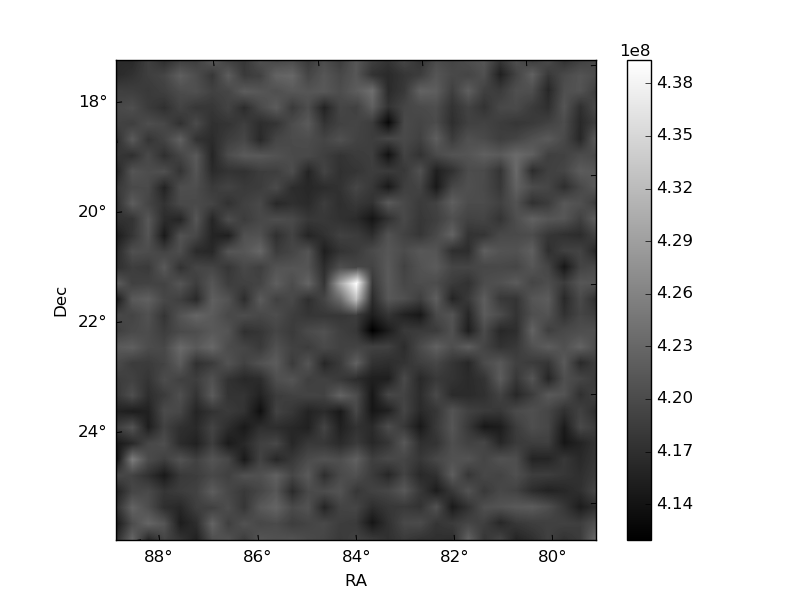
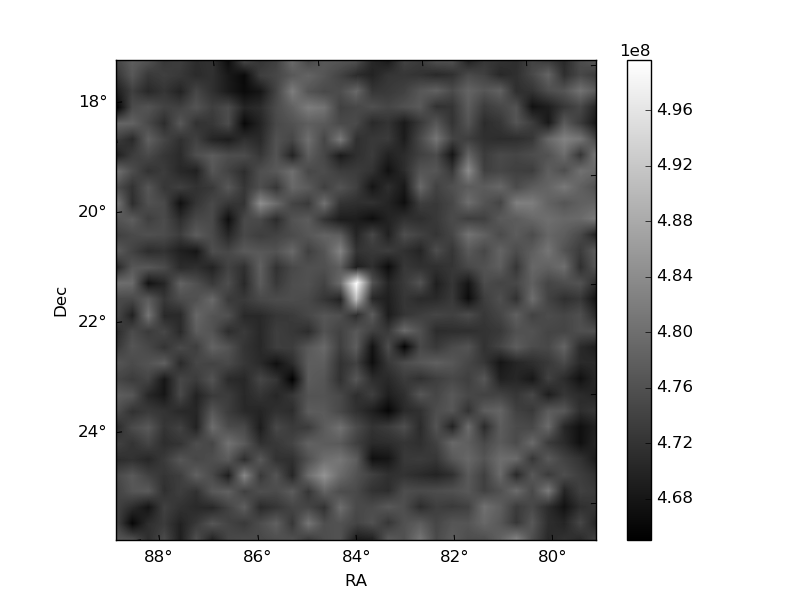
Histogram calculated using DETX and DETY for each event in the final _common_clean file
| Quadrant A | 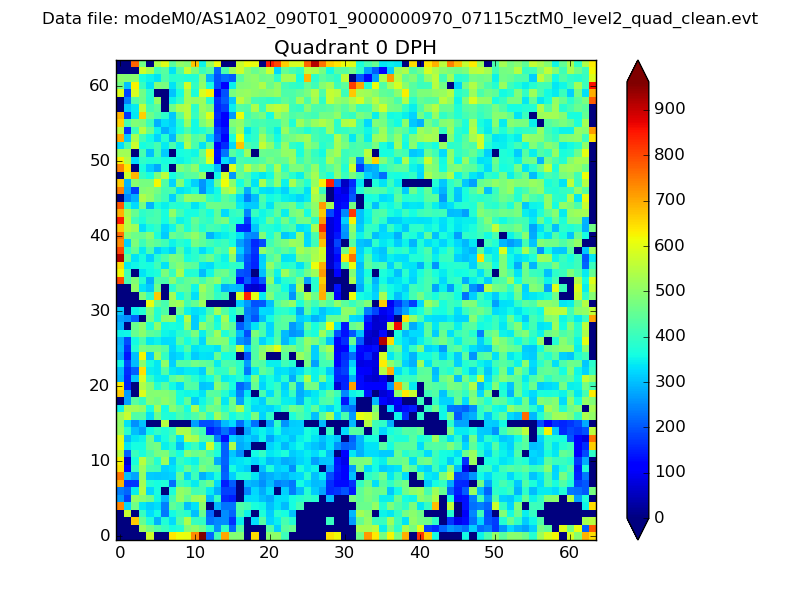 |
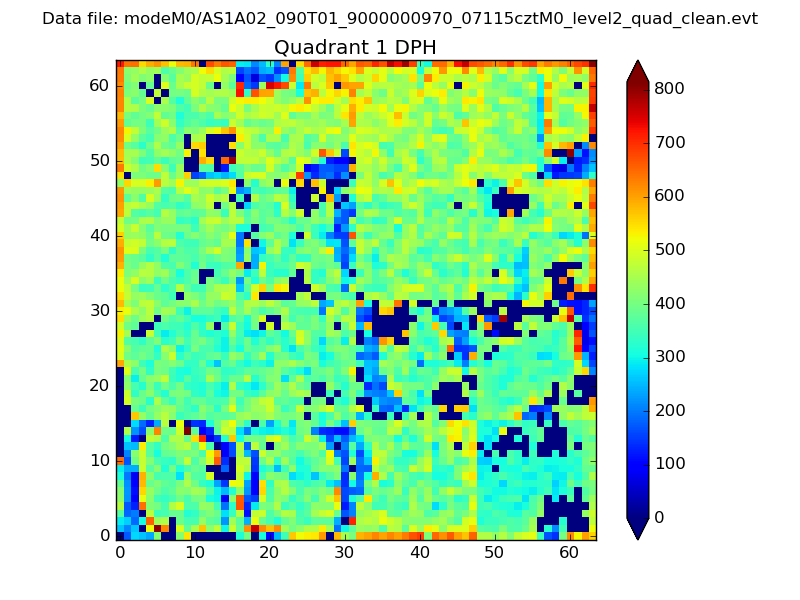 |
Quadrant B |
|---|---|---|---|
| Quadrant D | 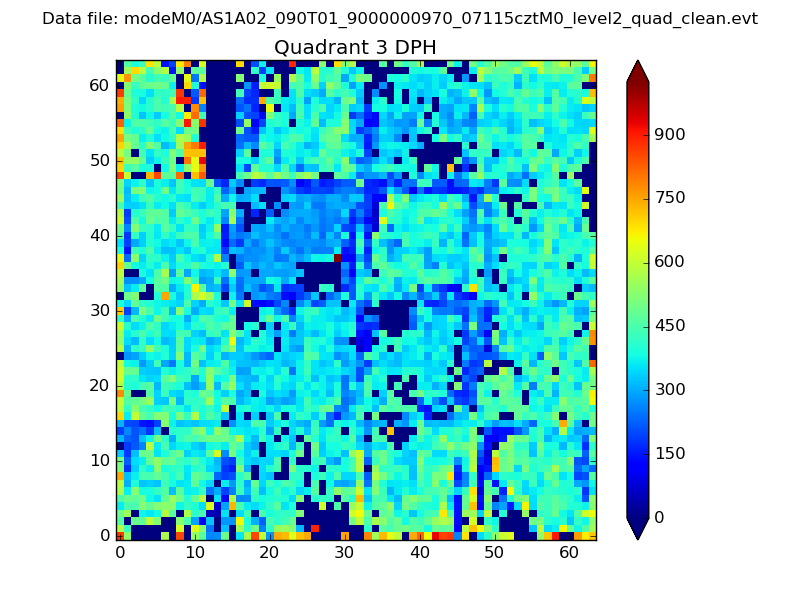 |
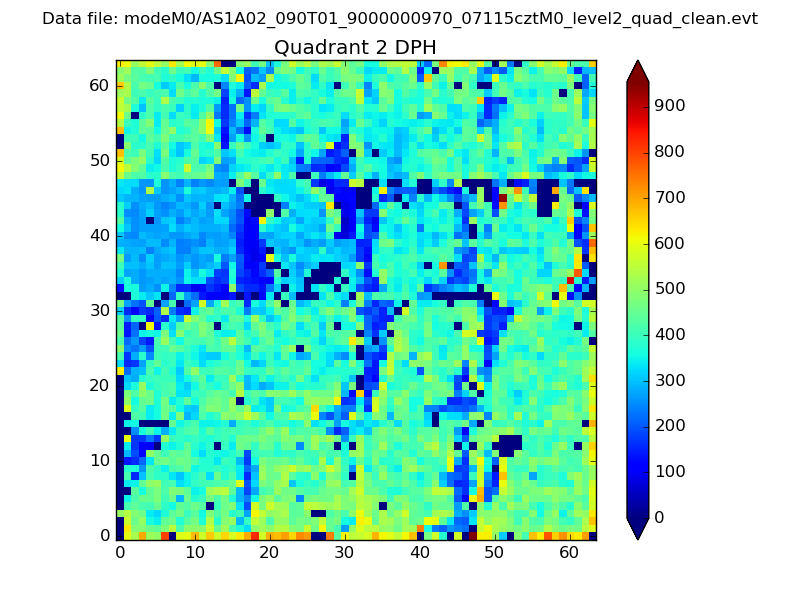 |
Quadrant C |
| Plot type | Count rate plots | Images |
|---|---|---|
| Comparison with Poisson distribution Blue bars denote a histogram of data divided into 1 sec bins. Red curve is a Poisson curve with rate = median count rate of data. |
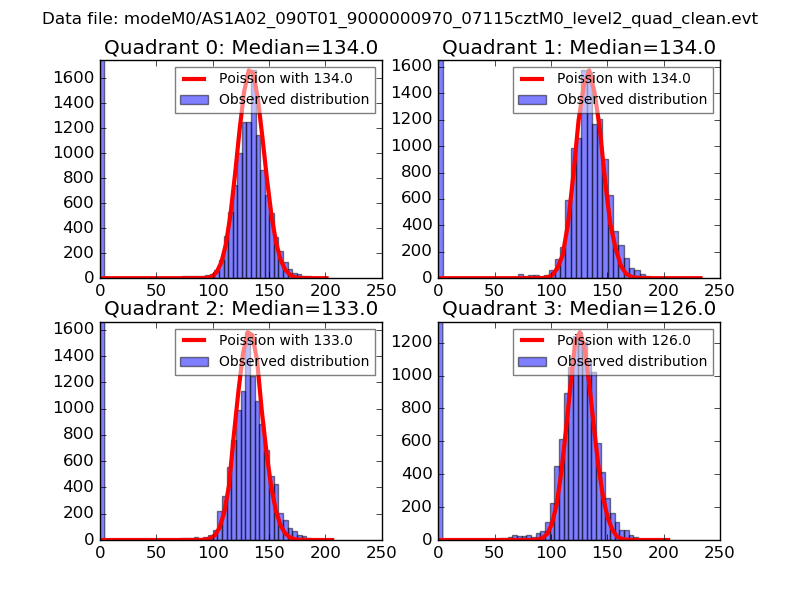 |
 |
| Quadrant-wise count rates Data is divided into 100 sec bins |
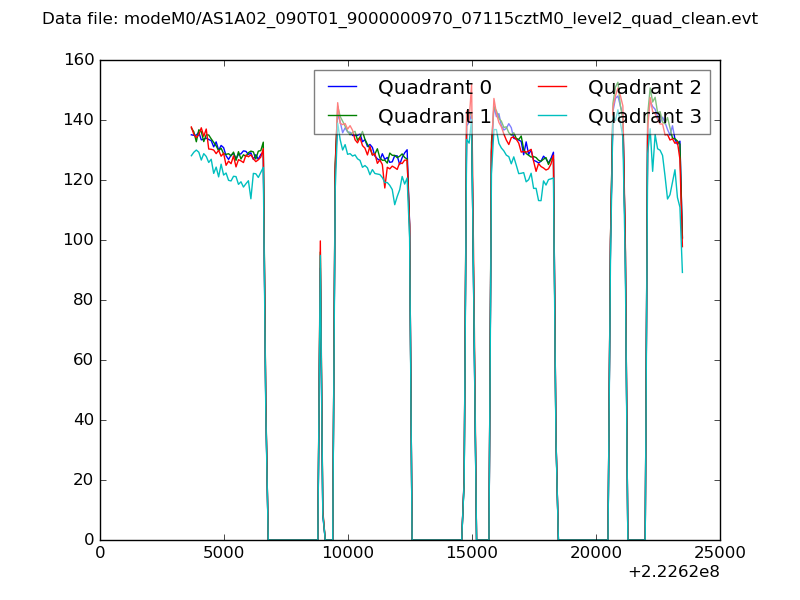 |
|
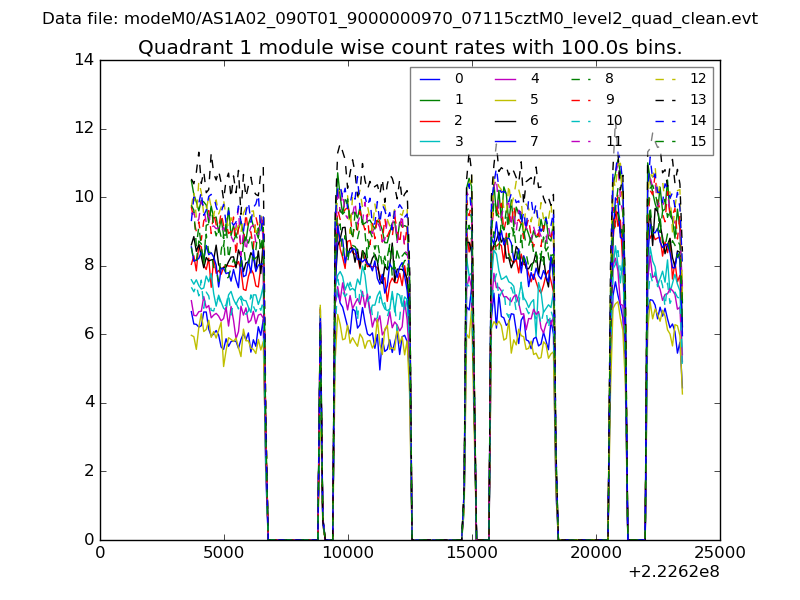
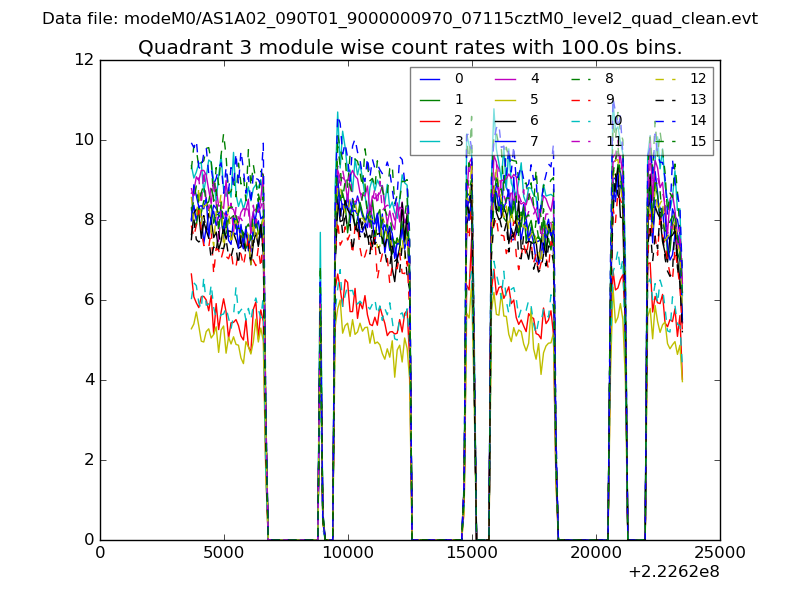
| Module-wise count rates for Quadrant A Data is divided into 100 sec bins |
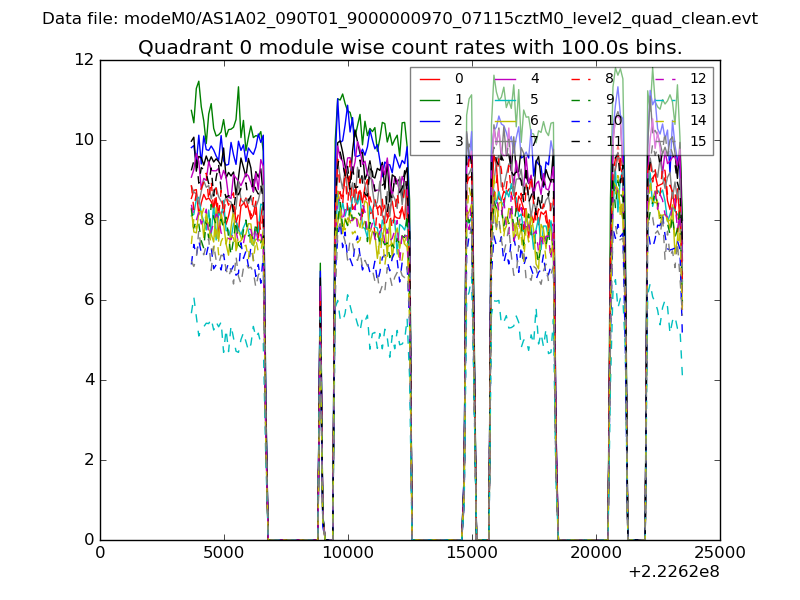 |
 |
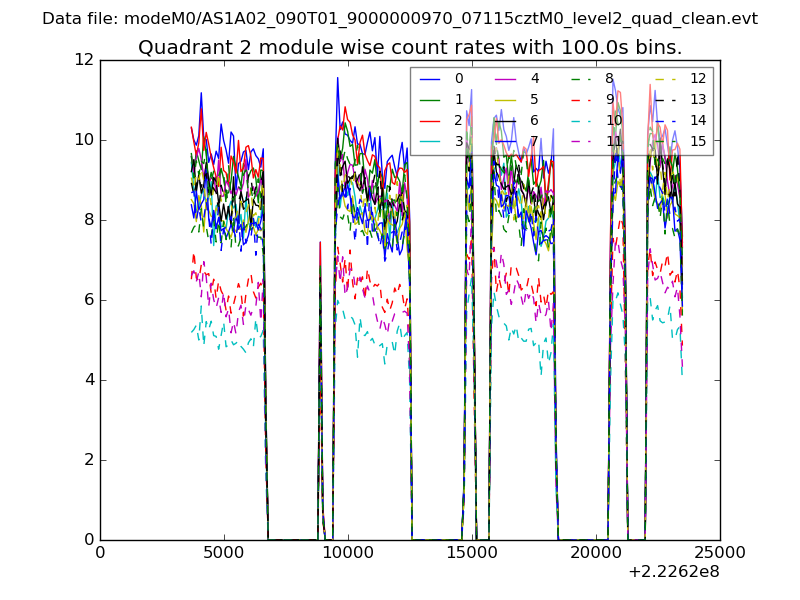
| Module-wise count rates for Quadrant B Data is divided into 100 sec bins |
 |
 |
| Module-wise count rates for Quadrant C Data is divided into 100 sec bins |
 |
 |
| Module-wise count rates for Quadrant D Data is divided into 100 sec bins |
 |
 |
| Parameter | Plot |
|---|---|
| CZT HV Monitor |  |
| D_VDD | 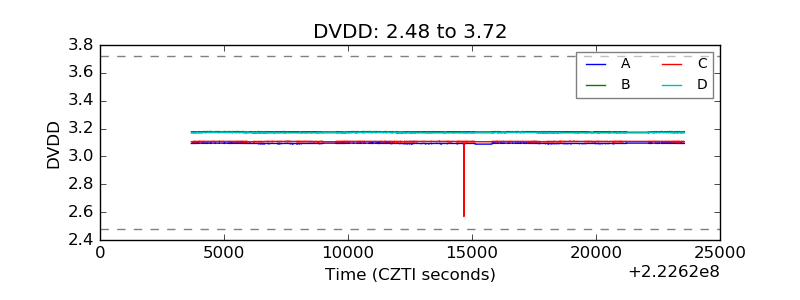 |
| Temperature 1 |  |
| Veto HV Monitor | 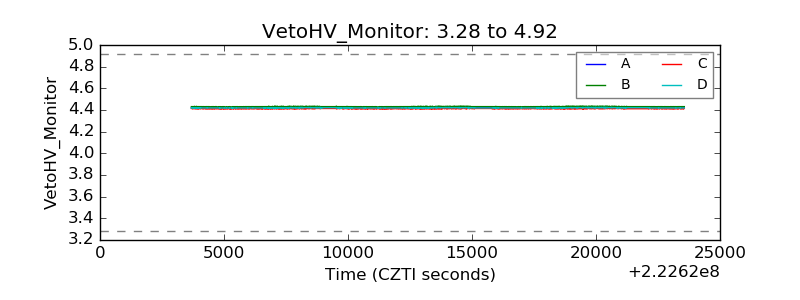 |
| Veto LLD | 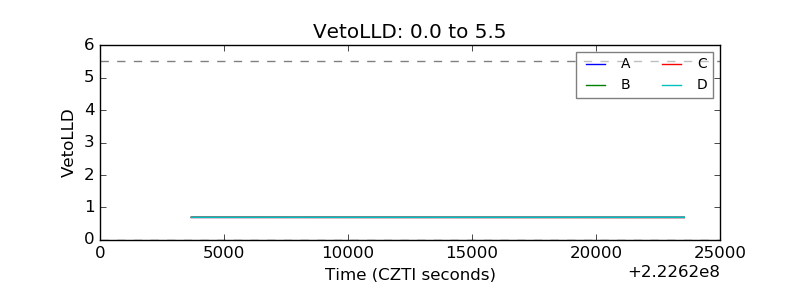 |
| Alpha Counter | 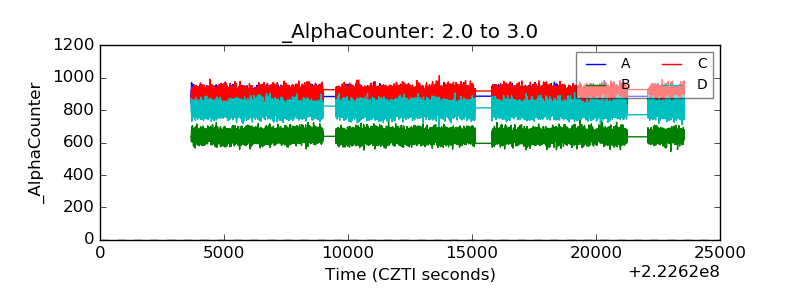 |
| _CPM_Rate | 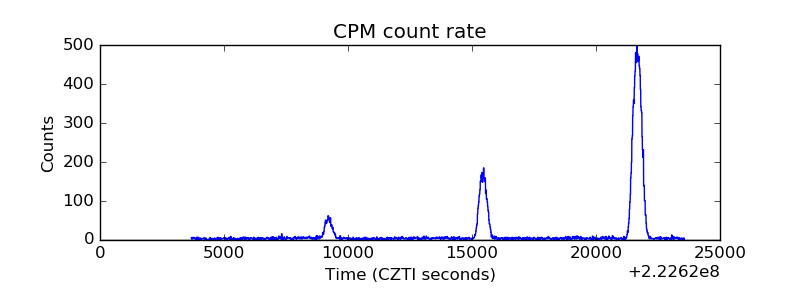 |
| CZT Counter | 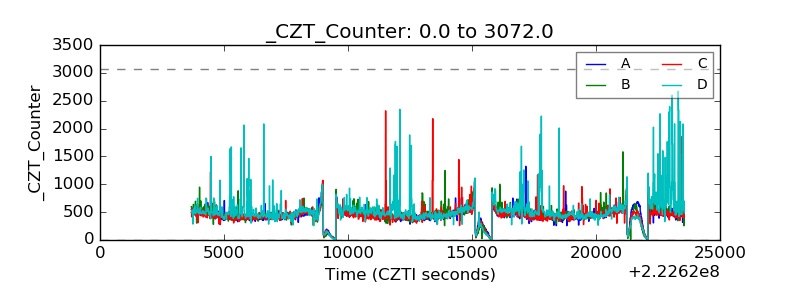 |
| +2.5 Volts monitor | 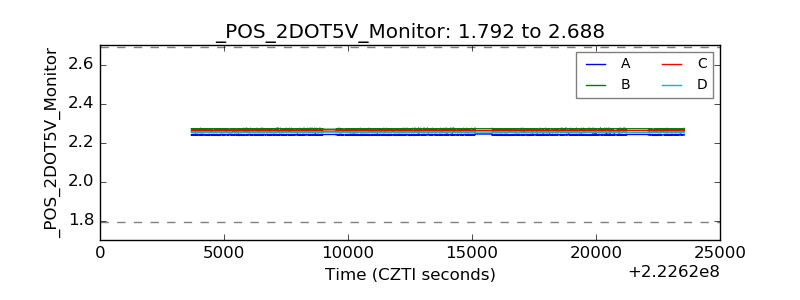 |
| +5 Volts monitor |  |
| _ROLL_ROT | 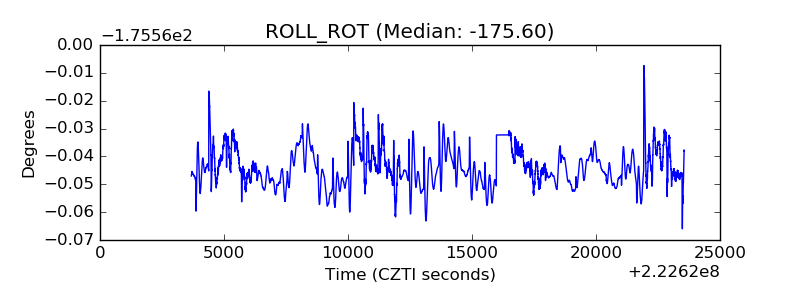 |
| _Roll_DEC | 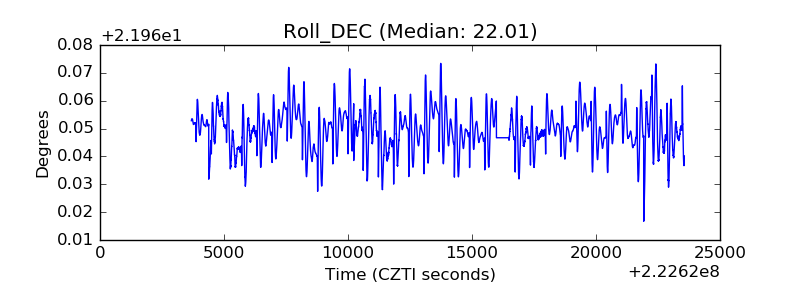 |
| _Roll_RA | 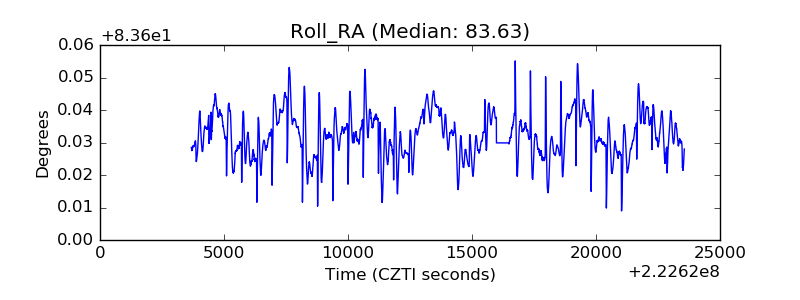 |
| Veto Counter | 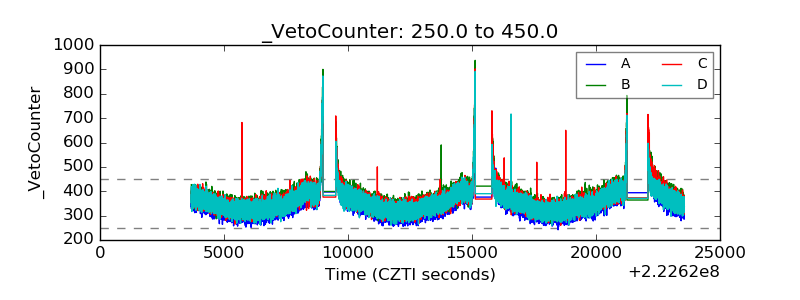 |