| Param | Original file | Final file |
|---|---|---|
| Filename | modeM0/AS1A02_090T01_9000000970_07116cztM0_level2.evt | modeM0/AS1A02_090T01_9000000970_07116cztM0_level2_quad_clean.evt |
| Size (bytes) | 489,810,240 | 97,398,720 |
| Size | 467.1 MB | 92.9 MB |
| Events in quadrant A | 3,114,791 | 634,911 |
| Events in quadrant B | 3,514,946 | 640,805 |
| Events in quadrant C | 3,162,728 | 627,883 |
| Events in quadrant D | 4,584,756 | 577,086 |
| Mode M0 | |||
|---|---|---|---|
| Quadrant | BADHDUFLAG | Total packets | Discarded packets |
| A | 0 | 13822 | 2 |
| B | 0 | 14875 | 1 |
| C | 0 | 13915 | 1 |
| D | 0 | 18194 | 1 |
| Mode M9 | |||
|---|---|---|---|
| Quadrant | BADHDUFLAG | Total packets | Discarded packets |
| A | 0 | 10 | 0 |
| B | 0 | 10 | 0 |
| C | 0 | 10 | 0 |
| D | 0 | 11 | 0 |
| Mode SS | |||
|---|---|---|---|
| Quadrant | BADHDUFLAG | Total packets | Discarded packets |
| A | 0 | 136 | 0 |
| B | 0 | 136 | 0 |
| C | 0 | 136 | 0 |
| D | 0 | 136 | 0 |
| Quadrant | Total seconds | Saturated seconds | Saturation percentage |
|---|---|---|---|
| A | 6727 | 28 | 0.416233% |
| B | 6727 | 89 | 1.323027% |
| C | 6727 | 22 | 0.327040% |
| D | 6727 | 330 | 4.905604% |
Noise dominated data is calculated using 1-second bins in cleaned event files. If a bin has >2000 counts, and if more than 50% of those come from <1% of pixels, then it is considered to be noise-dominated and hence unusable.
| Quadrant | # 1 sec bins | Bins with >0 counts | Bins with >2000 counts | High rate bins dominated by noise | Noise dominated (total time) | Noise dominated (detector-on time) | Marked lightcurve |
|---|---|---|---|---|---|---|---|
| A | 7732 | 6728 | 0 | 0 | 0.00% | 0.00% | 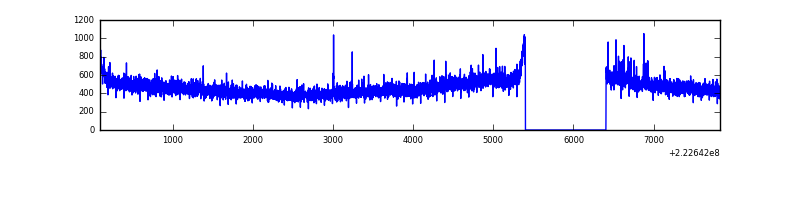 |
| B | 7732 | 6727 | 48 | 48 | 0.62% | 0.71% | 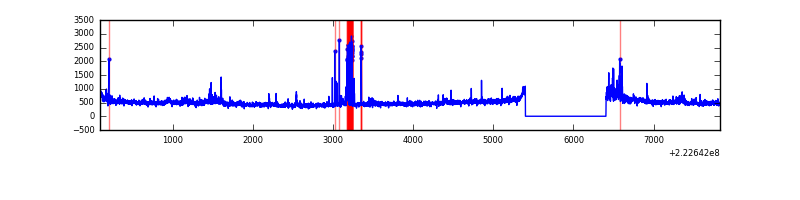 |
| C | 7732 | 6727 | 11 | 11 | 0.14% | 0.16% | 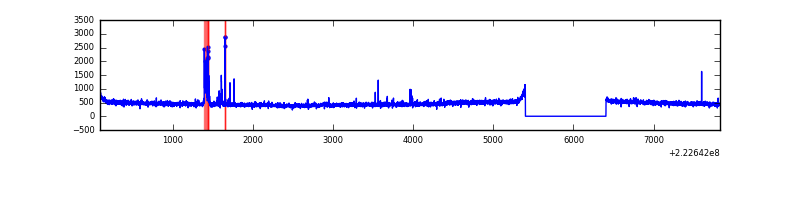 |
| D | 7732 | 6728 | 278 | 278 | 3.60% | 4.13% | 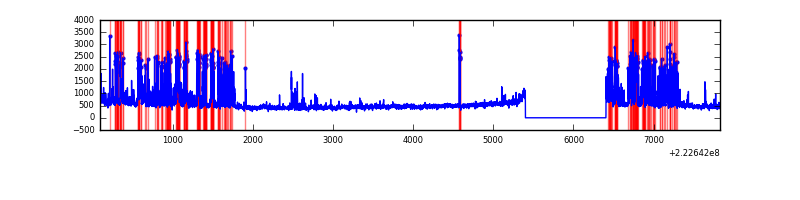 |
Top three noisy pixels from each quadrant. If the there are fewer than three noisy pixels in the level2.evt file, extra rows are filled as -1
| Pixel properties | Quadrant properties | ||||||
|---|---|---|---|---|---|---|---|
| Quadrant | DetID | PixID | Counts | Sigma | Mean | Median | Sigma |
| A | 8 | 15 | 23404 | 137.72 | 800 | 783 | 164.2 |
| A | 0 | 226 | 7600 | 41.5 | 800 | 783 | 164.2 |
| A | 12 | 194 | 7273 | 39.51 | 800 | 783 | 164.2 |
| B | 0 | 219 | 178331 | 1150.56 | 804 | 787 | 154.3 |
| B | 3 | 220 | 147931 | 953.56 | 804 | 787 | 154.3 |
| B | 0 | 214 | 26062 | 163.79 | 804 | 787 | 154.3 |
| C | 4 | 254 | 98077 | 531.46 | 780 | 787 | 183.1 |
| C | 9 | 68 | 9086 | 45.33 | 780 | 787 | 183.1 |
| C | 13 | 61 | 6046 | 28.73 | 780 | 787 | 183.1 |
| D | 2 | 216 | 1173638 | 6189.61 | 763 | 741 | 189.5 |
| D | 8 | 195 | 269108 | 1416.22 | 763 | 741 | 189.5 |
| D | 7 | 55 | 99663 | 522.03 | 763 | 741 | 189.5 |
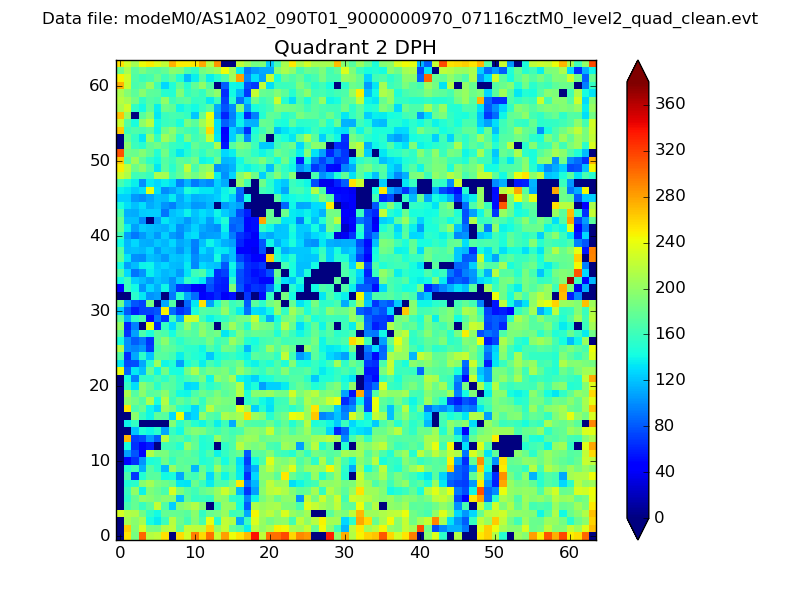
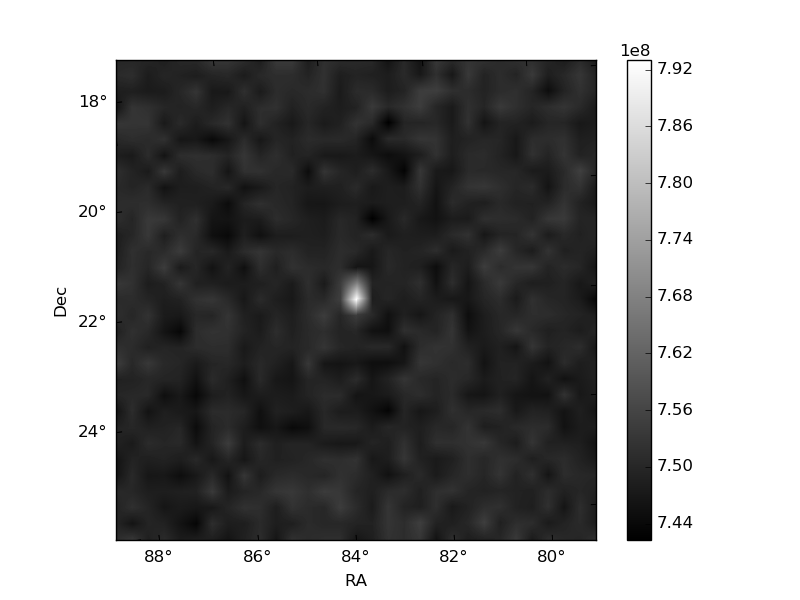
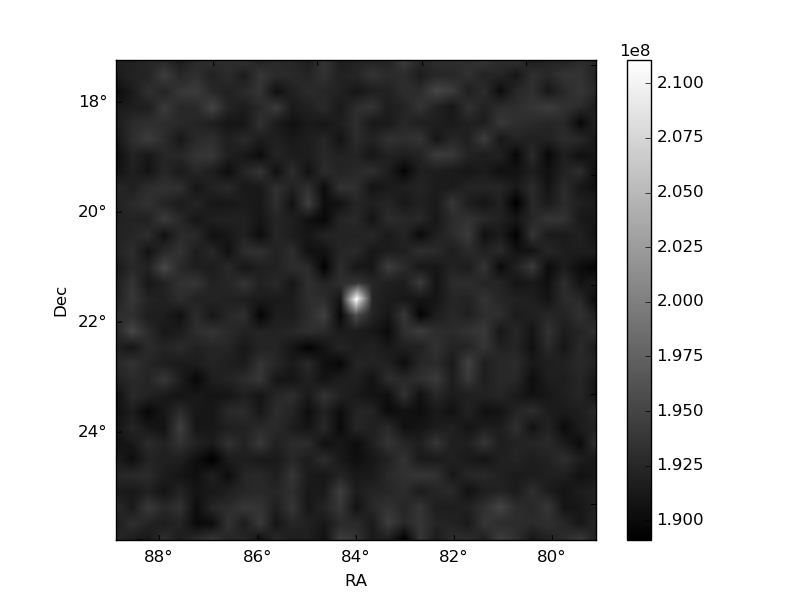
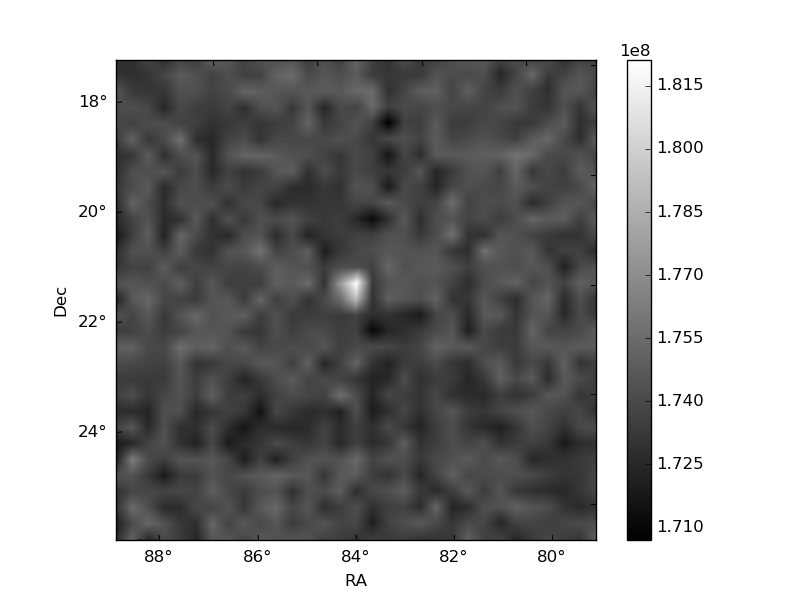
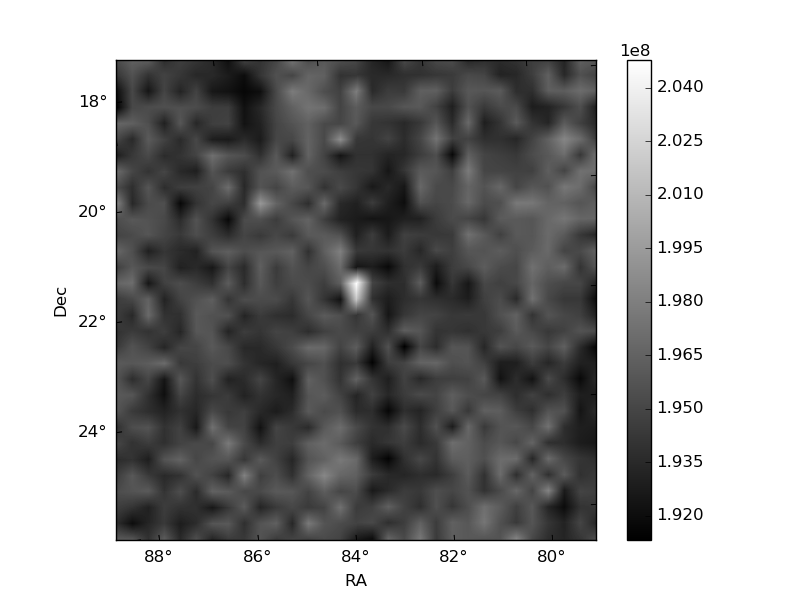
Histogram calculated using DETX and DETY for each event in the final _common_clean file
| Quadrant A | 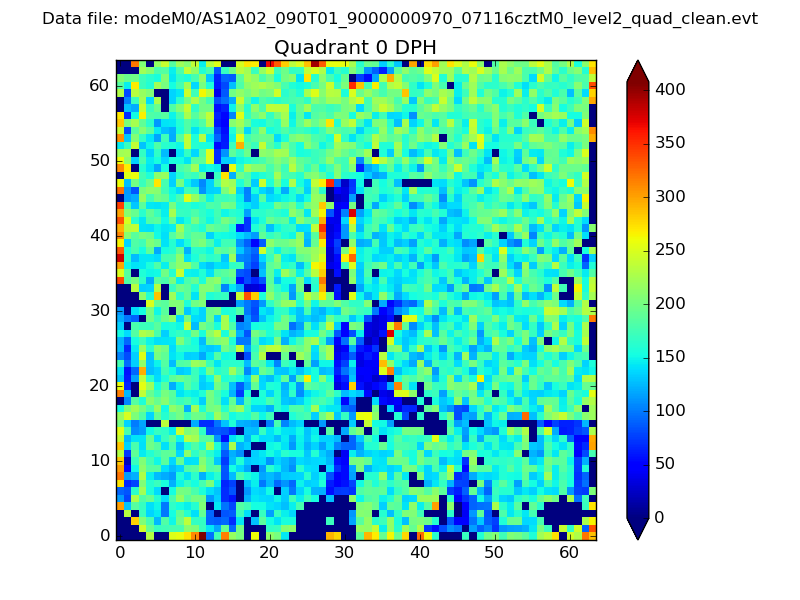 |
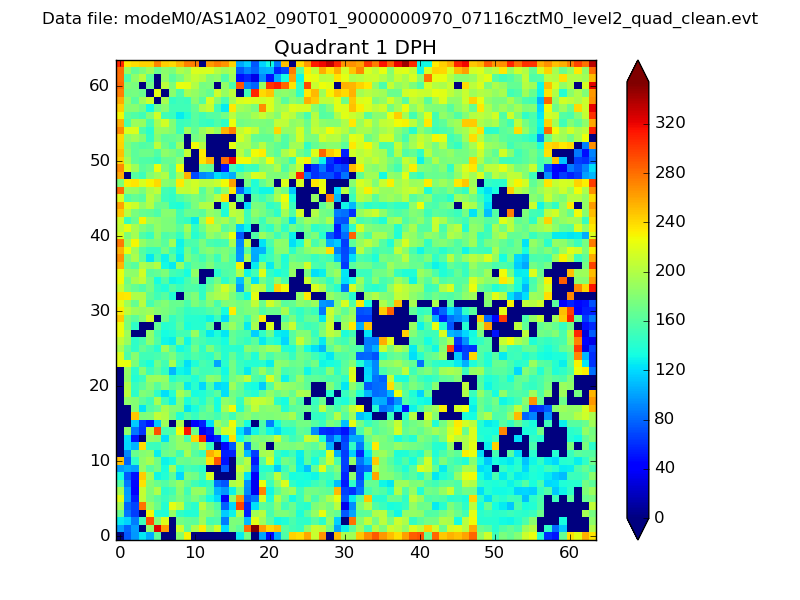 |
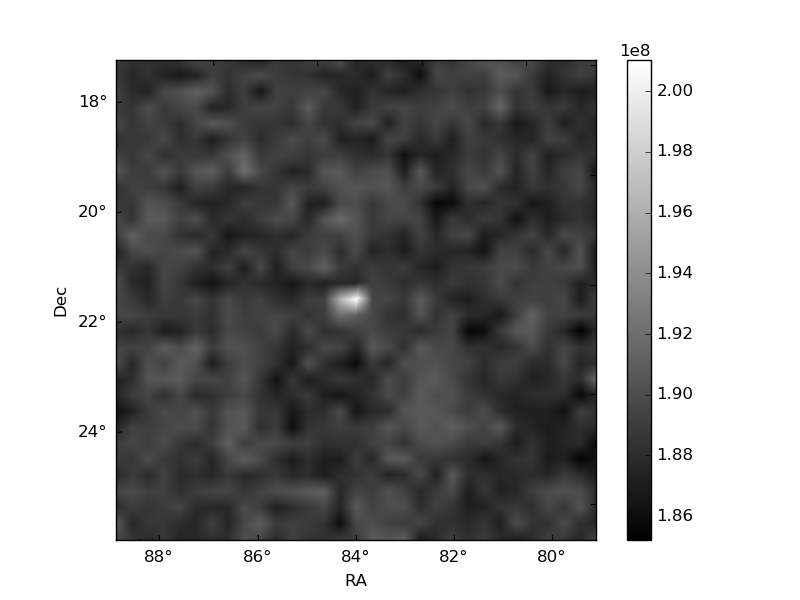
Quadrant B |
|---|---|---|---|
| Quadrant D | 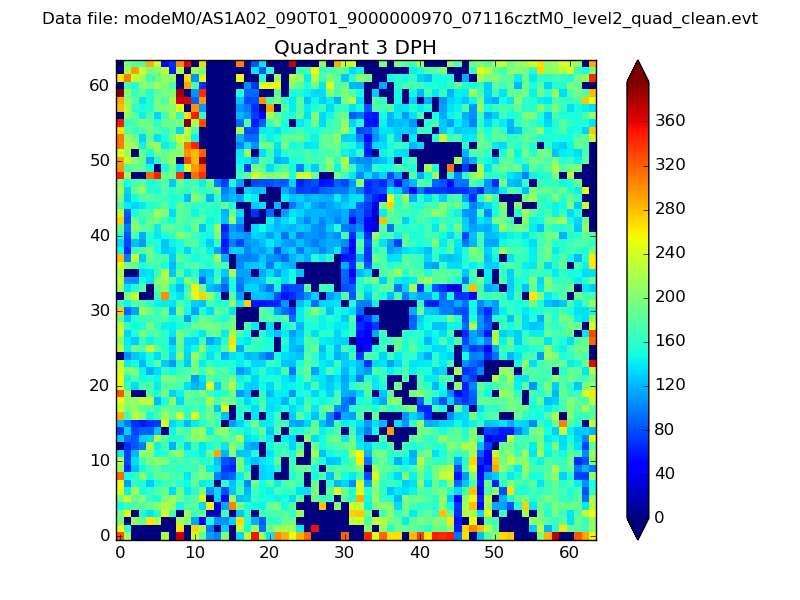 |
 |
Quadrant C |
| Plot type | Count rate plots | Images |
|---|---|---|
| Comparison with Poisson distribution Blue bars denote a histogram of data divided into 1 sec bins. Red curve is a Poisson curve with rate = median count rate of data. |
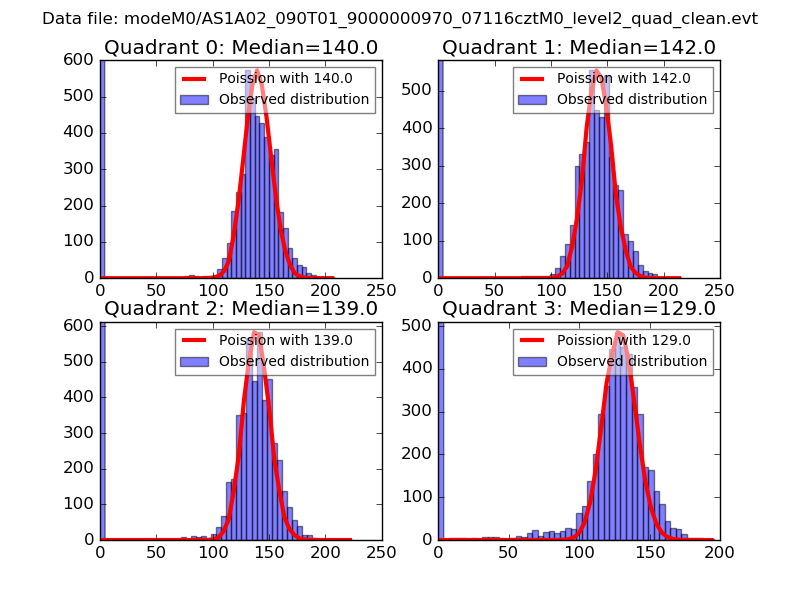 |
 |
| Quadrant-wise count rates Data is divided into 100 sec bins |
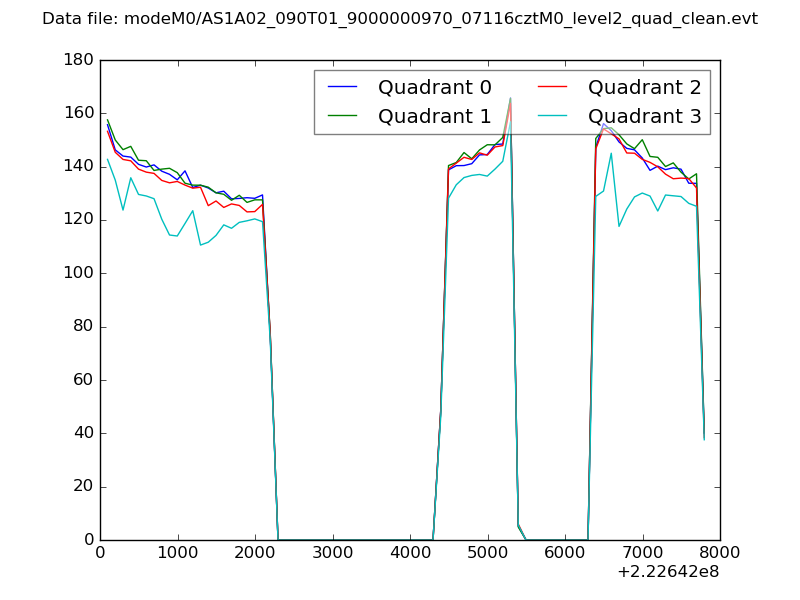 |
|
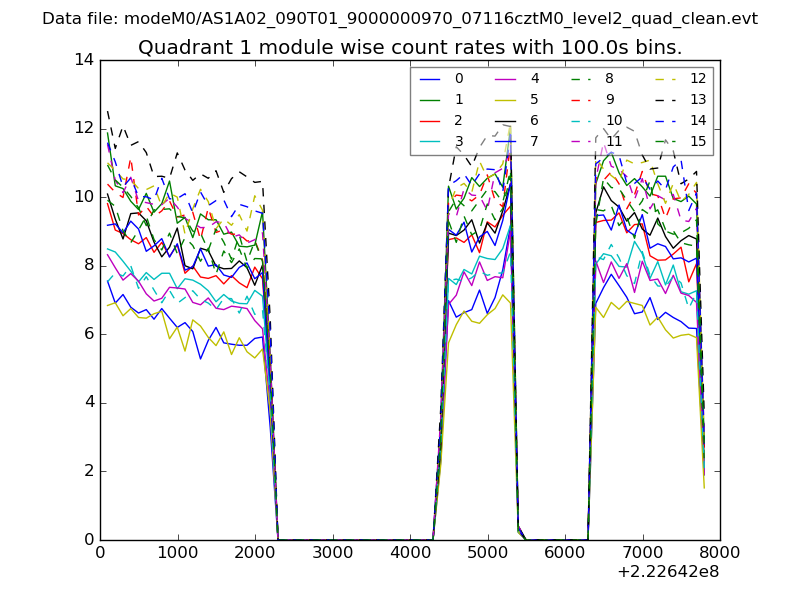
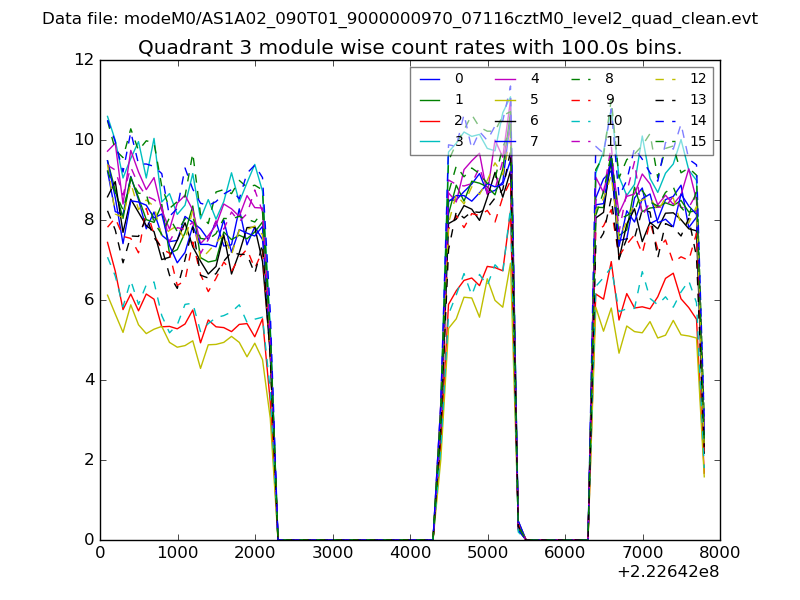
| Module-wise count rates for Quadrant A Data is divided into 100 sec bins |
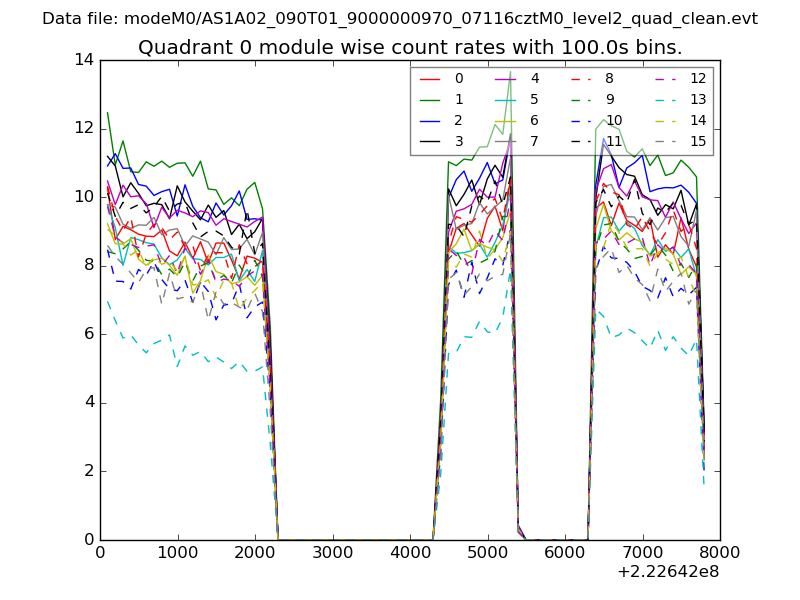 |
 |
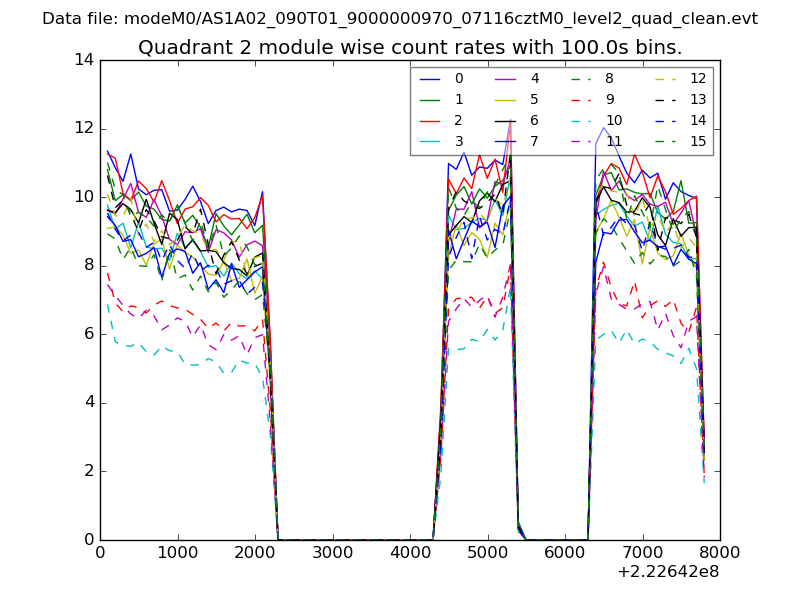
| Module-wise count rates for Quadrant B Data is divided into 100 sec bins |
 |
 |
| Module-wise count rates for Quadrant C Data is divided into 100 sec bins |
 |
 |
| Module-wise count rates for Quadrant D Data is divided into 100 sec bins |
 |
 |
| Parameter | Plot |
|---|---|
| CZT HV Monitor | 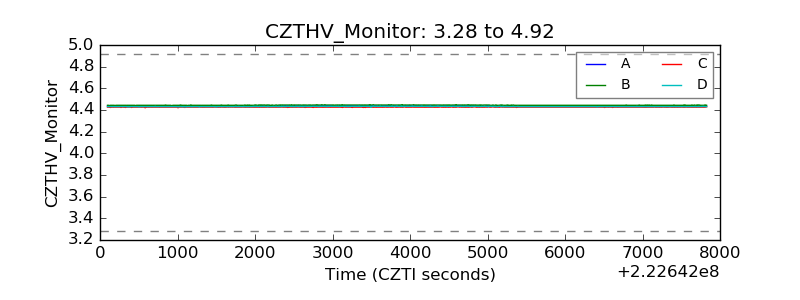 |
| D_VDD | 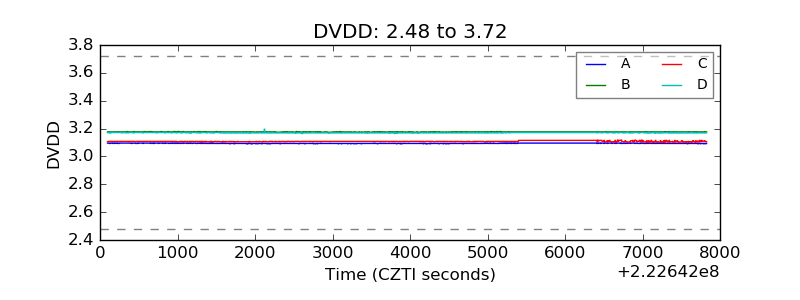 |
| Temperature 1 | 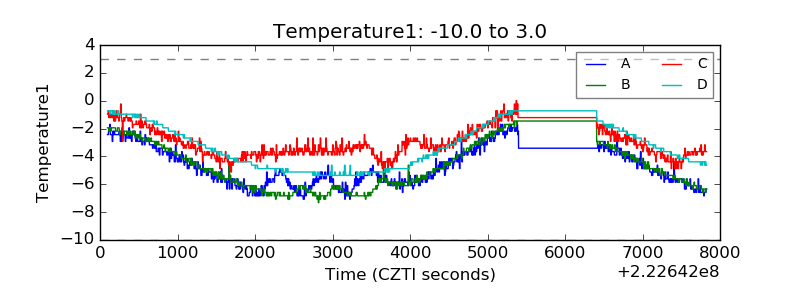 |
| Veto HV Monitor | 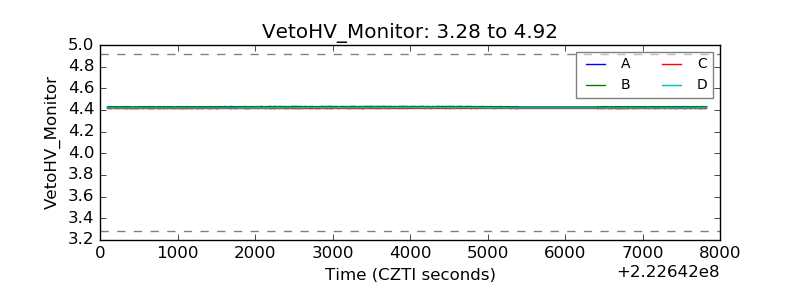 |
| Veto LLD | 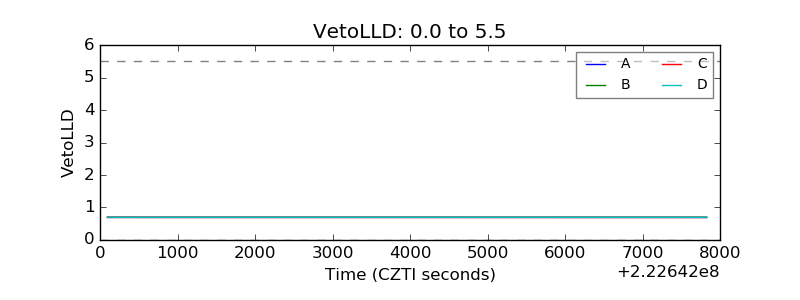 |
| Alpha Counter | 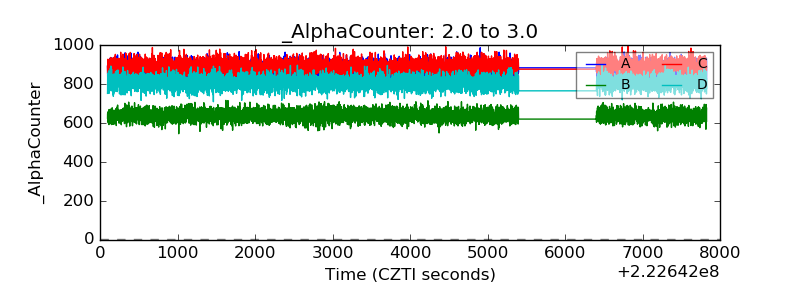 |
| _CPM_Rate | 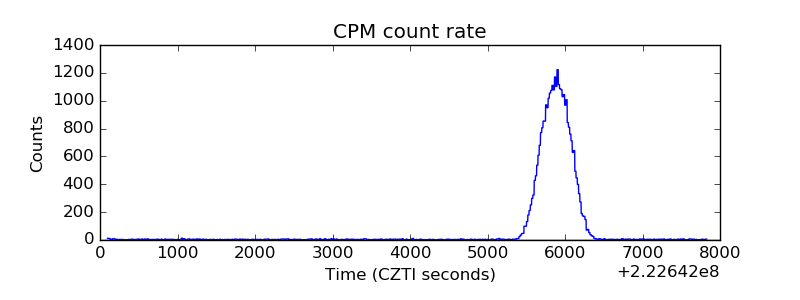 |
| CZT Counter | 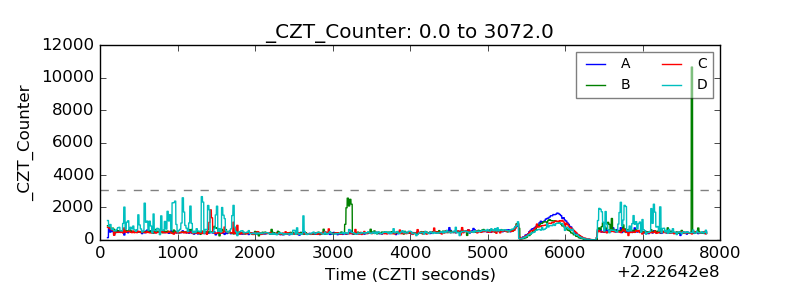 |
| +2.5 Volts monitor | 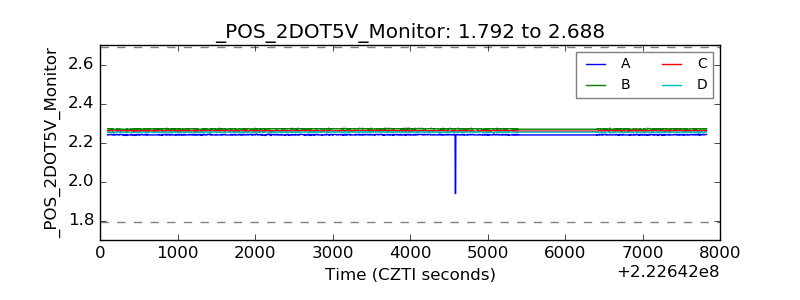 |
| +5 Volts monitor |  |
| _ROLL_ROT | 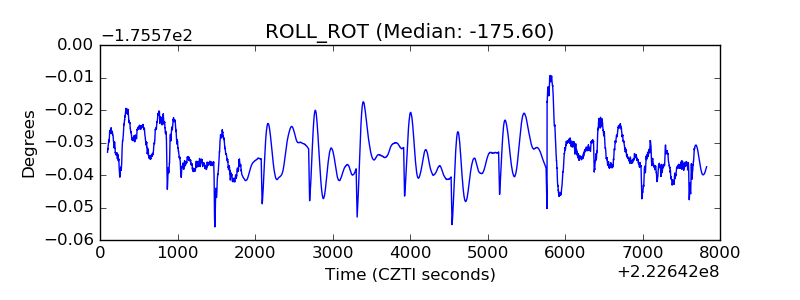 |
| _Roll_DEC | 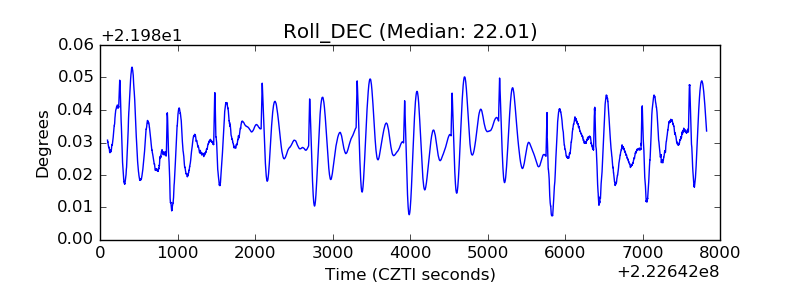 |
| _Roll_RA | 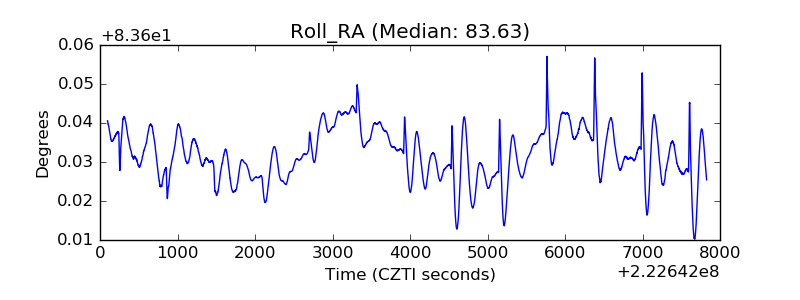 |
| Veto Counter | 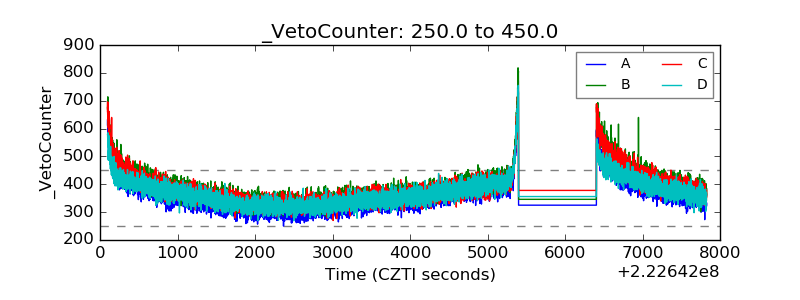 |