| Param | Original file | Final file |
|---|---|---|
| Filename | modeM0/AS1A02_090T01_9000000970_07120cztM0_level2.evt | modeM0/AS1A02_090T01_9000000970_07120cztM0_level2_quad_clean.evt |
| Size (bytes) | 482,120,640 | 79,441,920 |
| Size | 459.8 MB | 75.8 MB |
| Events in quadrant A | 3,197,859 | 499,567 |
| Events in quadrant B | 3,449,479 | 512,131 |
| Events in quadrant C | 3,334,370 | 493,793 |
| Events in quadrant D | 4,184,285 | 452,819 |
| Mode M0 | |||
|---|---|---|---|
| Quadrant | BADHDUFLAG | Total packets | Discarded packets |
| A | 0 | 13522 | 3 |
| B | 0 | 14209 | 2 |
| C | 0 | 13955 | 2 |
| D | 0 | 16506 | 2 |
| Mode M9 | |||
|---|---|---|---|
| Quadrant | BADHDUFLAG | Total packets | Discarded packets |
| A | 0 | 14 | 0 |
| B | 0 | 14 | 0 |
| C | 0 | 14 | 0 |
| D | 0 | 15 | 0 |
| Mode SS | |||
|---|---|---|---|
| Quadrant | BADHDUFLAG | Total packets | Discarded packets |
| A | 0 | 130 | 0 |
| B | 0 | 130 | 0 |
| C | 0 | 130 | 0 |
| D | 0 | 130 | 0 |
| Quadrant | Total seconds | Saturated seconds | Saturation percentage |
|---|---|---|---|
| A | 6408 | 20 | 0.312110% |
| B | 6408 | 72 | 1.123596% |
| C | 6408 | 56 | 0.873908% |
| D | 6408 | 235 | 3.667291% |
Noise dominated data is calculated using 1-second bins in cleaned event files. If a bin has >2000 counts, and if more than 50% of those come from <1% of pixels, then it is considered to be noise-dominated and hence unusable.
| Quadrant | # 1 sec bins | Bins with >0 counts | Bins with >2000 counts | High rate bins dominated by noise | Noise dominated (total time) | Noise dominated (detector-on time) | Marked lightcurve |
|---|---|---|---|---|---|---|---|
| A | 7698 | 6409 | 1 | 1 | 0.01% | 0.02% | 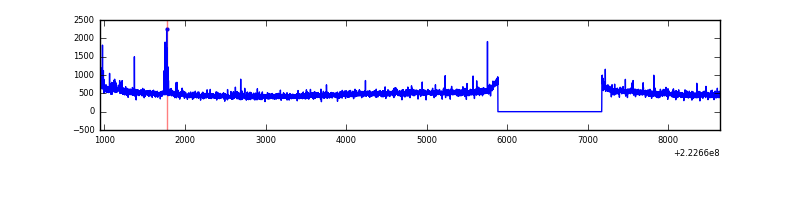 |
| B | 7698 | 6409 | 16 | 16 | 0.21% | 0.25% | 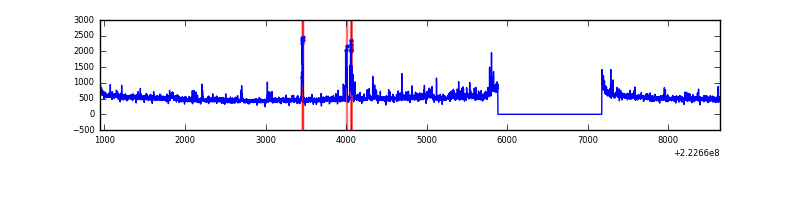 |
| C | 7698 | 6408 | 36 | 36 | 0.47% | 0.56% | 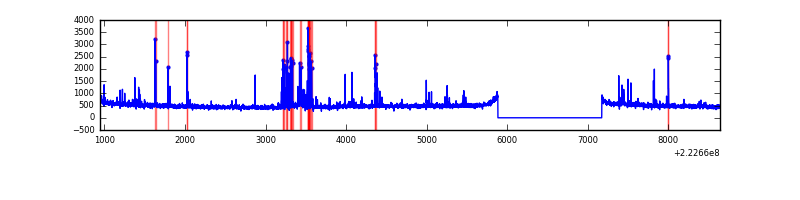 |
| D | 7698 | 6409 | 179 | 179 | 2.33% | 2.79% | 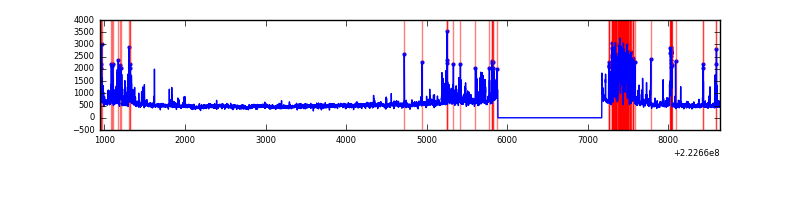 |
Top three noisy pixels from each quadrant. If the there are fewer than three noisy pixels in the level2.evt file, extra rows are filled as -1
| Pixel properties | Quadrant properties | ||||||
|---|---|---|---|---|---|---|---|
| Quadrant | DetID | PixID | Counts | Sigma | Mean | Median | Sigma |
| A | 14 | 238 | 61846 | 373.88 | 803 | 790 | 163.3 |
| A | 8 | 15 | 37925 | 227.4 | 803 | 790 | 163.3 |
| A | 0 | 226 | 7721 | 42.44 | 803 | 790 | 163.3 |
| B | 3 | 220 | 140788 | 913.16 | 820 | 804 | 153.3 |
| B | 0 | 214 | 65105 | 419.45 | 820 | 804 | 153.3 |
| B | 4 | 81 | 27254 | 172.54 | 820 | 804 | 153.3 |
| C | 4 | 254 | 268380 | 1477.82 | 783 | 790 | 181.1 |
| C | 10 | 22 | 6933 | 33.93 | 783 | 790 | 181.1 |
| C | 13 | 61 | 6253 | 30.17 | 783 | 790 | 181.1 |
| D | 8 | 195 | 377871 | 1997.94 | 766 | 742 | 188.8 |
| D | 12 | 233 | 336282 | 1777.61 | 766 | 742 | 188.8 |
| D | 2 | 216 | 329985 | 1744.25 | 766 | 742 | 188.8 |
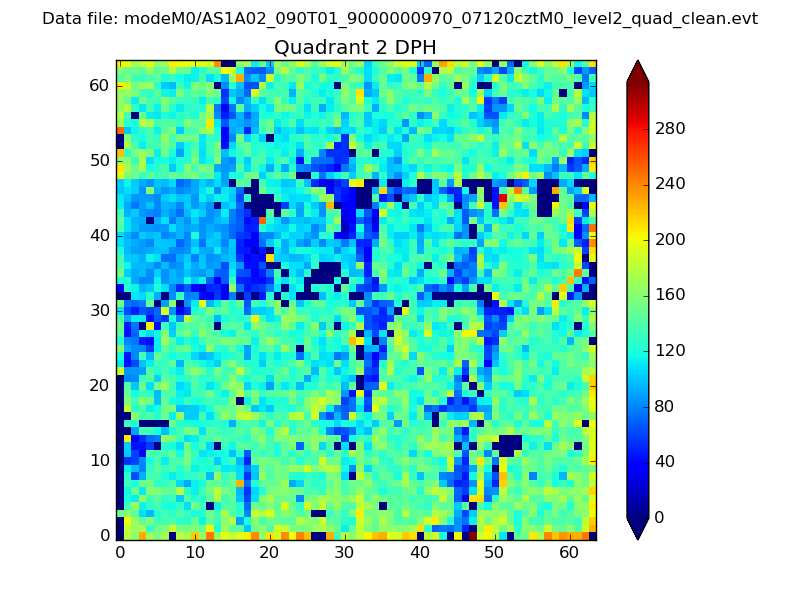
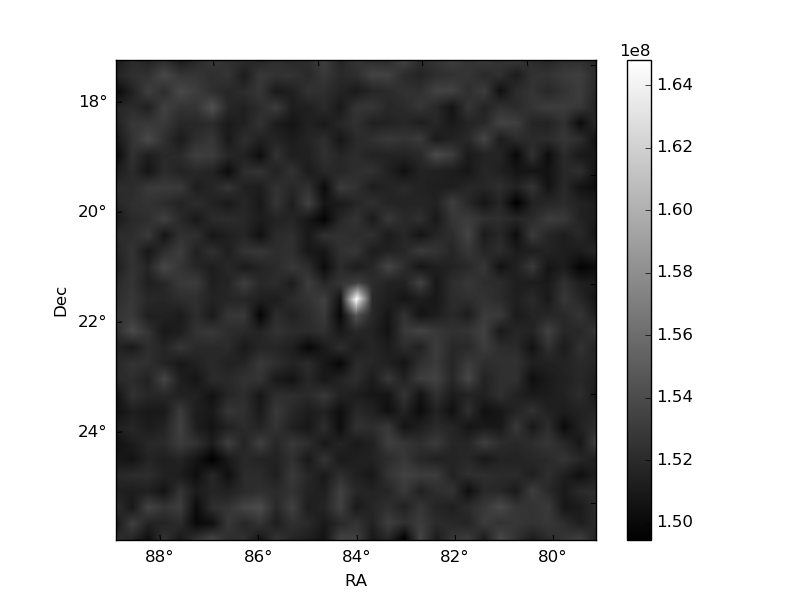
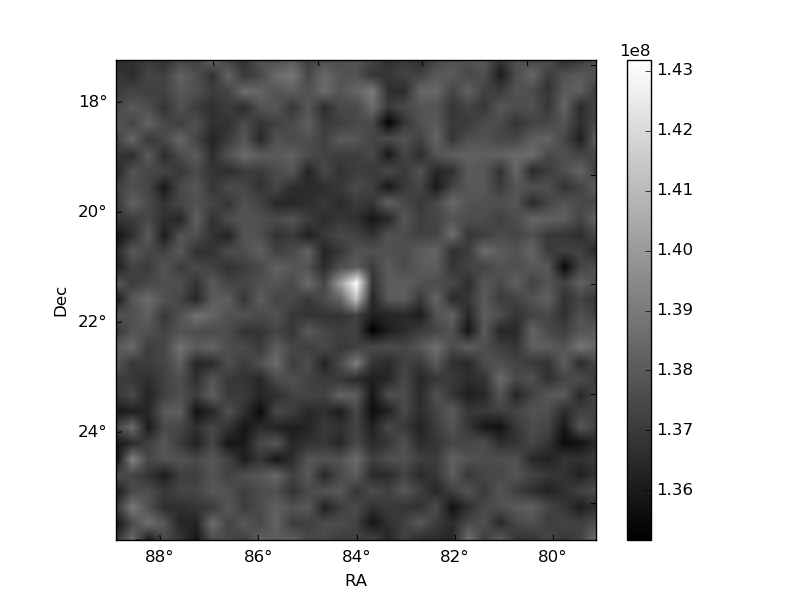
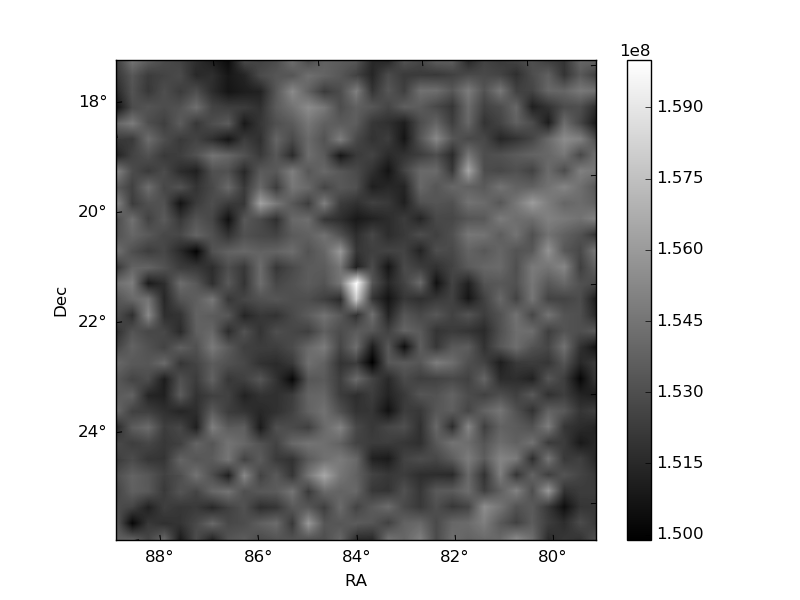
Histogram calculated using DETX and DETY for each event in the final _common_clean file
| Quadrant A | 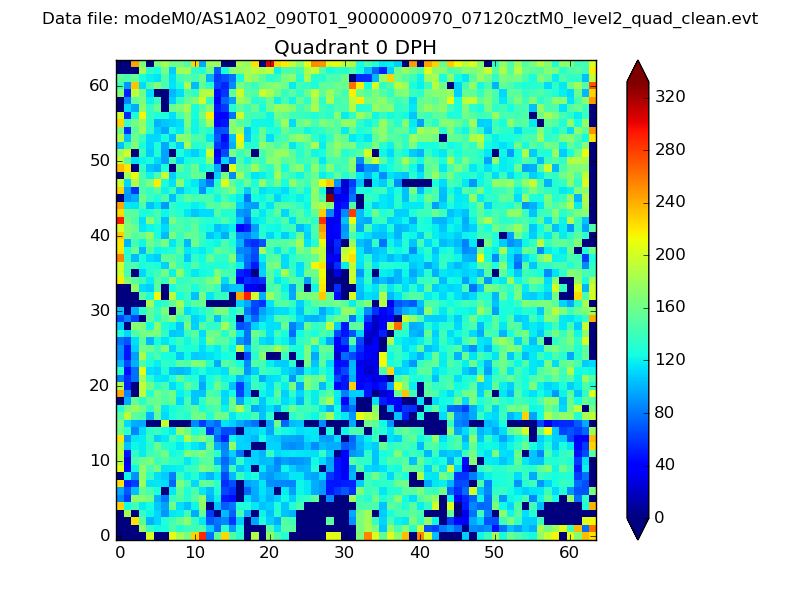 |
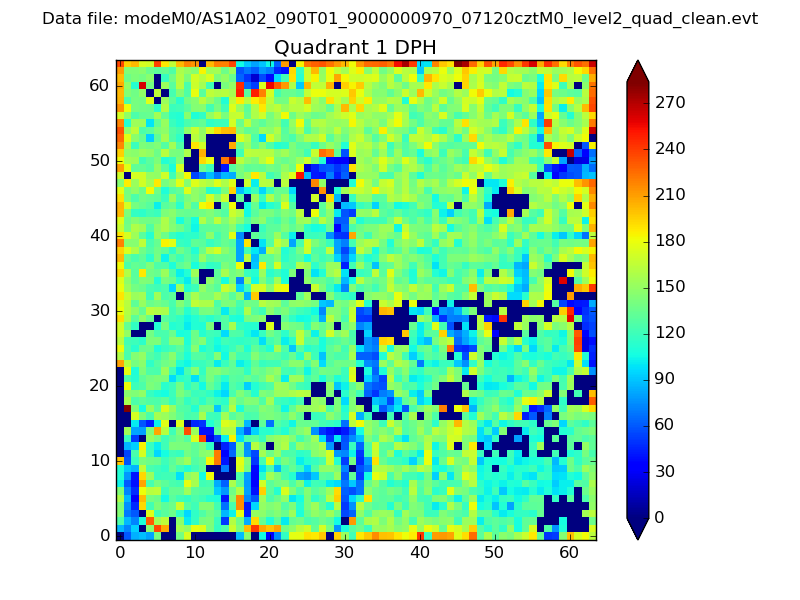 |
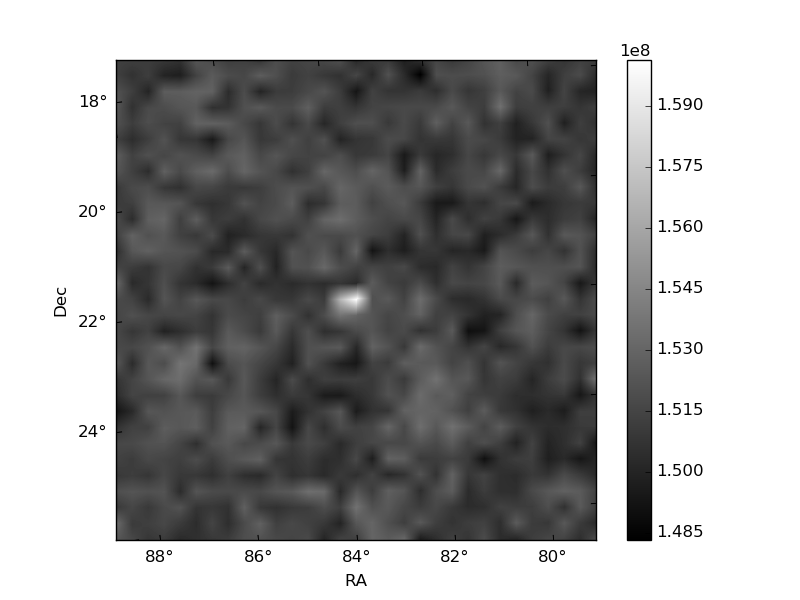
Quadrant B |
|---|---|---|---|
| Quadrant D | 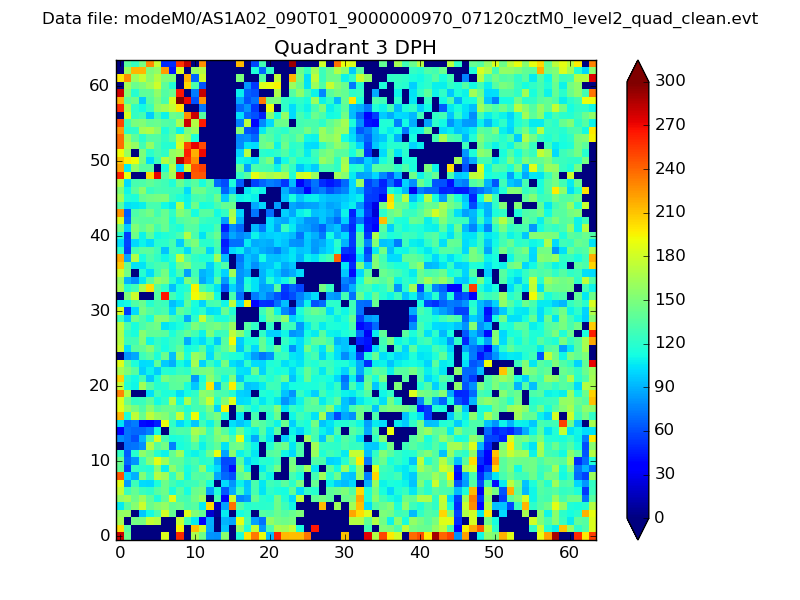 |
 |
Quadrant C |
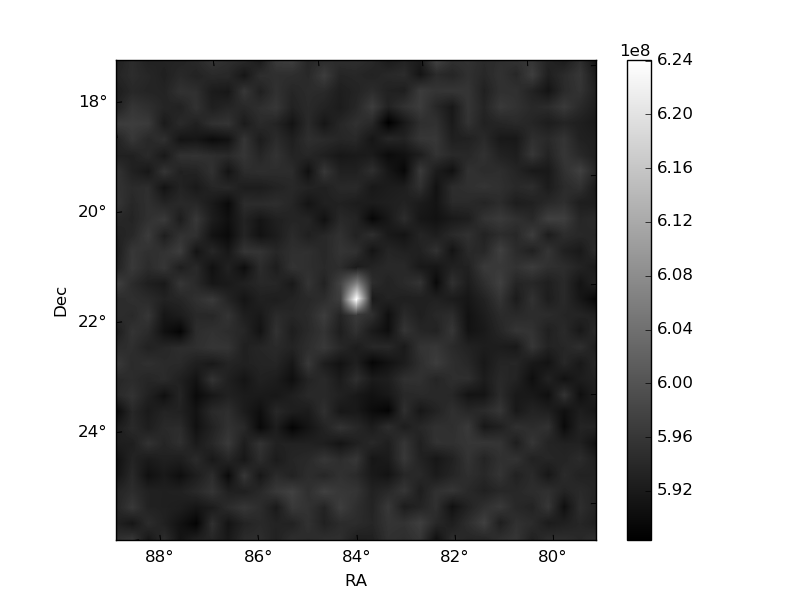
| Plot type | Count rate plots | Images |
|---|---|---|
| Comparison with Poisson distribution Blue bars denote a histogram of data divided into 1 sec bins. Red curve is a Poisson curve with rate = median count rate of data. |
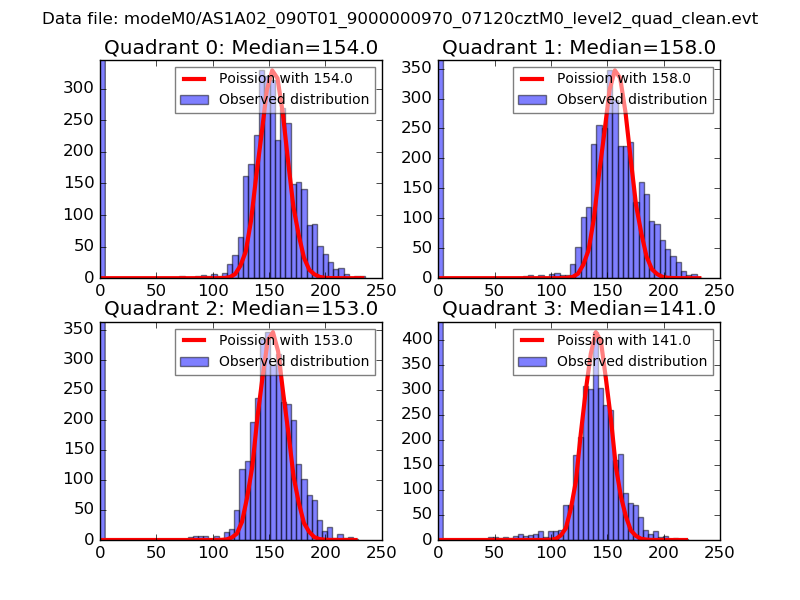 |
 |
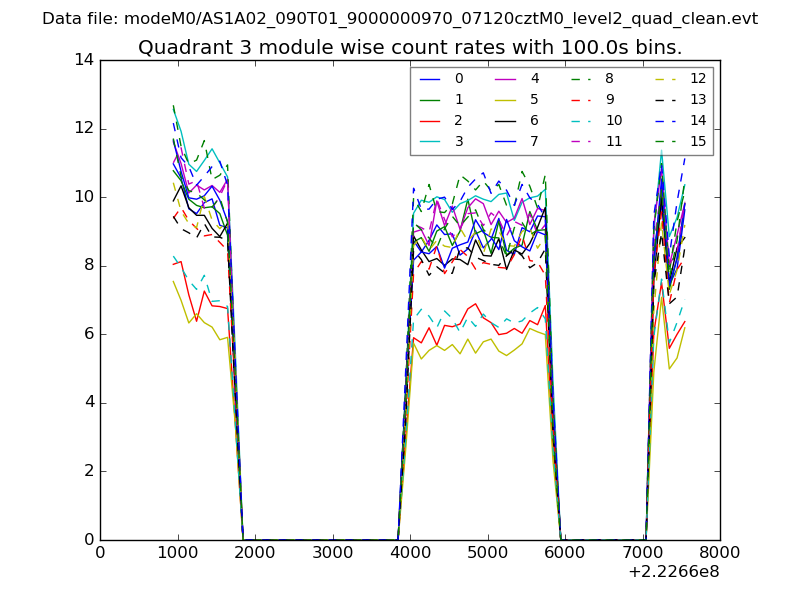
| Quadrant-wise count rates Data is divided into 100 sec bins |
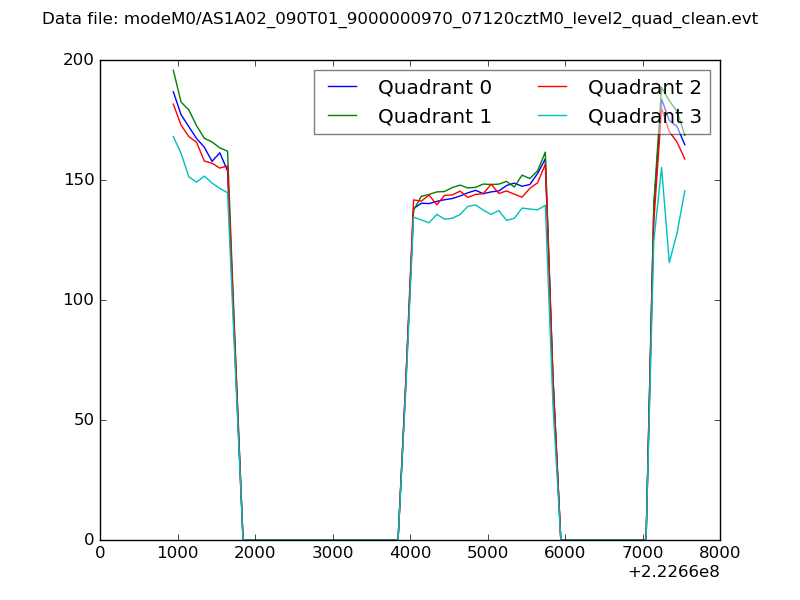 |
|
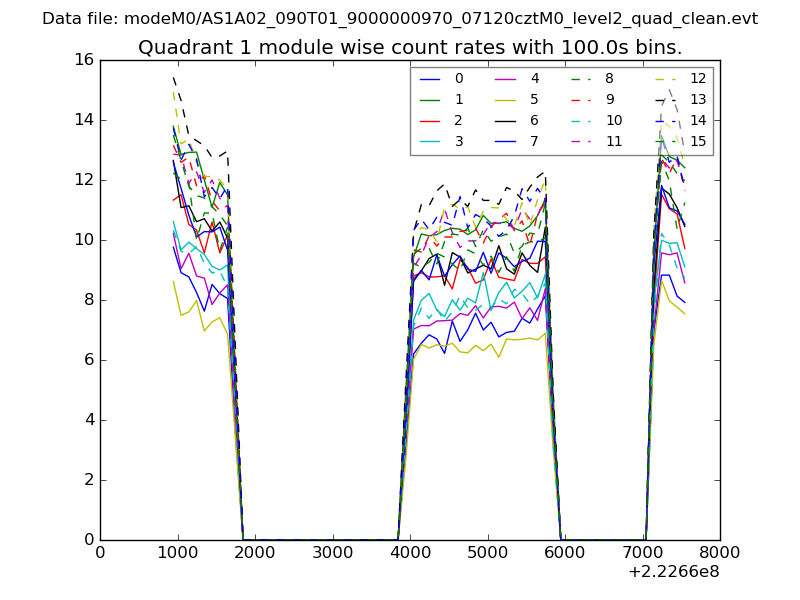
| Module-wise count rates for Quadrant A Data is divided into 100 sec bins |
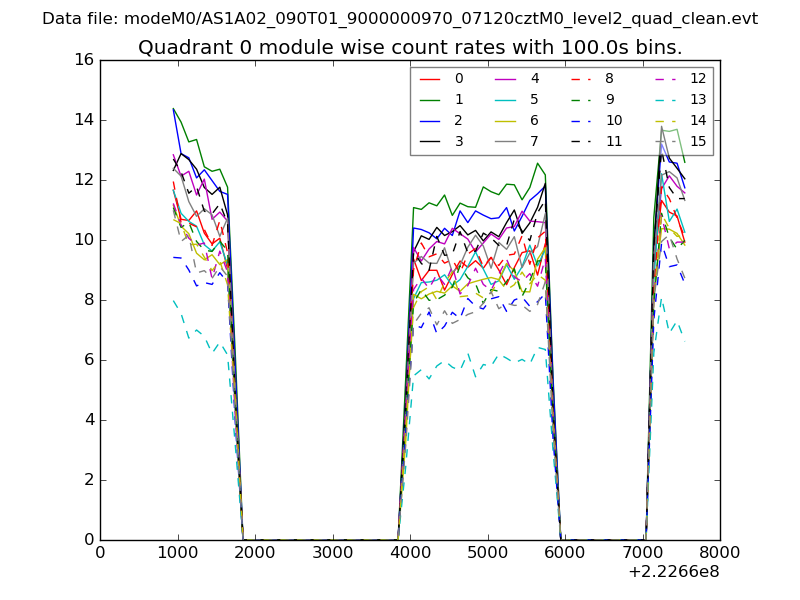 |
 |
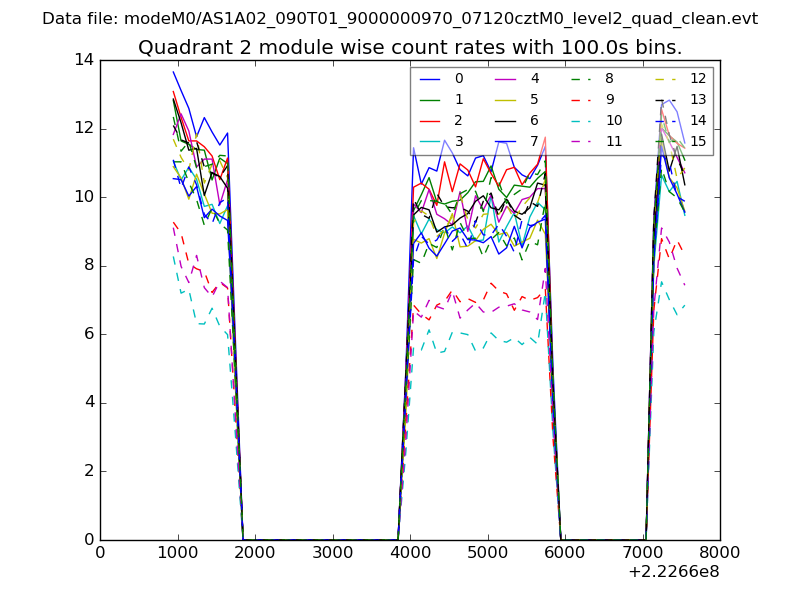
| Module-wise count rates for Quadrant B Data is divided into 100 sec bins |
 |
 |
| Module-wise count rates for Quadrant C Data is divided into 100 sec bins |
 |
 |
| Module-wise count rates for Quadrant D Data is divided into 100 sec bins |
 |
 |
| Parameter | Plot |
|---|---|
| CZT HV Monitor | 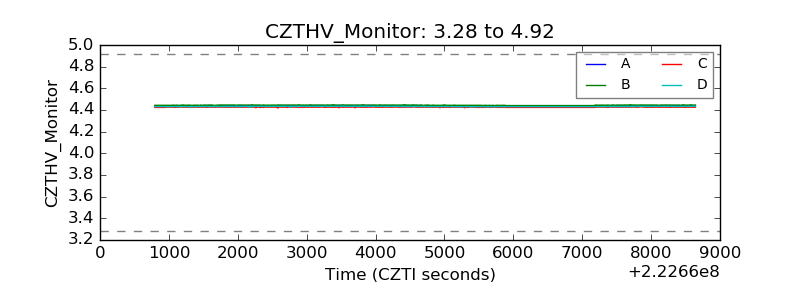 |
| D_VDD | 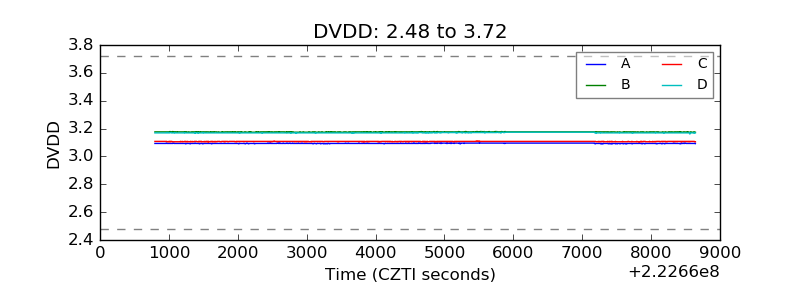 |
| Temperature 1 | 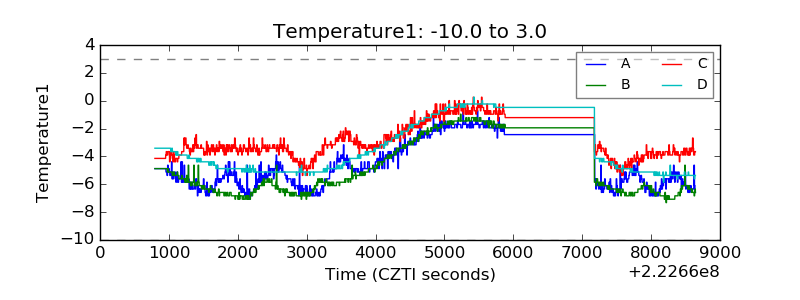 |
| Veto HV Monitor | 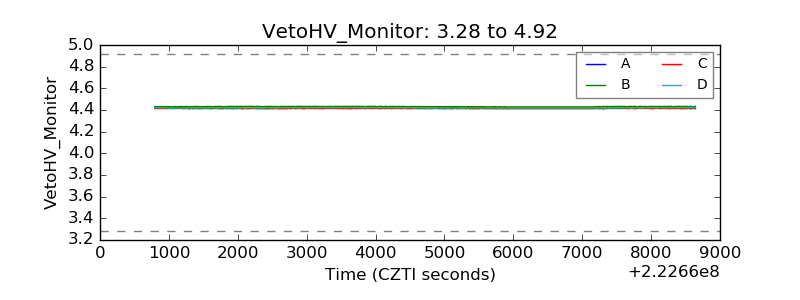 |
| Veto LLD | 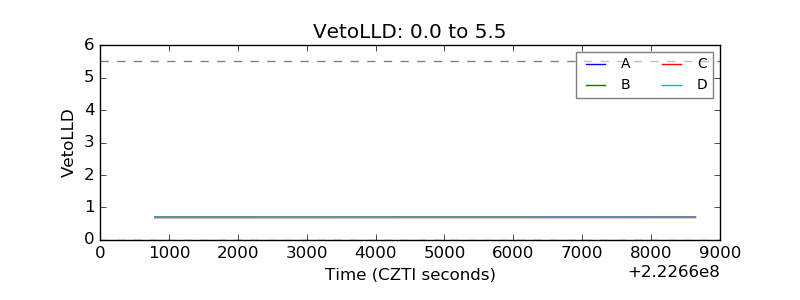 |
| Alpha Counter | 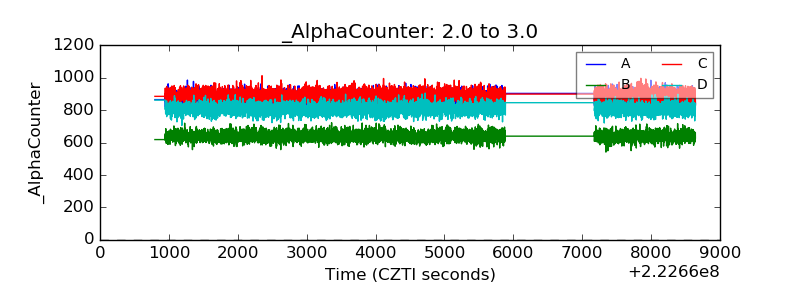 |
| _CPM_Rate | 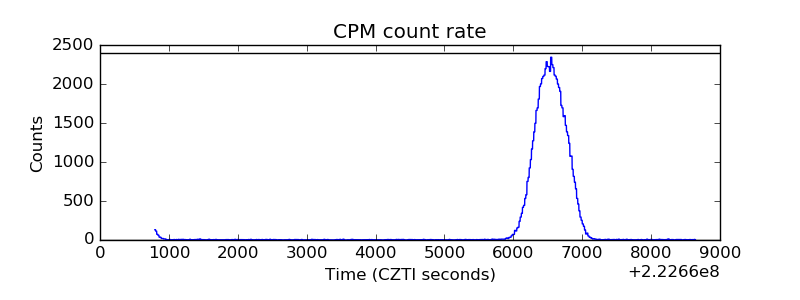 |
| CZT Counter | 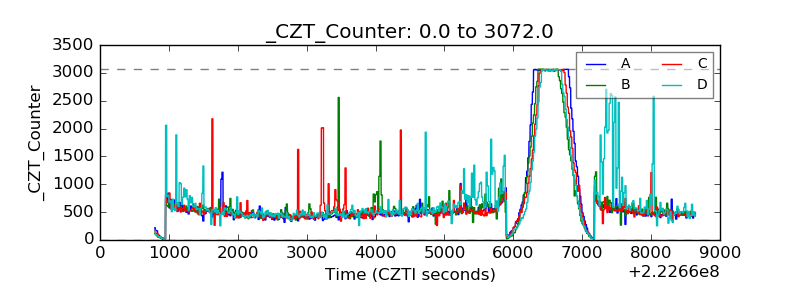 |
| +2.5 Volts monitor | 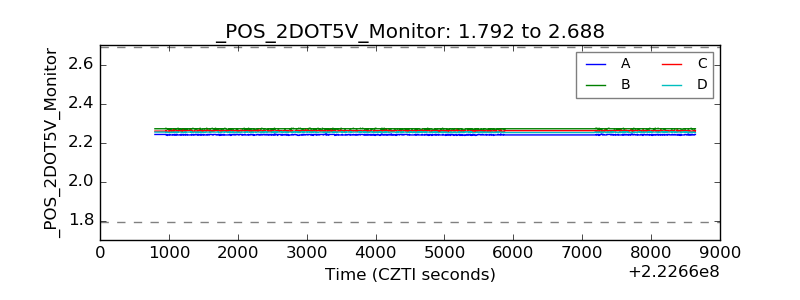 |
| +5 Volts monitor | 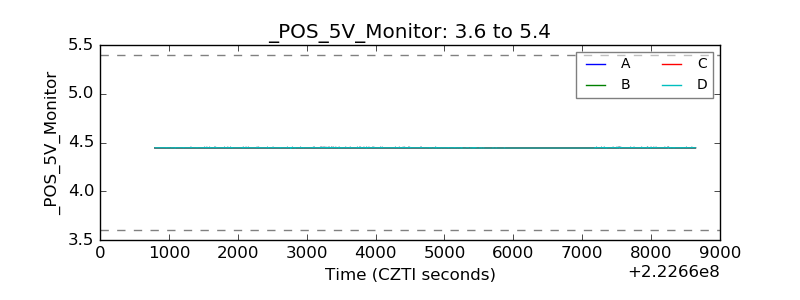 |
| _ROLL_ROT | 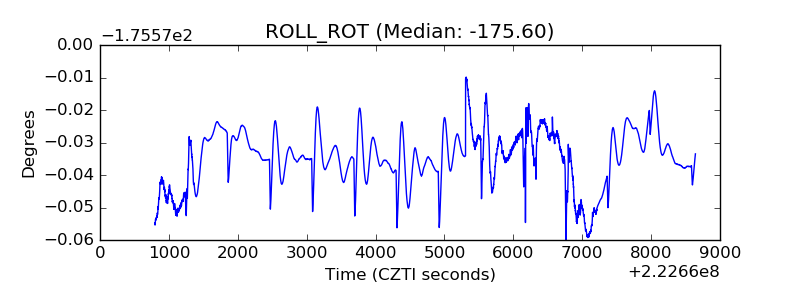 |
| _Roll_DEC | 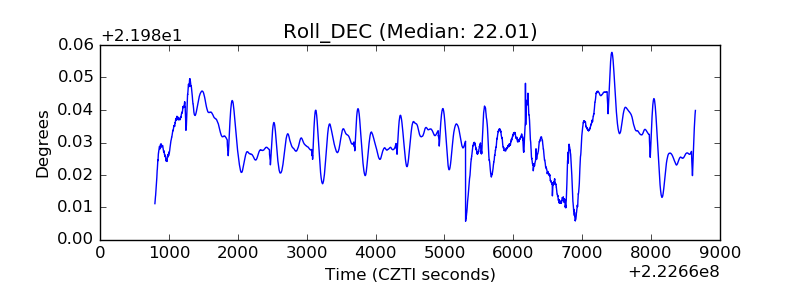 |
| _Roll_RA | 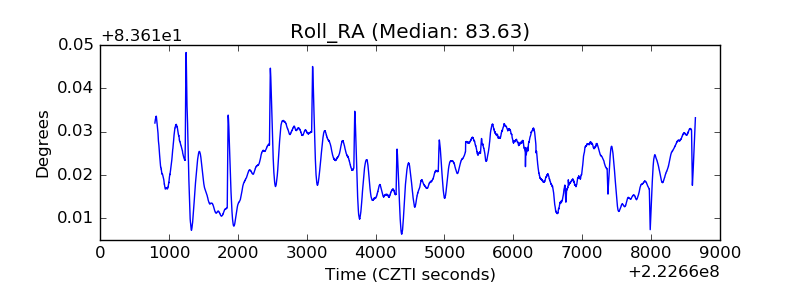 |
| Veto Counter | 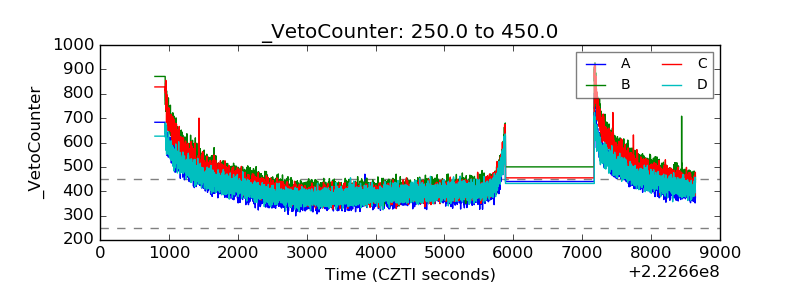 |