| Param | Original file | Final file |
|---|---|---|
| Filename | modeM0/AS1A02_090T01_9000000970_07121cztM0_level2.evt | modeM0/AS1A02_090T01_9000000970_07121cztM0_level2_quad_clean.evt |
| Size (bytes) | 488,972,160 | 70,588,800 |
| Size | 466.3 MB | 67.3 MB |
| Events in quadrant A | 3,296,515 | 427,205 |
| Events in quadrant B | 3,545,059 | 440,003 |
| Events in quadrant C | 3,245,721 | 425,140 |
| Events in quadrant D | 4,277,932 | 389,274 |
| Mode M0 | |||
|---|---|---|---|
| Quadrant | BADHDUFLAG | Total packets | Discarded packets |
| A | 0 | 13823 | 3 |
| B | 0 | 14491 | 2 |
| C | 0 | 13694 | 2 |
| D | 0 | 16826 | 2 |
| Mode M9 | |||
|---|---|---|---|
| Quadrant | BADHDUFLAG | Total packets | Discarded packets |
| A | 0 | 16 | 0 |
| B | 0 | 16 | 0 |
| C | 0 | 16 | 0 |
| D | 0 | 17 | 0 |
| Mode SS | |||
|---|---|---|---|
| Quadrant | BADHDUFLAG | Total packets | Discarded packets |
| A | 0 | 134 | 0 |
| B | 0 | 134 | 0 |
| C | 0 | 134 | 0 |
| D | 0 | 134 | 0 |
| Quadrant | Total seconds | Saturated seconds | Saturation percentage |
|---|---|---|---|
| A | 6527 | 62 | 0.949900% |
| B | 6527 | 60 | 0.919258% |
| C | 6527 | 37 | 0.566876% |
| D | 6527 | 250 | 3.830244% |
Noise dominated data is calculated using 1-second bins in cleaned event files. If a bin has >2000 counts, and if more than 50% of those come from <1% of pixels, then it is considered to be noise-dominated and hence unusable.
| Quadrant | # 1 sec bins | Bins with >0 counts | Bins with >2000 counts | High rate bins dominated by noise | Noise dominated (total time) | Noise dominated (detector-on time) | Marked lightcurve |
|---|---|---|---|---|---|---|---|
| A | 7832 | 6528 | 2 | 2 | 0.03% | 0.03% | 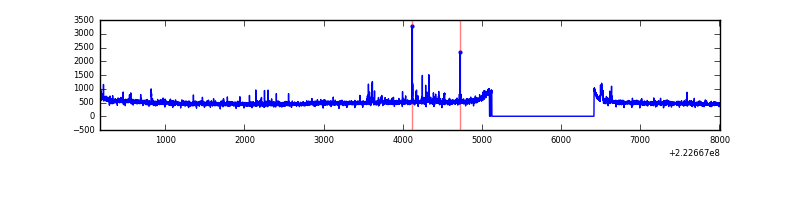 |
| B | 7832 | 6527 | 11 | 11 | 0.14% | 0.17% | 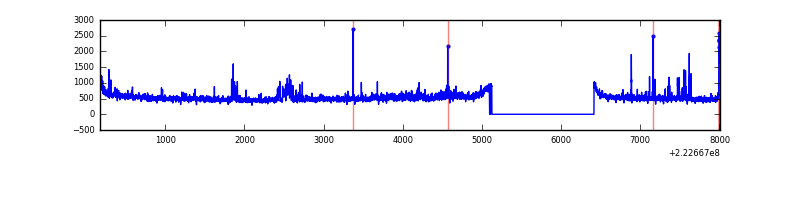 |
| C | 7832 | 6528 | 4 | 4 | 0.05% | 0.06% | 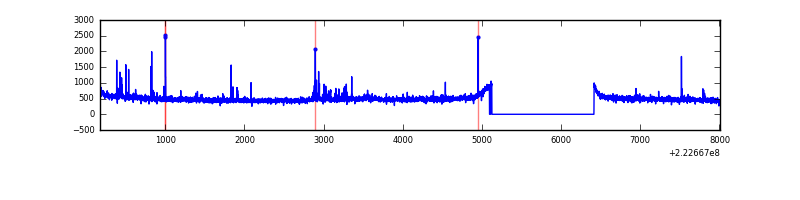 |
| D | 7832 | 6528 | 204 | 204 | 2.60% | 3.12% | 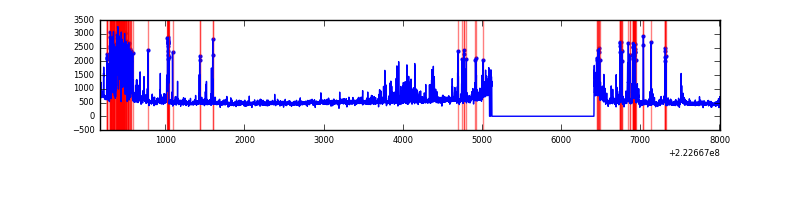 |
Top three noisy pixels from each quadrant. If the there are fewer than three noisy pixels in the level2.evt file, extra rows are filled as -1
| Pixel properties | Quadrant properties | ||||||
|---|---|---|---|---|---|---|---|
| Quadrant | DetID | PixID | Counts | Sigma | Mean | Median | Sigma |
| A | 14 | 111 | 52264 | 308.63 | 827 | 811 | 166.7 |
| A | 14 | 238 | 35174 | 206.12 | 827 | 811 | 166.7 |
| A | 8 | 15 | 17863 | 102.28 | 827 | 811 | 166.7 |
| B | 3 | 220 | 133350 | 841.03 | 843 | 826 | 157.6 |
| B | 0 | 214 | 64990 | 407.2 | 843 | 826 | 157.6 |
| B | 4 | 81 | 58845 | 368.2 | 843 | 826 | 157.6 |
| C | 4 | 254 | 75557 | 400.79 | 803 | 812 | 186.5 |
| C | 10 | 22 | 26002 | 135.07 | 803 | 812 | 186.5 |
| C | 9 | 68 | 6881 | 32.54 | 803 | 812 | 186.5 |
| D | 2 | 216 | 376453 | 1936.96 | 785 | 762 | 194.0 |
| D | 12 | 233 | 353958 | 1820.98 | 785 | 762 | 194.0 |
| D | 8 | 195 | 341518 | 1756.85 | 785 | 762 | 194.0 |
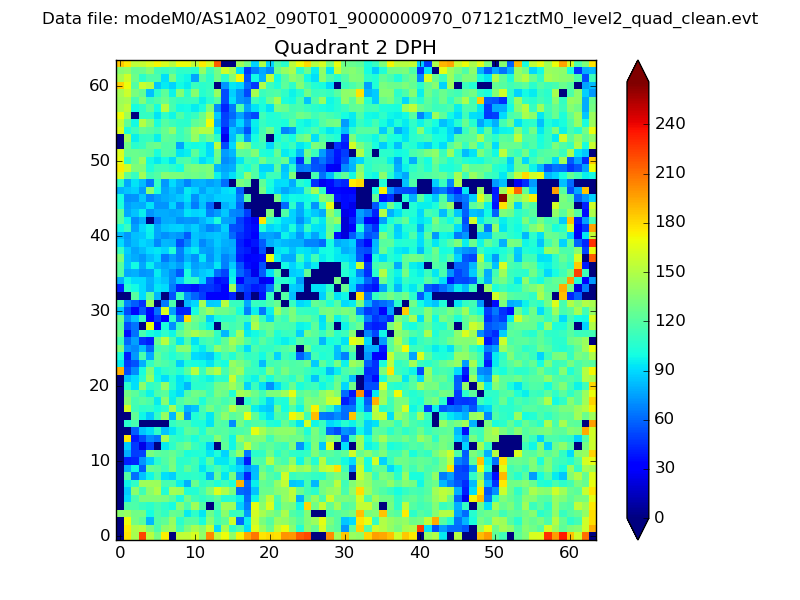
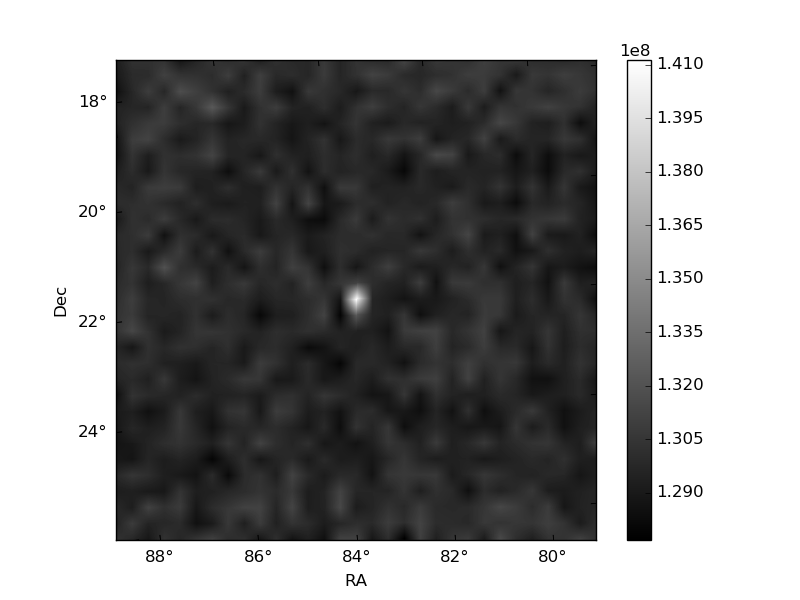
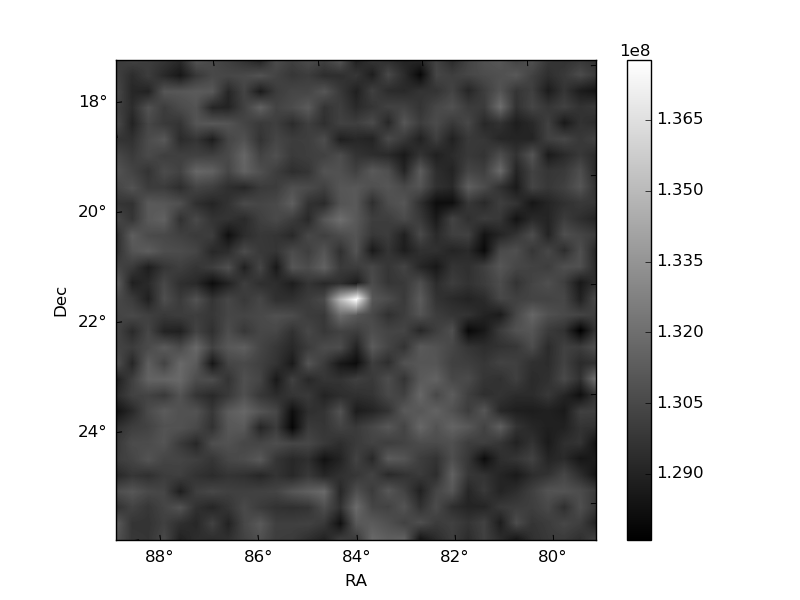
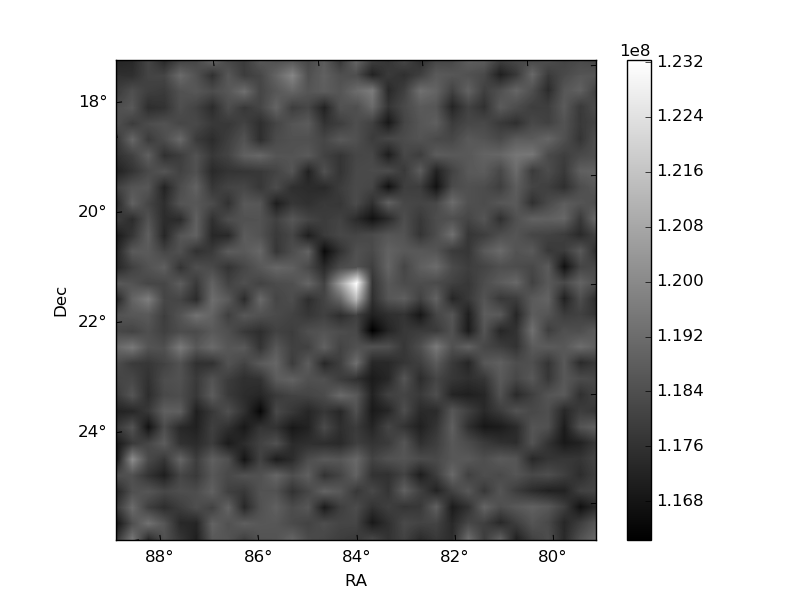
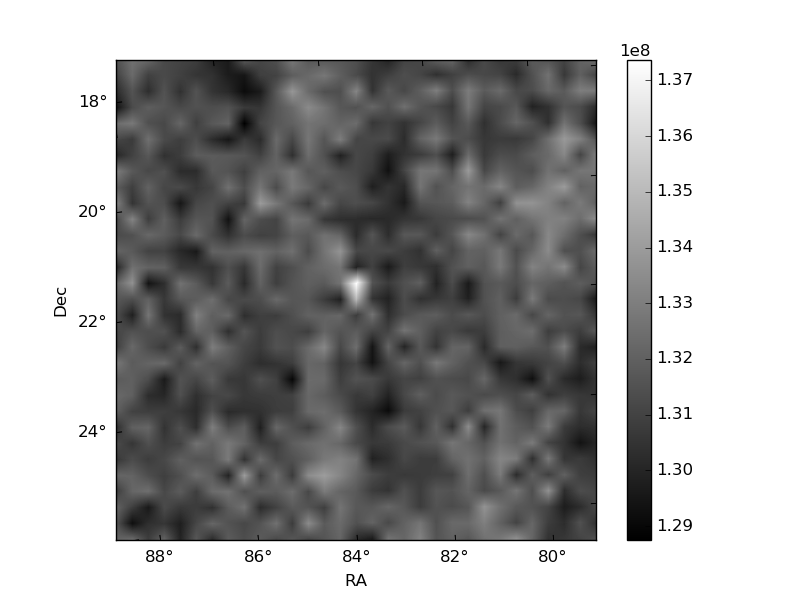
Histogram calculated using DETX and DETY for each event in the final _common_clean file
| Quadrant A | 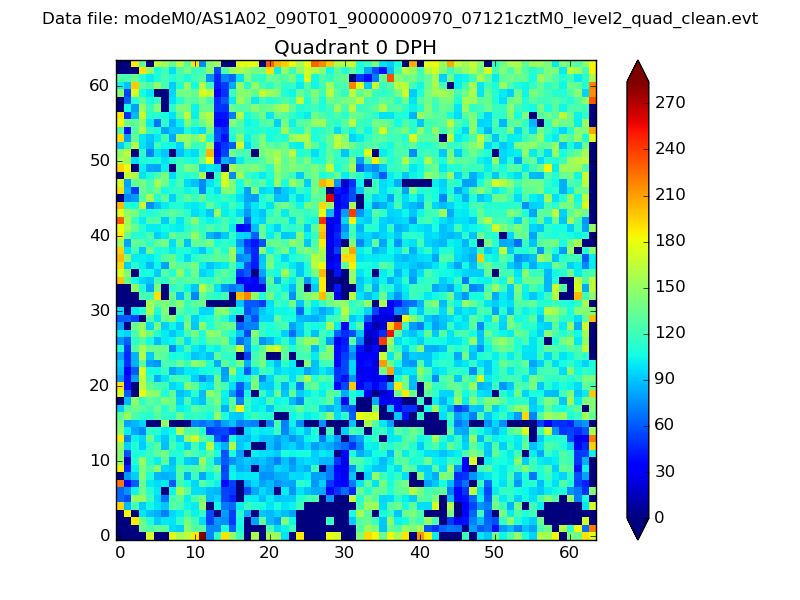 |
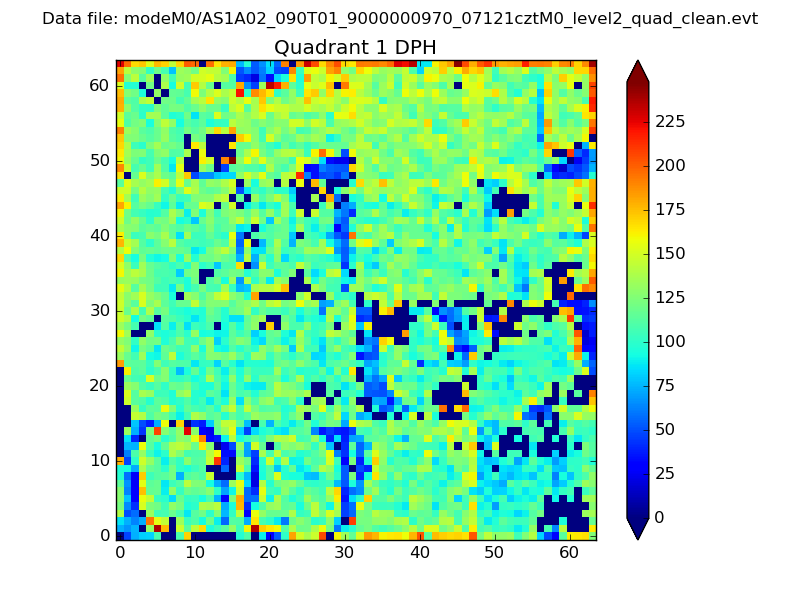 |
Quadrant B |
|---|---|---|---|
| Quadrant D | 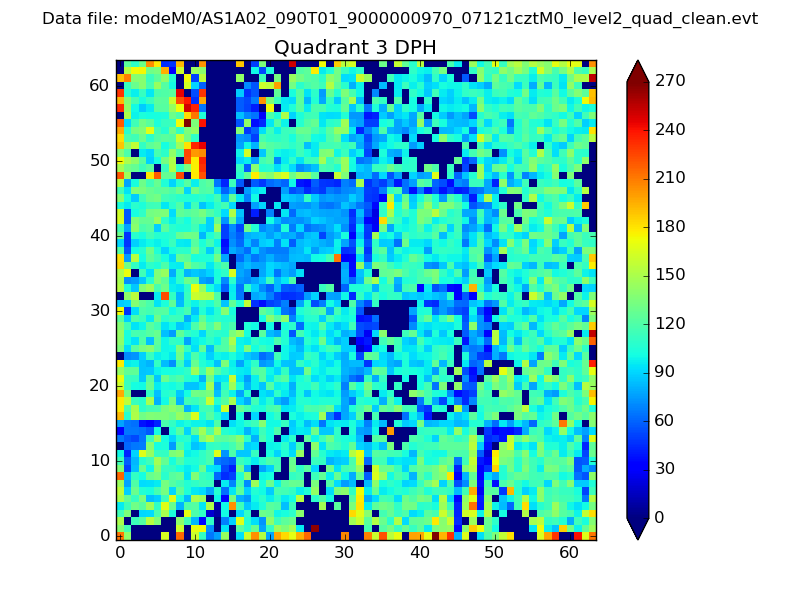 |
 |
Quadrant C |
| Plot type | Count rate plots | Images |
|---|---|---|
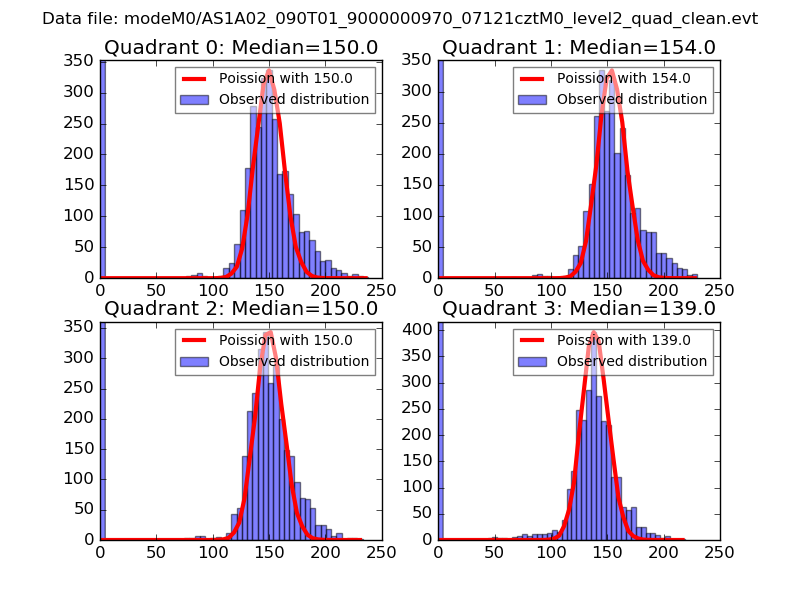
| Comparison with Poisson distribution Blue bars denote a histogram of data divided into 1 sec bins. Red curve is a Poisson curve with rate = median count rate of data. |
 |
 |
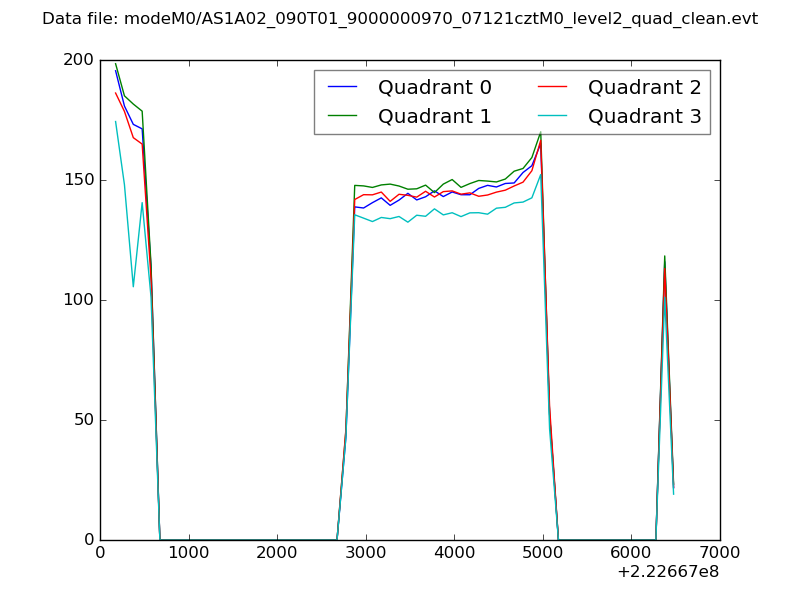
| Quadrant-wise count rates Data is divided into 100 sec bins |
 |
|
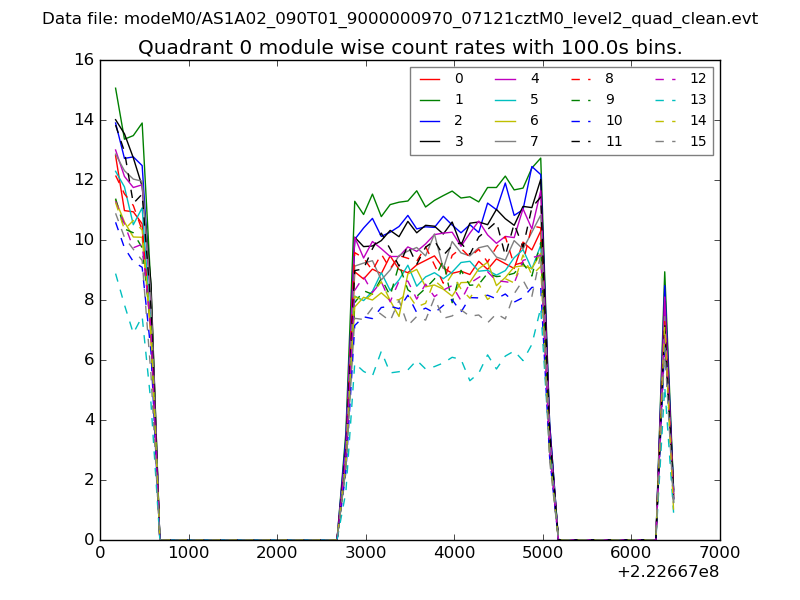
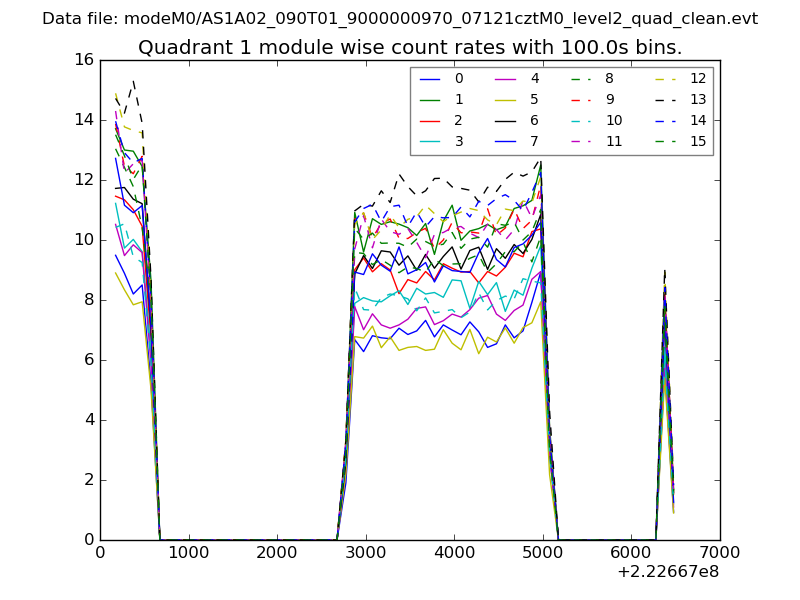
| Module-wise count rates for Quadrant A Data is divided into 100 sec bins |
 |
 |
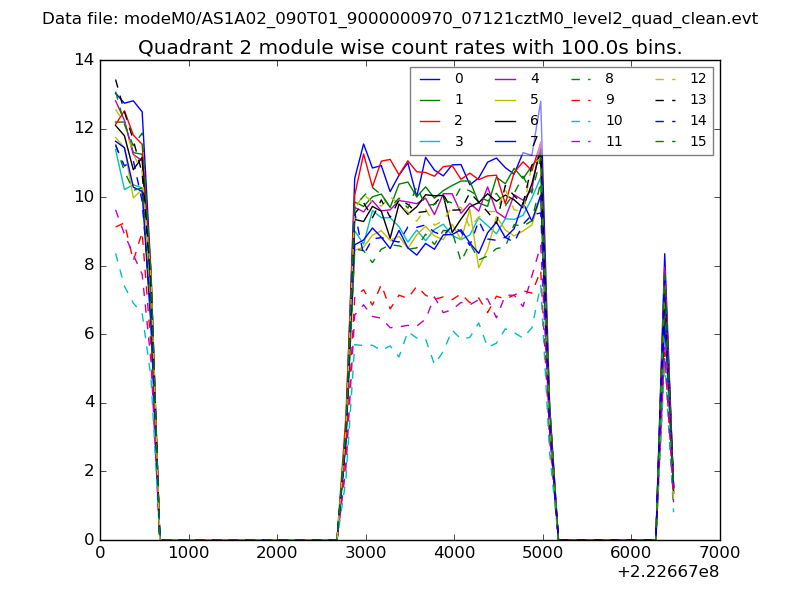
| Module-wise count rates for Quadrant B Data is divided into 100 sec bins |
 |
 |
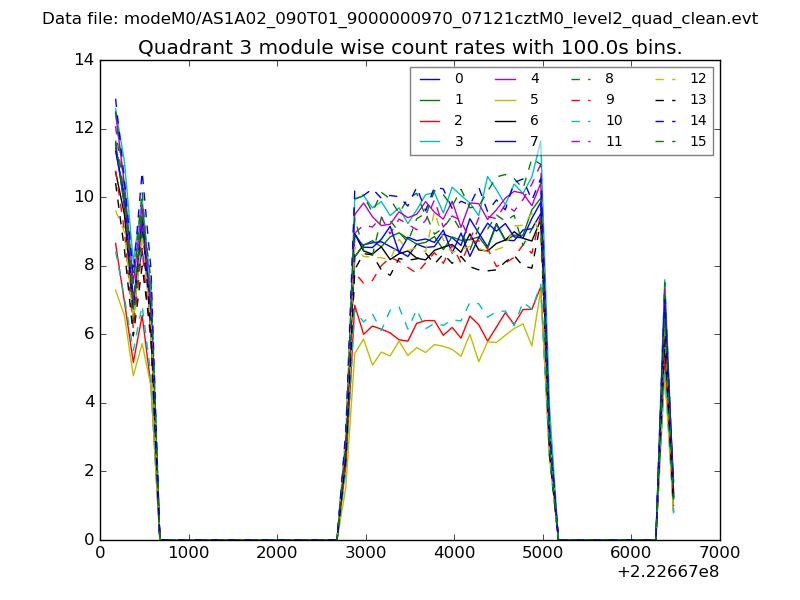
| Module-wise count rates for Quadrant C Data is divided into 100 sec bins |
 |
 |
| Module-wise count rates for Quadrant D Data is divided into 100 sec bins |
 |
 |
| Parameter | Plot |
|---|---|
| CZT HV Monitor | 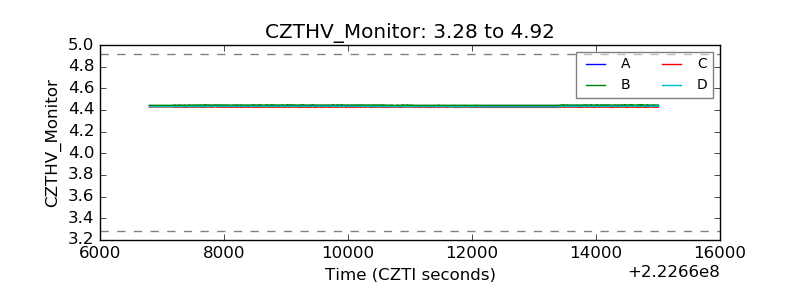 |
| D_VDD | 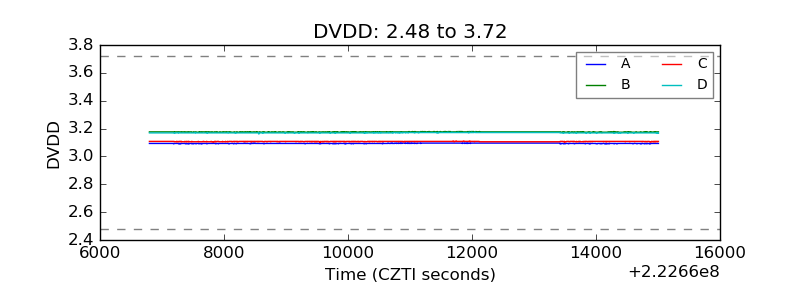 |
| Temperature 1 | 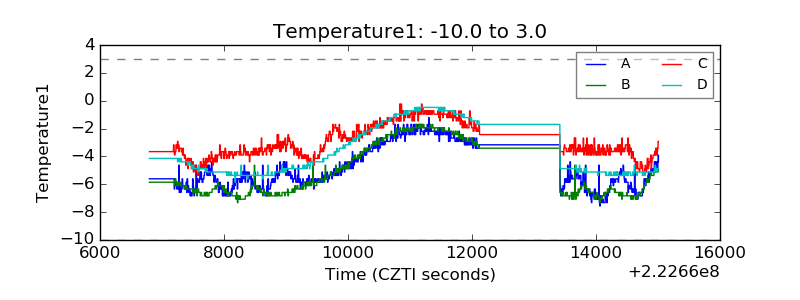 |
| Veto HV Monitor | 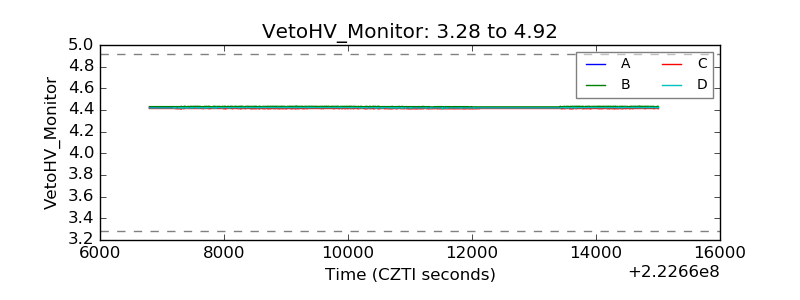 |
| Veto LLD | 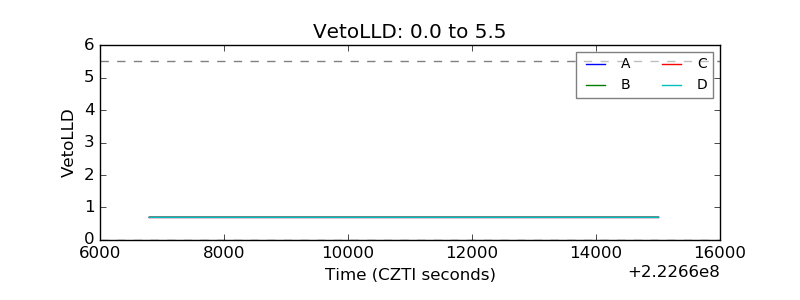 |
| Alpha Counter | 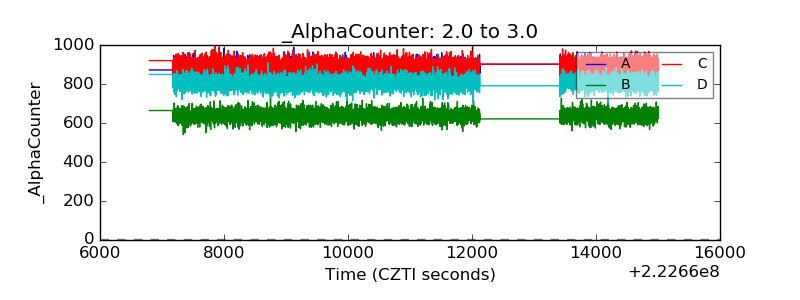 |
| _CPM_Rate | 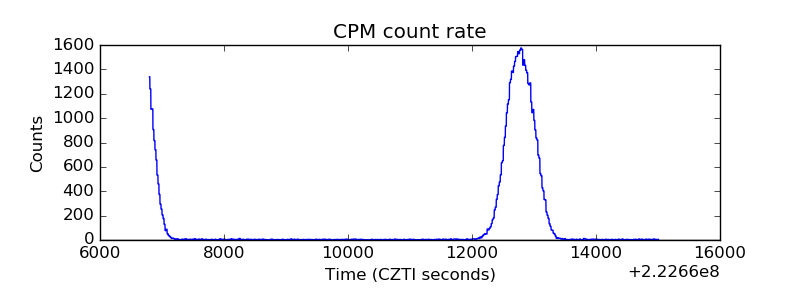 |
| CZT Counter |  |
| +2.5 Volts monitor |  |
| +5 Volts monitor |  |
| _ROLL_ROT | 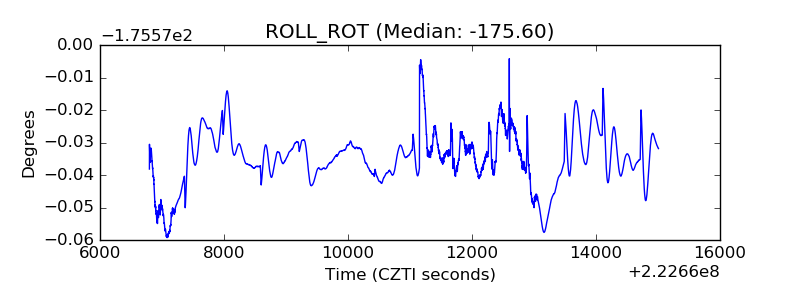 |
| _Roll_DEC | 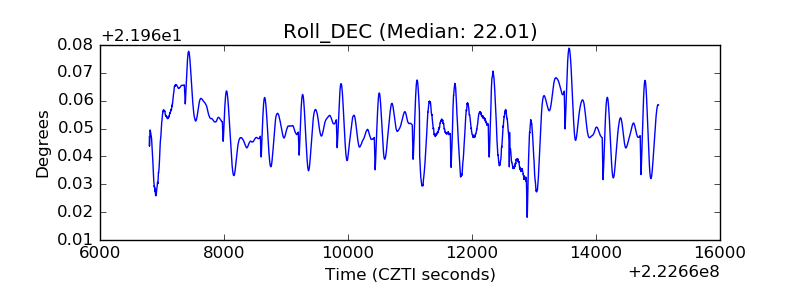 |
| _Roll_RA | 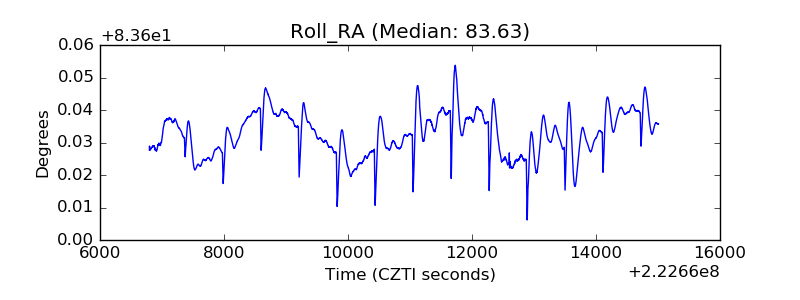 |
| Veto Counter |  |