| Param | Original file | Final file |
|---|---|---|
| Filename | modeM0/AS1A02_090T01_9000000970_07122cztM0_level2.evt | modeM0/AS1A02_090T01_9000000970_07122cztM0_level2_quad_clean.evt |
| Size (bytes) | 211,512,960 | 17,904,960 |
| Size | 201.7 MB | 17.1 MB |
| Events in quadrant A | 1,341,856 | 85,859 |
| Events in quadrant B | 1,983,945 | 87,974 |
| Events in quadrant C | 1,325,619 | 86,791 |
| Events in quadrant D | 1,562,342 | 80,949 |
| Mode M0 | |||
|---|---|---|---|
| Quadrant | BADHDUFLAG | Total packets | Discarded packets |
| A | 0 | 5773 | 1 |
| B | 0 | 7619 | 1 |
| C | 0 | 5706 | 1 |
| D | 0 | 6461 | 1 |
| Mode M9 | |||
|---|---|---|---|
| Quadrant | BADHDUFLAG | Total packets | Discarded packets |
| A | 0 | 6 | 0 |
| B | 0 | 6 | 0 |
| C | 0 | 6 | 0 |
| D | 0 | 7 | 0 |
| Mode SS | |||
|---|---|---|---|
| Quadrant | BADHDUFLAG | Total packets | Discarded packets |
| A | 0 | 56 | 0 |
| B | 0 | 56 | 0 |
| C | 0 | 56 | 0 |
| D | 0 | 56 | 0 |
| Quadrant | Total seconds | Saturated seconds | Saturation percentage |
|---|---|---|---|
| A | 2794 | 19 | 0.680029% |
| B | 2794 | 184 | 6.585540% |
| C | 2794 | 3 | 0.107373% |
| D | 2794 | 58 | 2.075877% |
Noise dominated data is calculated using 1-second bins in cleaned event files. If a bin has >2000 counts, and if more than 50% of those come from <1% of pixels, then it is considered to be noise-dominated and hence unusable.
| Quadrant | # 1 sec bins | Bins with >0 counts | Bins with >2000 counts | High rate bins dominated by noise | Noise dominated (total time) | Noise dominated (detector-on time) | Marked lightcurve |
|---|---|---|---|---|---|---|---|
| A | 2794 | 2794 | 0 | 0 | 0.00% | 0.00% | 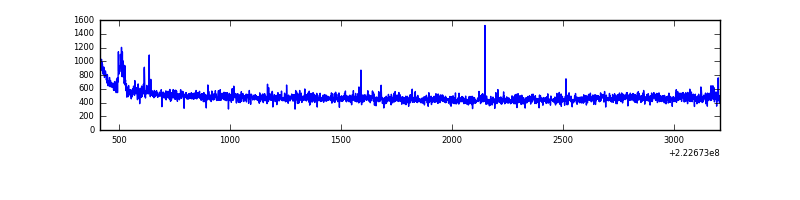 |
| B | 2794 | 2794 | 154 | 154 | 5.51% | 5.51% | 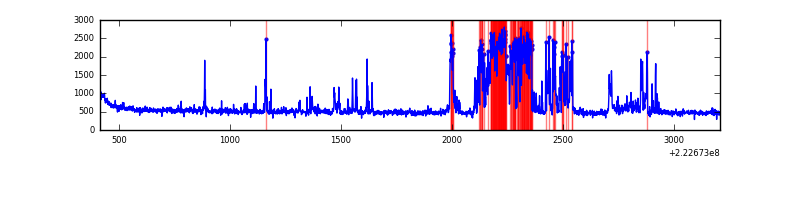 |
| C | 2794 | 2794 | 0 | 0 | 0.00% | 0.00% | 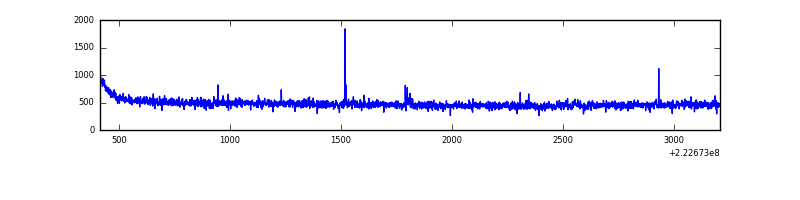 |
| D | 2794 | 2794 | 49 | 49 | 1.75% | 1.75% | 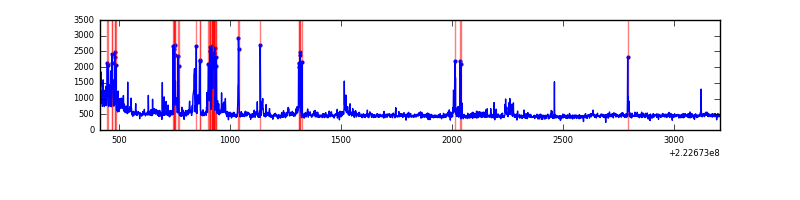 |
Top three noisy pixels from each quadrant. If the there are fewer than three noisy pixels in the level2.evt file, extra rows are filled as -1
| Pixel properties | Quadrant properties | ||||||
|---|---|---|---|---|---|---|---|
| Quadrant | DetID | PixID | Counts | Sigma | Mean | Median | Sigma |
| A | 14 | 111 | 12984 | 180.68 | 341 | 335 | 70.0 |
| A | 14 | 238 | 6547 | 88.73 | 341 | 335 | 70.0 |
| A | 0 | 226 | 3178 | 40.61 | 341 | 335 | 70.0 |
| B | 3 | 220 | 613148 | 9336.5 | 343 | 337 | 65.6 |
| B | 4 | 81 | 28469 | 428.61 | 343 | 337 | 65.6 |
| B | 10 | 246 | 7749 | 112.93 | 343 | 337 | 65.6 |
| C | 9 | 68 | 12563 | 155.78 | 334 | 337 | 78.5 |
| C | 4 | 254 | 6124 | 73.74 | 334 | 337 | 78.5 |
| C | 7 | 247 | 3651 | 42.23 | 334 | 337 | 78.5 |
| D | 2 | 216 | 242223 | 3005.1 | 324 | 314 | 80.5 |
| D | 8 | 195 | 87327 | 1080.91 | 324 | 314 | 80.5 |
| D | 13 | 137 | 9258 | 111.11 | 324 | 314 | 80.5 |
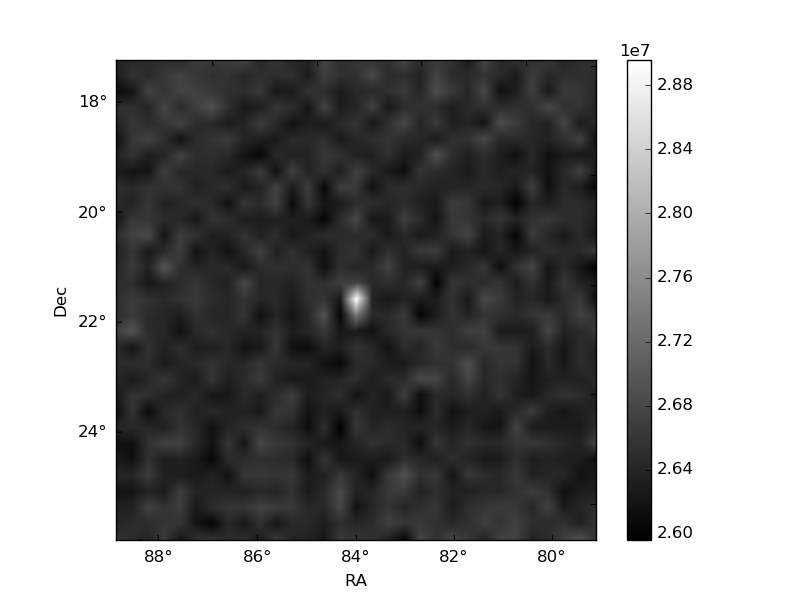
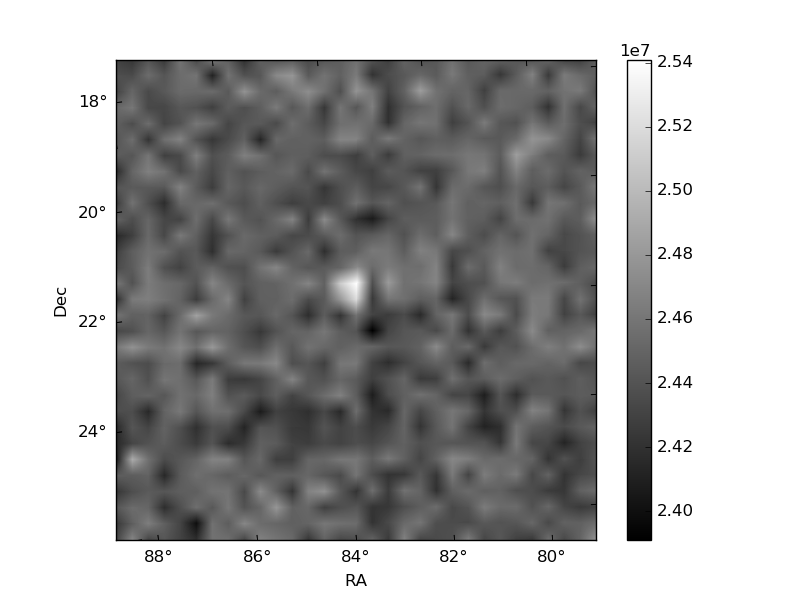
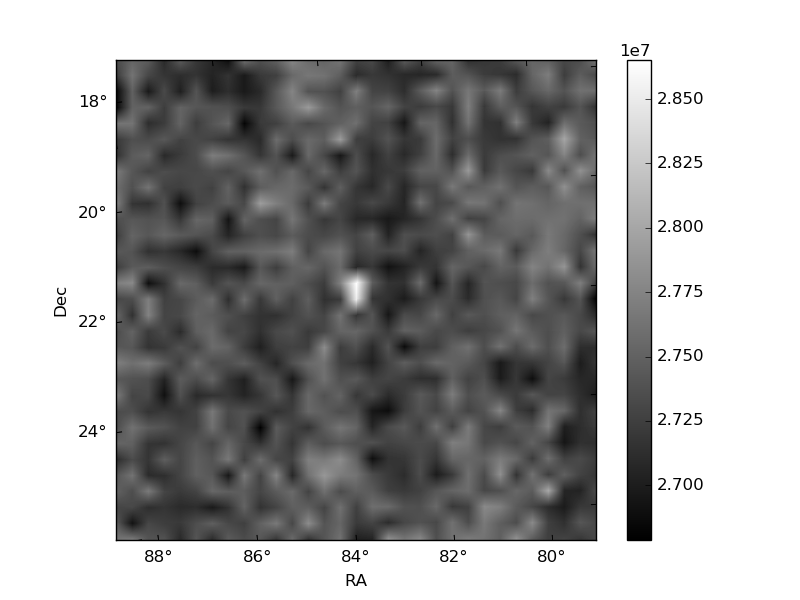
Histogram calculated using DETX and DETY for each event in the final _common_clean file
| Quadrant A | 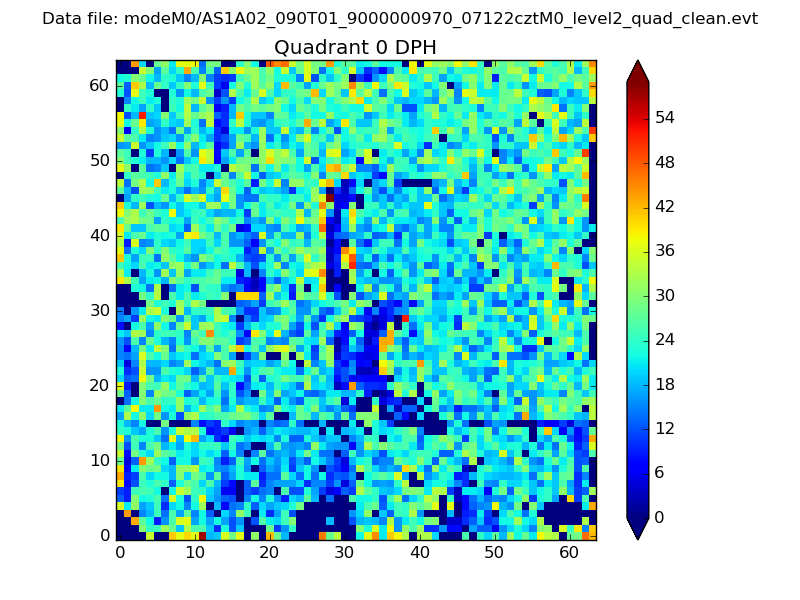 |
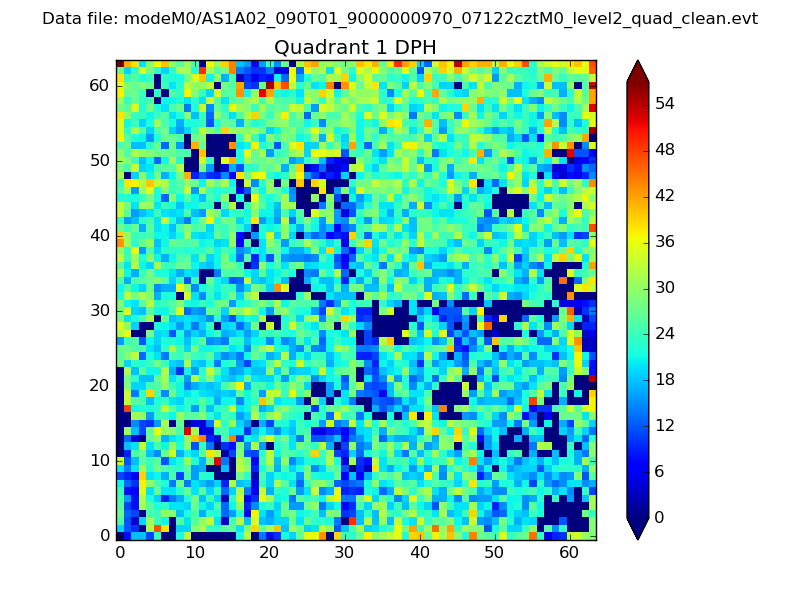 |
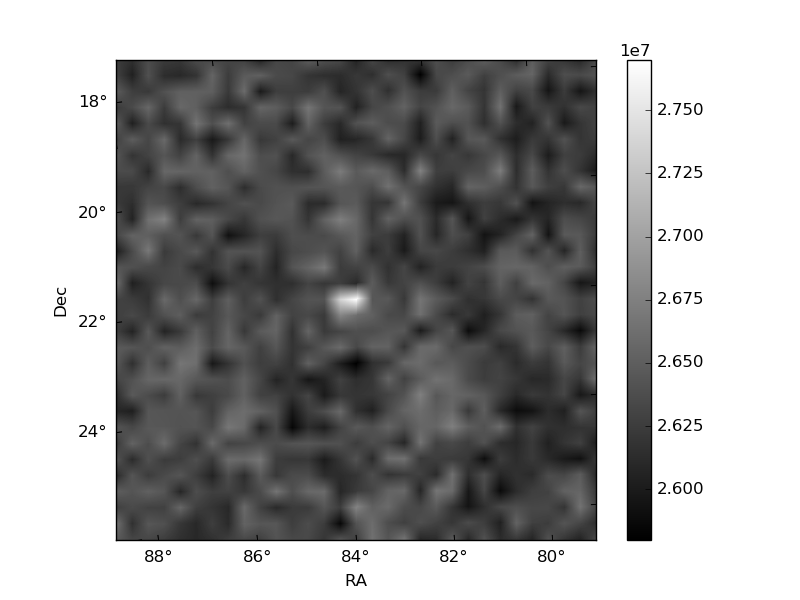
Quadrant B |
|---|---|---|---|
| Quadrant D | 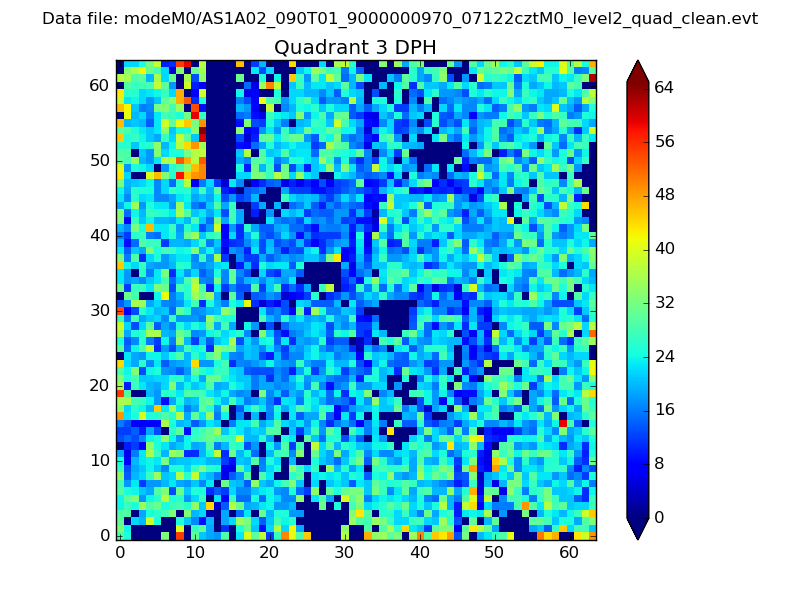 |
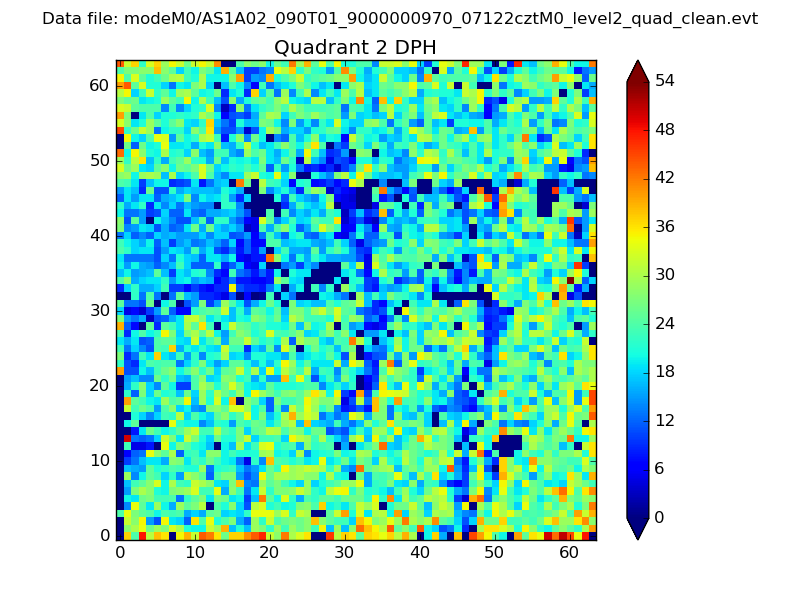 |
Quadrant C |
| Plot type | Count rate plots | Images |
|---|---|---|
| Comparison with Poisson distribution Blue bars denote a histogram of data divided into 1 sec bins. Red curve is a Poisson curve with rate = median count rate of data. |
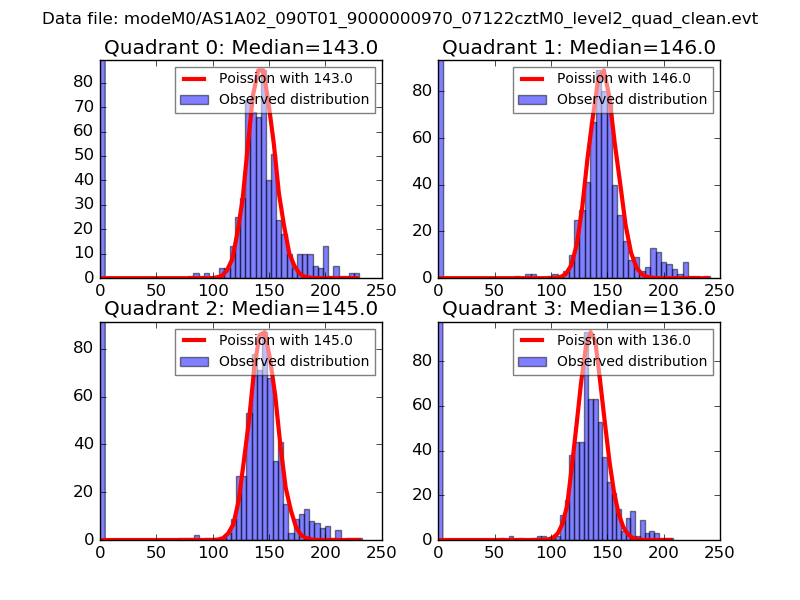 |
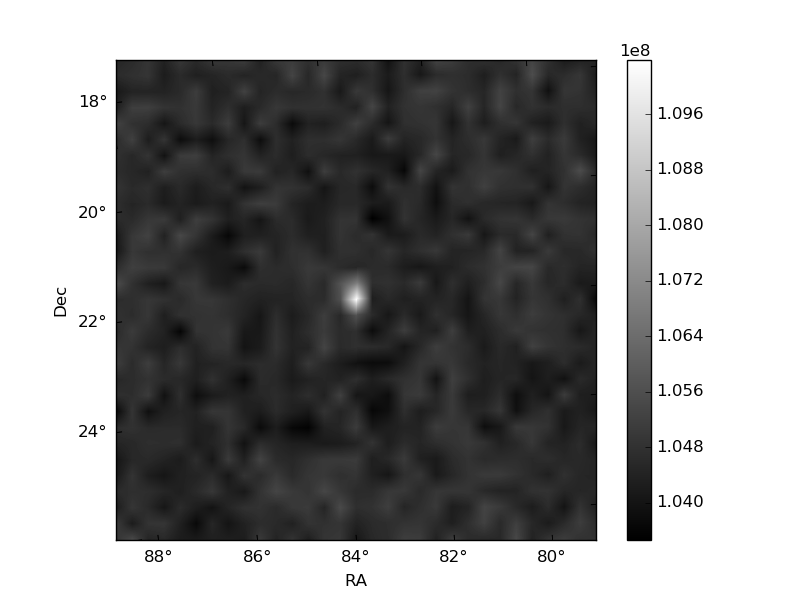 |
| Quadrant-wise count rates Data is divided into 100 sec bins |
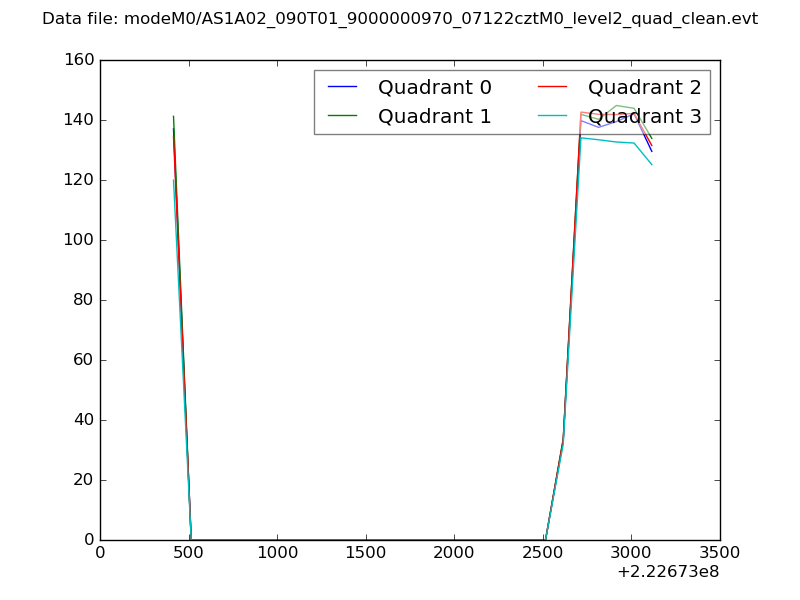 |
|
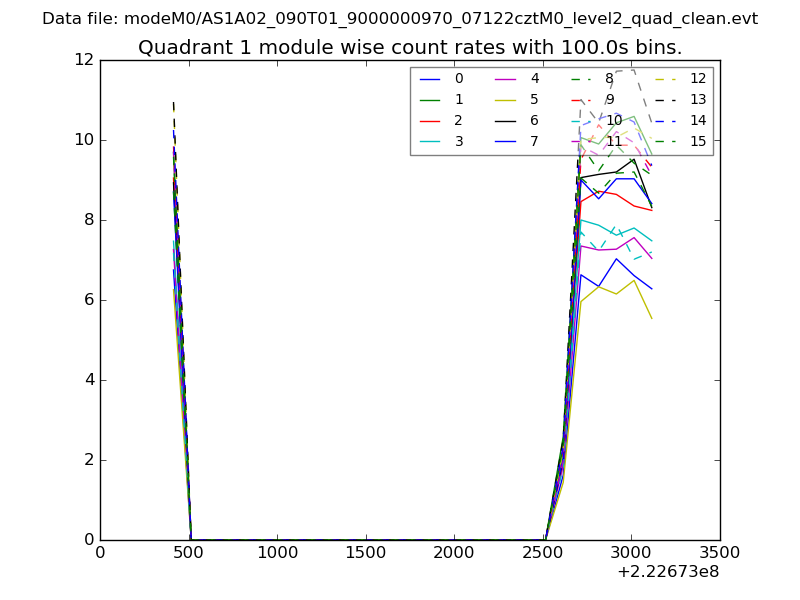
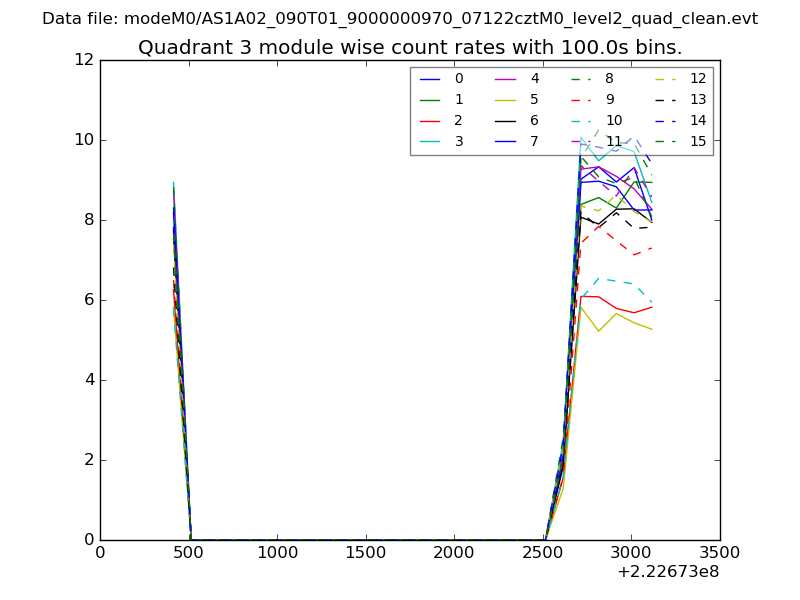
| Module-wise count rates for Quadrant A Data is divided into 100 sec bins |
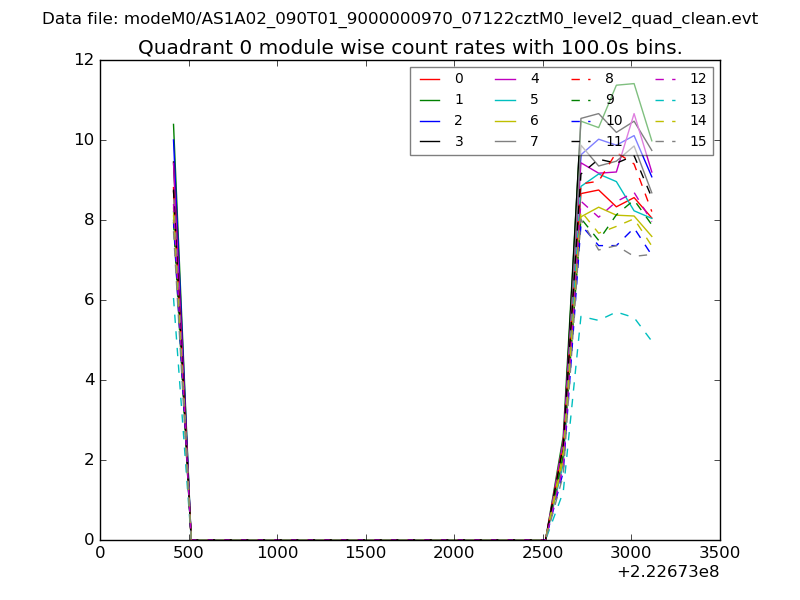 |
 |
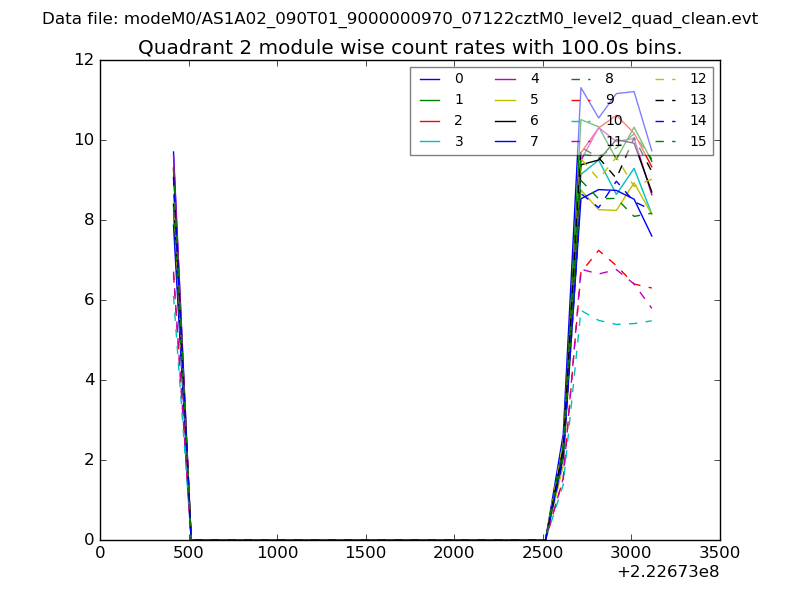
| Module-wise count rates for Quadrant B Data is divided into 100 sec bins |
 |
 |
| Module-wise count rates for Quadrant C Data is divided into 100 sec bins |
 |
 |
| Module-wise count rates for Quadrant D Data is divided into 100 sec bins |
 |
 |
| Parameter | Plot |
|---|---|
| CZT HV Monitor | 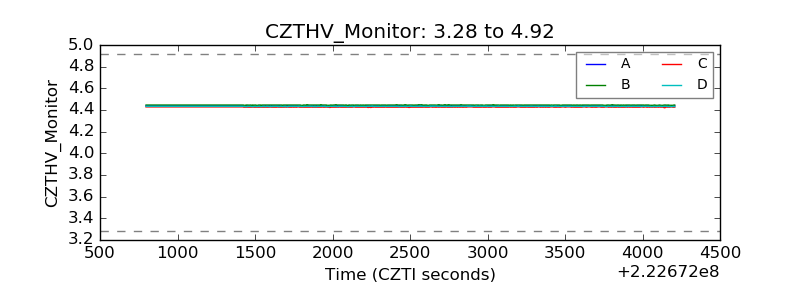 |
| D_VDD | 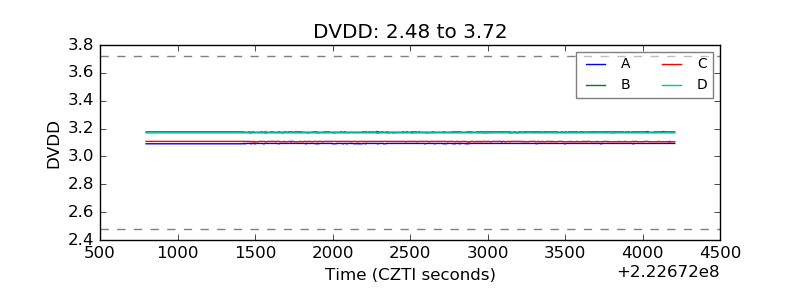 |
| Temperature 1 | 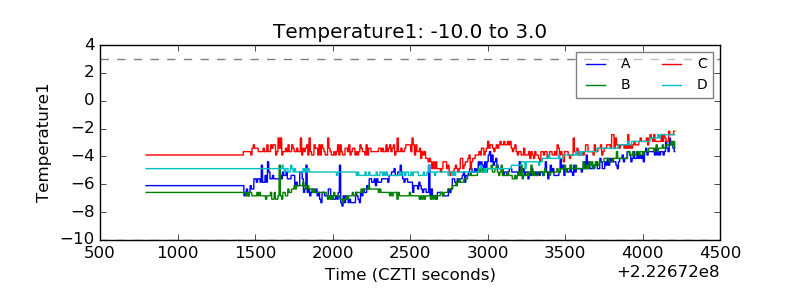 |
| Veto HV Monitor | 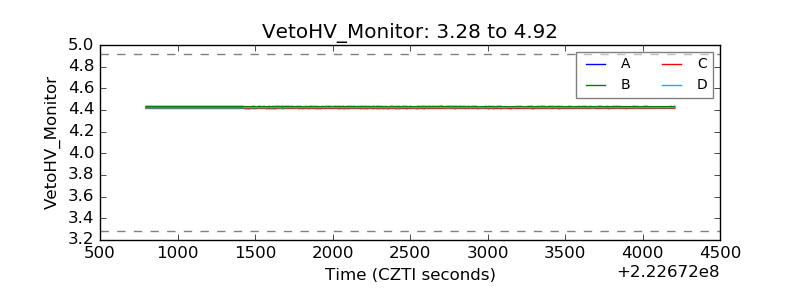 |
| Veto LLD | 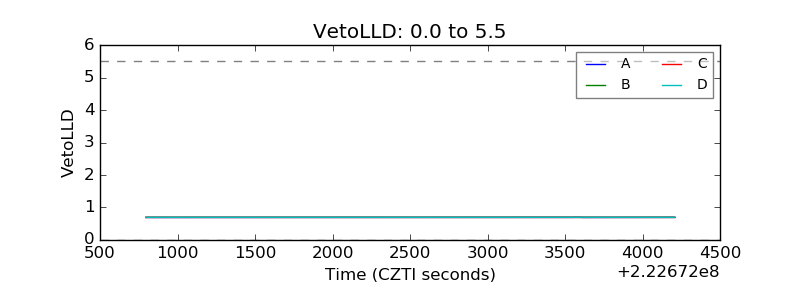 |
| Alpha Counter | 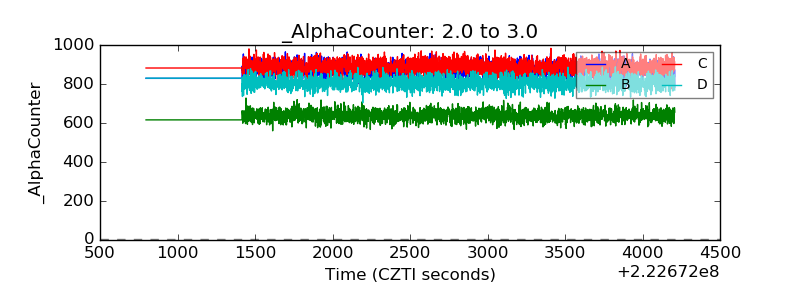 |
| _CPM_Rate | 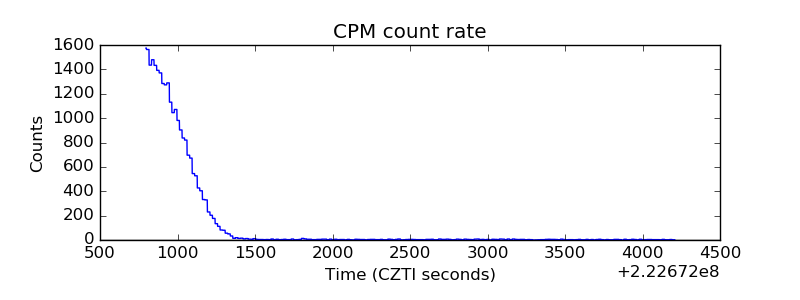 |
| CZT Counter | 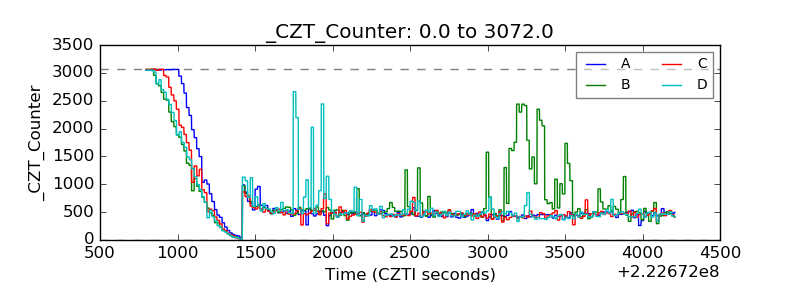 |
| +2.5 Volts monitor | 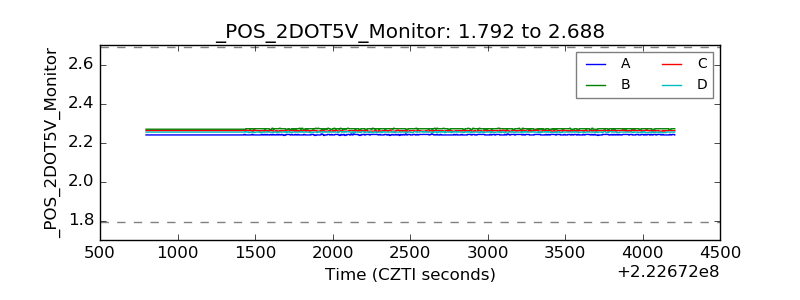 |
| +5 Volts monitor |  |
| _ROLL_ROT | 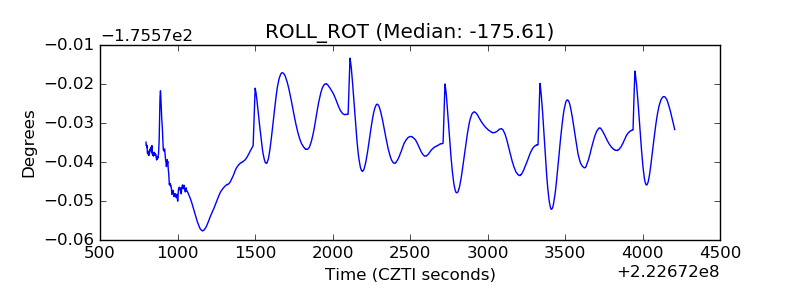 |
| _Roll_DEC | 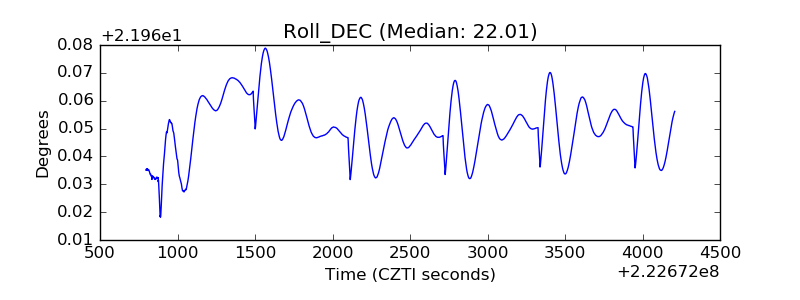 |
| _Roll_RA | 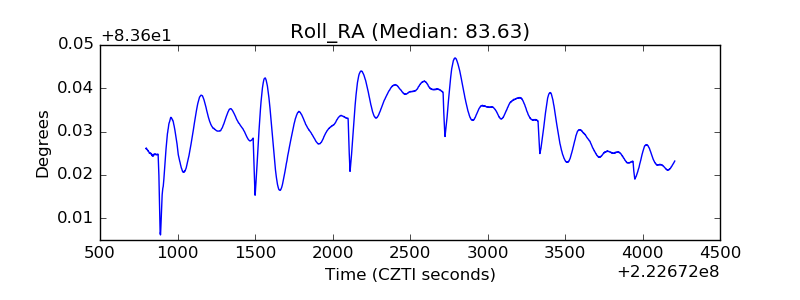 |
| Veto Counter | 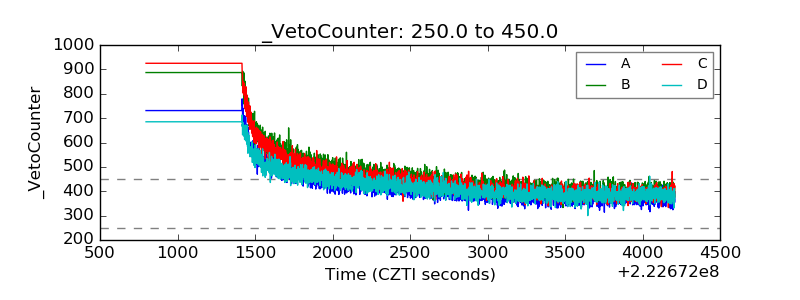 |