| Param | Original file | Final file |
|---|---|---|
| Filename | modeM0/AS1G06_051T01_9000000972cztM0_level2.fits | modeM0/AS1G06_051T01_9000000972cztM0_level2_quad_clean.evt |
| Size (bytes) | 680,388,480 | 657,527,040 |
| Size | 648.9 MB | 627.1 MB |
| Events in quadrant A | 4,094,396 | 3,876,877 |
| Events in quadrant B | 3,977,962 | 3,910,636 |
| Events in quadrant C | 4,045,416 | 3,717,112 |
| Events in quadrant D | 3,453,970 | 3,375,784 |
| Mode M9 | |||
|---|---|---|---|
| Quadrant | BADHDUFLAG | Total packets | Discarded packets |
| A | 0 | 154 | 0 |
| B | 0 | 154 | 0 |
| C | 0 | 154 | 0 |
| D | 0 | 154 | 0 |
| Mode SS | |||
|---|---|---|---|
| Quadrant | BADHDUFLAG | Total packets | Discarded packets |
| A | 0 | 1486 | 0 |
| B | 0 | 1486 | 0 |
| C | 0 | 1486 | 0 |
| D | 0 | 1486 | 0 |
| Mode M0 | |||
|---|---|---|---|
| Quadrant | BADHDUFLAG | Total packets | Discarded packets |
| A | 0 | 151764 | 0 |
| B | 0 | 157435 | 0 |
| C | 0 | 153149 | 0 |
| D | 0 | 176275 | 0 |
| Quadrant | Total seconds | Saturated seconds | Saturation percentage |
|---|---|---|---|
| A | 73427 | 913 | 1.243412% |
| B | 73426 | 1066 | 1.451802% |
| C | 73424 | 854 | 1.163107% |
| D | 73428 | 2680 | 3.649834% |
Noise dominated data is calculated using 1-second bins in cleaned event files. If a bin has >2000 counts, and if more than 50% of those come from <1% of pixels, then it is considered to be noise-dominated and hence unusable.
| Quadrant | # 1 sec bins | Bins with >0 counts | Bins with >2000 counts | High rate bins dominated by noise | Noise dominated (total time) | Noise dominated (detector-on time) | Marked lightcurve |
|---|---|---|---|---|---|---|---|
| A | 84954 | 72999 | 0 | 0 | 0.00% | 0.00% |  |
| B | 84954 | 72997 | 0 | 0 | 0.00% | 0.00% |  |
| C | 84954 | 72998 | 0 | 0 | 0.00% | 0.00% |  |
| D | 84954 | 72979 | 0 | 0 | 0.00% | 0.00% | 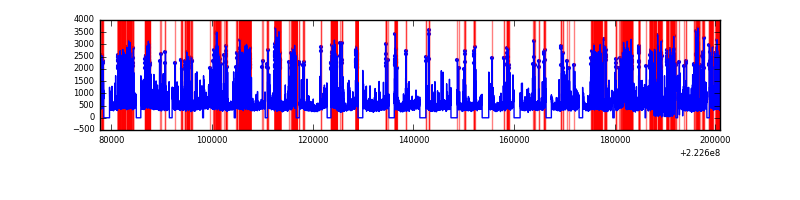 |
Top three noisy pixels from each quadrant. If the there are fewer than three noisy pixels in the level2.evt file, extra rows are filled as -1
| Pixel properties | Quadrant properties | ||||||
|---|---|---|---|---|---|---|---|
| Quadrant | DetID | PixID | Counts | Sigma | Mean | Median | Sigma |
| A | 0 | 29 | 3977 | 11.03 | 1064 | 991 | 270.8 |
| A | 7 | 110 | 3364 | 8.76 | 1064 | 991 | 270.8 |
| A | 0 | 30 | 3059 | 7.64 | 1064 | 991 | 270.8 |
| B | 2 | 9 | 3370 | 11.2 | 1046 | 991 | 212.4 |
| B | 3 | 17 | 2720 | 8.14 | 1046 | 991 | 212.4 |
| B | 5 | 128 | 2712 | 8.1 | 1046 | 991 | 212.4 |
| C | 1 | 80 | 2977 | 6.94 | 1068 | 984 | 287.1 |
| C | 1 | 81 | 2888 | 6.63 | 1068 | 984 | 287.1 |
| C | 12 | 241 | 2843 | 6.48 | 1068 | 984 | 287.1 |
| D | 6 | 231 | 2576 | 6.34 | 984 | 893 | 265.4 |
| D | 3 | 14 | 2512 | 6.1 | 984 | 893 | 265.4 |
| D | 7 | 5 | 2470 | 5.94 | 984 | 893 | 265.4 |
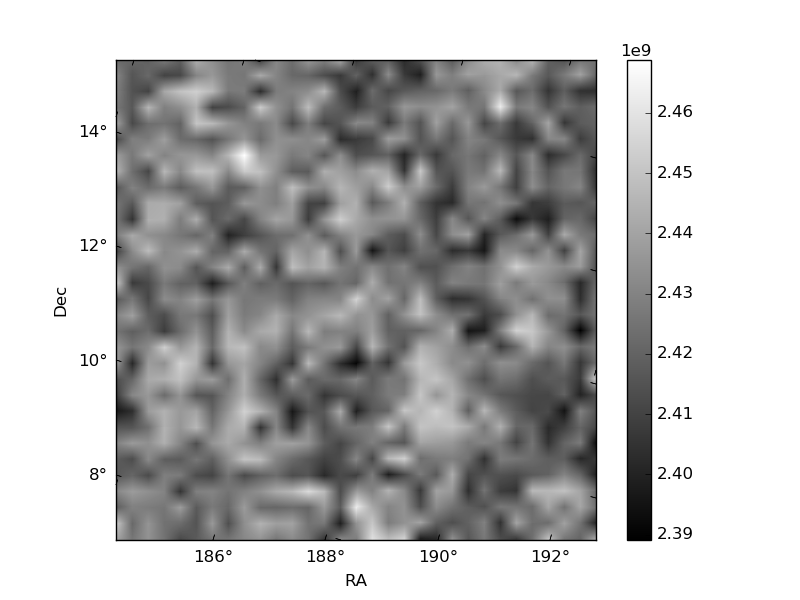
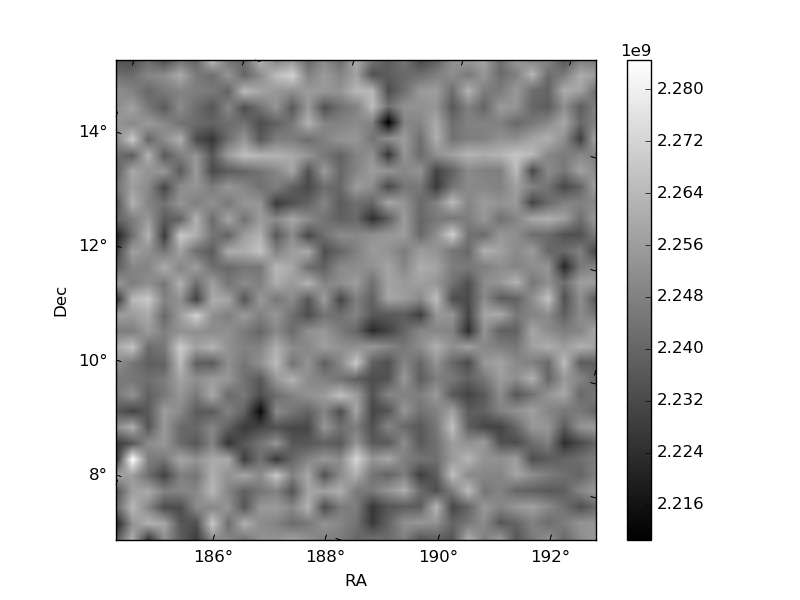
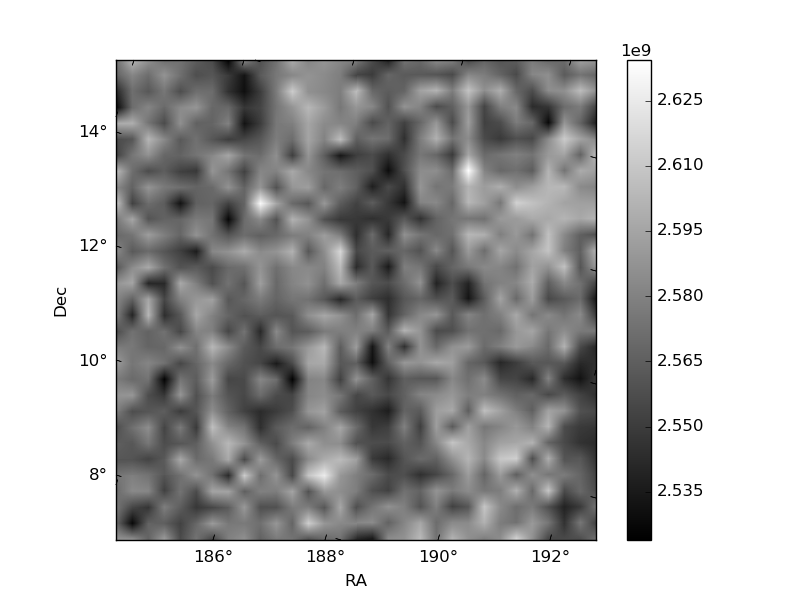
Histogram calculated using DETX and DETY for each event in the final _common_clean file
| Quadrant A | 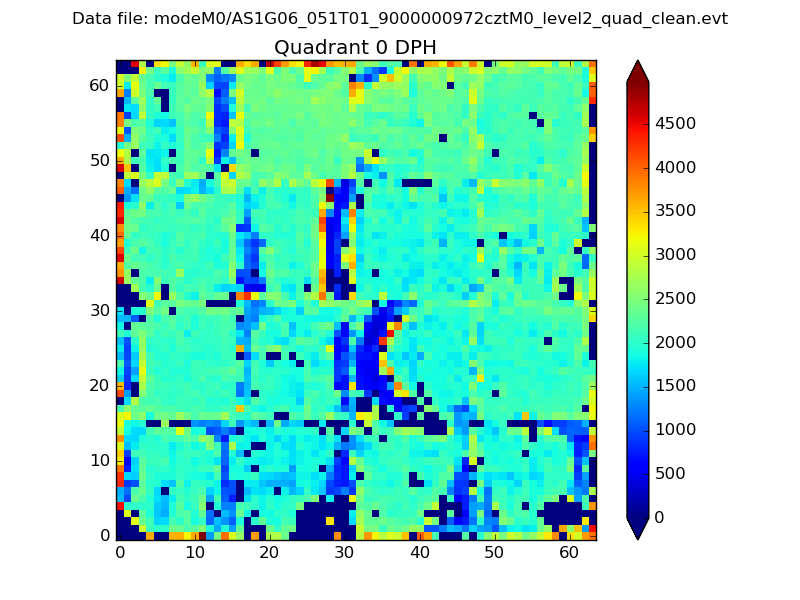 |
 |
Quadrant B |
|---|---|---|---|
| Quadrant D | 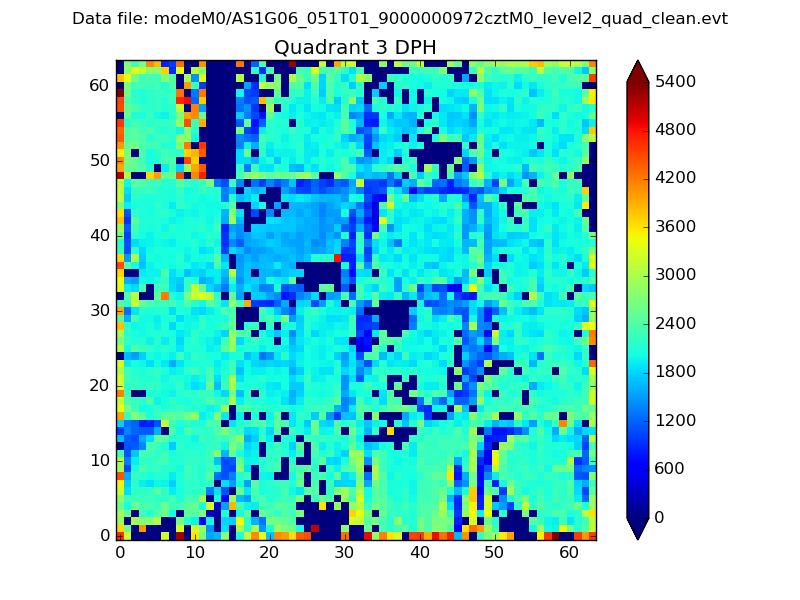 |
 |
Quadrant C |
| Plot type | Count rate plots | Images |
|---|---|---|
| Comparison with Poisson distribution Blue bars denote a histogram of data divided into 1 sec bins. Red curve is a Poisson curve with rate = median count rate of data. |
 |
 |
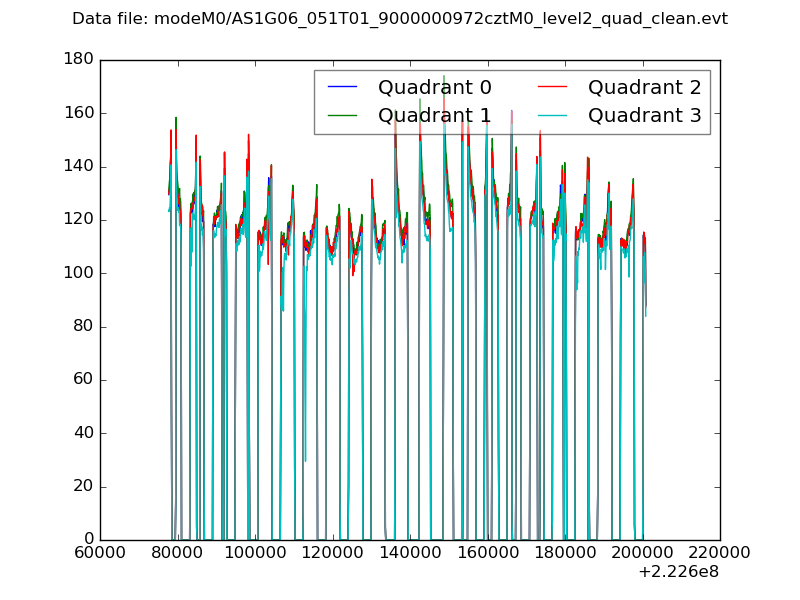
| Quadrant-wise count rates Data is divided into 100 sec bins |
 |
|
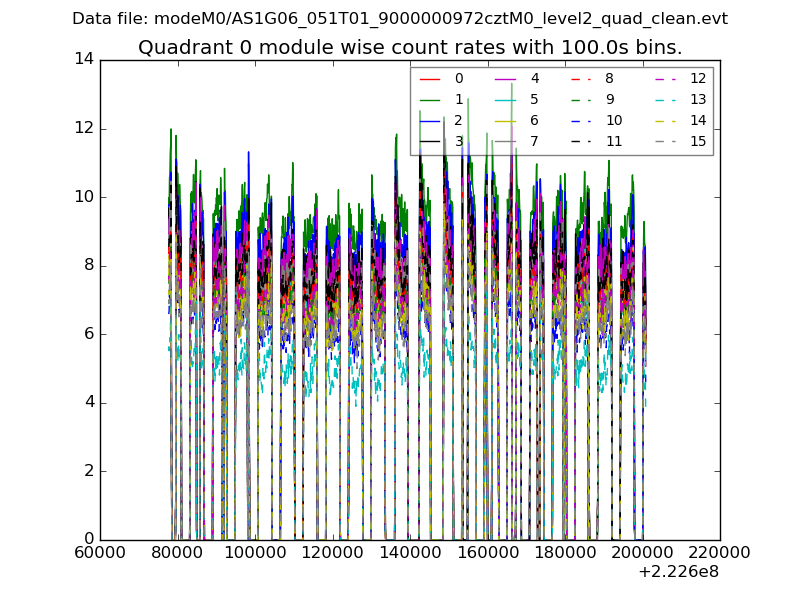
| Module-wise count rates for Quadrant A Data is divided into 100 sec bins |
 |
 |
| Module-wise count rates for Quadrant B Data is divided into 100 sec bins |
 |
 |
| Module-wise count rates for Quadrant C Data is divided into 100 sec bins |
 |
 |
| Module-wise count rates for Quadrant D Data is divided into 100 sec bins |
 |
 |
| Parameter | Plot |
|---|---|
| CZT HV Monitor |  |
| D_VDD |  |
| Temperature 1 |  |
| Veto HV Monitor |  |
| Veto LLD | 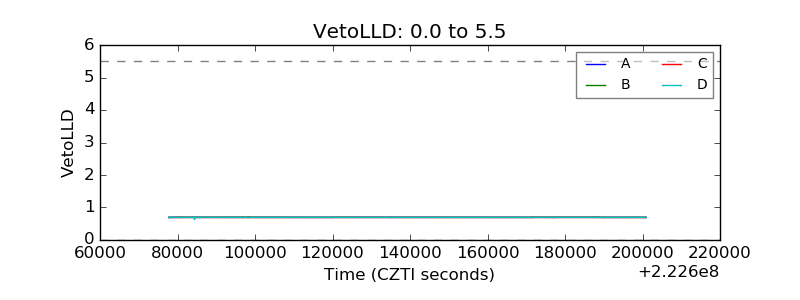 |
| Alpha Counter |  |
| _CPM_Rate |  |
| CZT Counter |  |
| +2.5 Volts monitor |  |
| +5 Volts monitor | 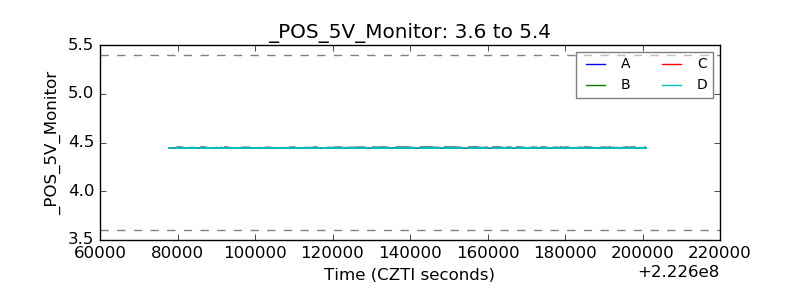 |
| _ROLL_ROT |  |
| _Roll_DEC |  |
| _Roll_RA |  |
| Veto Counter |  |